Simple Fibonacci RetracementSimple Fibonacci Retracement is a free and easy to use script to plot Fibonacci levels, for any assets like Stocks, Forex, Commodities , Cryptocurrencies etc. on any time frame chart.
Fibonacci Levels can be plotted using Lookback or manual Price input from the settings.
1. Lookback type - Candles
Determines the High and Low price of the user input number of Candles back (100 default) and plots Fibonacci Levels based on the calculated High and Low for the number of candles in the past from the current candle. The levels stay intact on any time frame as long as no new Highs or Lows are formed.
2. Lookback type - Days
Determines the High and Low price of the user input number of Days back (100 default) and plots Fibonacci Levels based on the calculated High and Low for the number of days in the past from the day of the current bar. The levels stay intact on any time frame as long as no new Highs or Lows are formed.
3. Manual Price Input
Plots Fibonacci Levels based on the user specified High and Low Price in the settings input fields. The levels stay intact on any time frame irrespective of new Highs or Lows being formed. Manual Price Input will enable the trader to keep the Levels intact and visually see the higher Fibonacci Retracement levels, when the price crosses beyond 100% retracement. On the other two lookback types, the Fibonacci levels are displayed only upto 100% retracement.
The Fibonacci levels can also be reversed by enabling 'Reverse' option from the settings.
Ritracciamento di Fibonacci
Consolidation Zones - LiveHello Traders!
This is the script that finds Consolidation Zones in Realtime.
How it works?
- The script finds highest/lowest bars by using "Loopback Period"
- Then it calculates direction
- By using the direction and highest/lowest bar info it calculates consolidation zones in realtime
- If the length of consolidation area is equal/greater than user-defined min length then this area is shown as consolidation zone
- Then Consolidation Zone extends automatically if there is no breakout
if you increase the Loopback Length then you get bigger consolidation zones:
You have option to "Paint Consolidation Area" or not:
Enjoy!

Freedom FibThis script will allow to automatically draw levels on the chart for a potential pullback play like shown in this snapshot here
It will draw risk/reward levels upon your favorite ema (default is 13ema) as the price goes and it will work for both long or short scenarios for a potential trend continuation play.
You got the option to align your level to match exactly your selected ema or to be placed in between the first two levels (default settings) if you prefer.
I personally use this one settings for shorter time frames (up to 3min) and the aligned one for higher time frames.

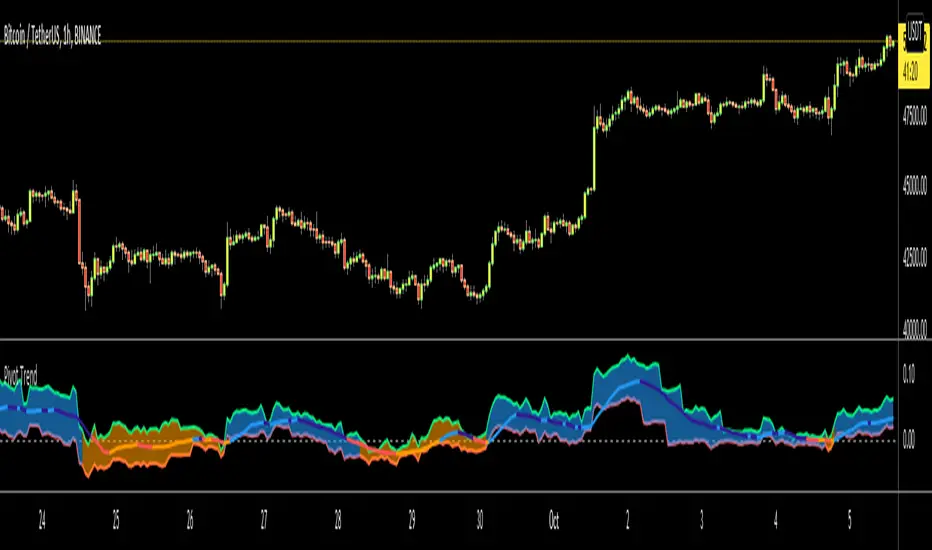
Pivot TrendHello Traders,
Another original idea is here with you. Actualy I can say that it's a breakout strategy that uses multiple Pivot Point's averages.
How it works?
- it finds the Pivot Points, you can set the length as you want
- it gets averages of Pivot Highs and Pivot Lows, you can set the number of Pivot Points to be included
- it compares the current closing price with averages of Pivot Highs and Pivot Lows
- if both are positive or negative then trend changes
You have two options:
- Pivot Point Period => is the length that is used to find Pivot Points. means it checks left/right bars if it's Pivot Point (4 by default)
- Number of PP to check => is the number of Pivot Points that the script finds and calculates the averages (3 by default)
An Example with the settings Pivot Point Period = 5 and Number of PP to check = 2
Play with settings as you wish. Comments are welcome, together we can improve it ;)
Enjoy!
Auto FibonacciA series of Fibonacci sequences using a variety of triggers to base highs and lows off.
High and low look back length can be altered, fibs and fib extensions can be shown or hidden and the background can be filled or transparent.
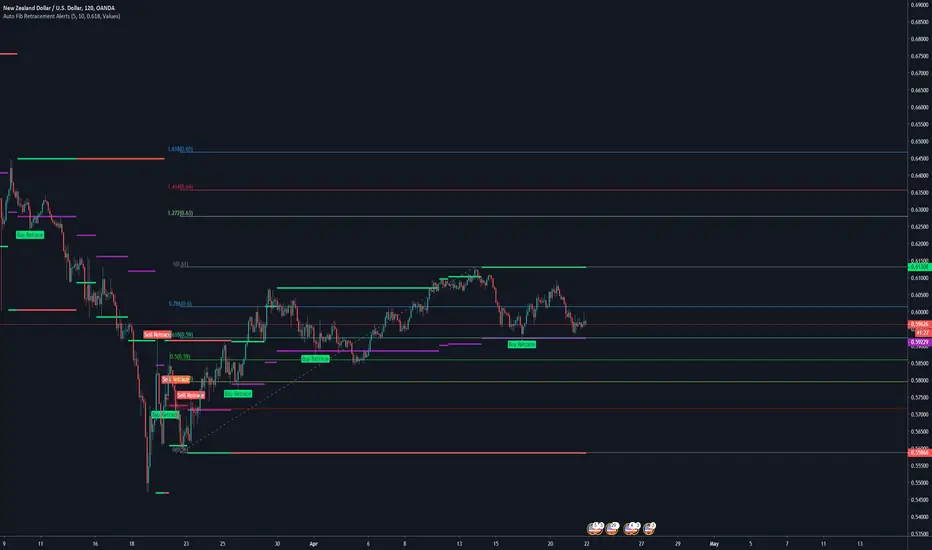
Auto Fib Retracement AlertsFor the fibonacci traders.
The Auto Fib Retracement Is a good indicator for tradingview to show you the current alerts and points to watch in the market
IMPORTANT SETTING => Retracement
This controls your alert levels
I have modified it to deliver the following
+Custom Fib retracement level alerts
+Drawing of old levels and retracement levels
+Backtesting Old Alerts
There are two shapes drawn on the chart;
Shown When the fib end is attained and market retraces back to your level
1. Buy retracement -
2. Sell retracement
How are they detected?
When we have new levels in the market; this is when the red or gree line changes, we calculate the new fib level that we will be watching for retracement
This is the purple level drawn on the chart
When the market first crosses below or above this level, The alert will be fired.
Consequent crosses are not updated
Enjoy! 😍
Originally requested by trade atechproduction
EMA / Fibonacci / Bollinger Indicator for Market Sniper SuiteHello all,
this script was created to be used in conjunction with Market Sniper - Trading/Scalping Suite . It was put together to make instrument analysis faster and less convoluted.
It includes
9 Fibonacci Exponential moving averages + 2 Simple moving averages
Auto Fibonacci levels - Tradingviews Auto Fib Retracement - with some modifications
Bollinger Bands - To faster spot squeeze momentum

Fibonacci Retracament Levels - Only for intraday.Fibonacci Retracament Levels - Only for intraday.
Perfect and best levels.
Works on all scripts with 5 and 15 mins.
Try and keep me posted.

Trend LinesHello Everyone! This is my new trend lines script (after beta version that was published almost one year ago)
The idea is to find Pivot Highs (PH) and Pivot Lows(PL) first.
Then, If current PH is smaller then previous PH (means no new higher high and possible downtrend) then draw trend line using them. and also it checks previous trend line (if exits) and if current angle is smaller then don't extend previous one.
Same idea when using Pivot Lows, If current PL is higher then previous PL (means no new lower low and possible uptrend) then draw trend line using them. and also it checks previous trend line (if exits) and if current angle is smaller then don't extend previous one.
Optionally style of old trend lines drawn as dashed.
Hope you enjoy it!

[fikira] Fibma/Fibema StrategyMy strategy regarding the Fibma/Fibema lines (also see my Fibma/Fibema study)
You can enable/disable each strategy to see what
works best in what timeframe
Thanks!
[fikira] Fibonacci MA / EMA's (Fibma / Fibema)I've made SMA/EMA's NOT based on the principle of the 2(1+1), 3(2+1),
5(3+2), 8(5+3), 13(8+5), 21(13+8), 34(21+13), 55(34+21), ... numbers,
but based on these following Fibonacci numbers:
0,236
0,382
0,500
0,618
0,764
1
Ending up with 2 series of Fibma / Fibema:
"Tiny Fibma / Fibema":
24, 38, 50, 62, 76, 100
"Big Fibma / Fibema":
236, 382, 500, 618, 764, 1000
IMHO it is striking how these lines often act as Resistance/Support,
although (except the 50, 100 & 500) they are not typical MA/EMA's.
They perform very well on every Timeframe as well!
Week:
3 Days:
1 Day:
4h:
1h:
Even on the 15 minutes:
Or 5':
Things to watch for:
Price compared to the Tiny or Big Fibma / Fibema (below or above)
Price compared to important Fibma / Fibema (for example below or
above MA 236, MA 764, MA 1000, ...)
Crossing of Fibma / Fibema 24/76, 236/764 and 38/62, 382/618
(bullish crossover = Lime coloured "cloud", bearish crossunder = Red coloured "cloud"),
...
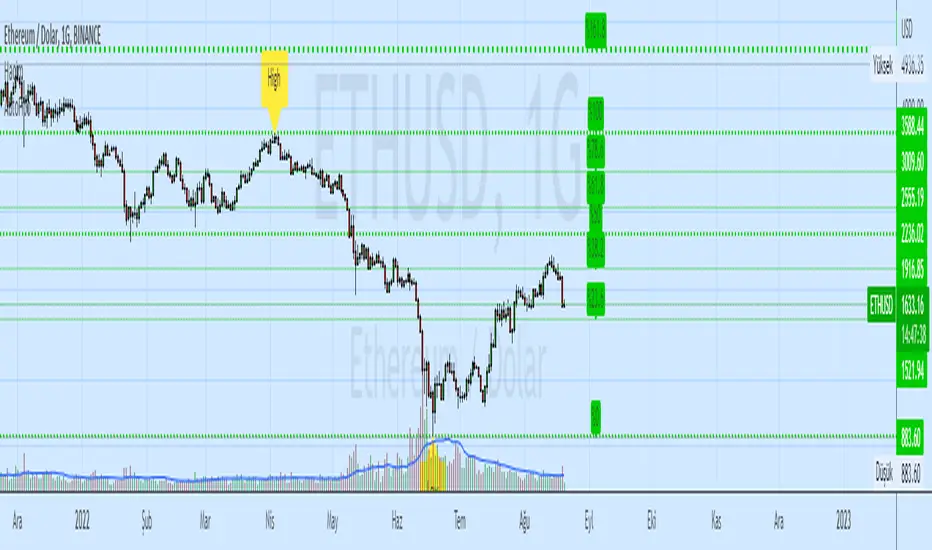
I've made a change in barcolor if the close crosses the "Big Fibma / Fibema 500"
If price closes above MA/EMA 500, the first bar is yellow coloured,
if price stays above this level, candles are coloured lime/orange (= very bullish)
If price closes under MA/EMA 500, the first bar is purple,
if price stays under this level, candles are standard coloured (= very bearish)
Strategy will follow,
Thanks!

Smart Indicator 21 - Fibonacci LinesA simple Indicator that create Fibonacci Lines as Price.
It's a good way to see next Support and Resistance.

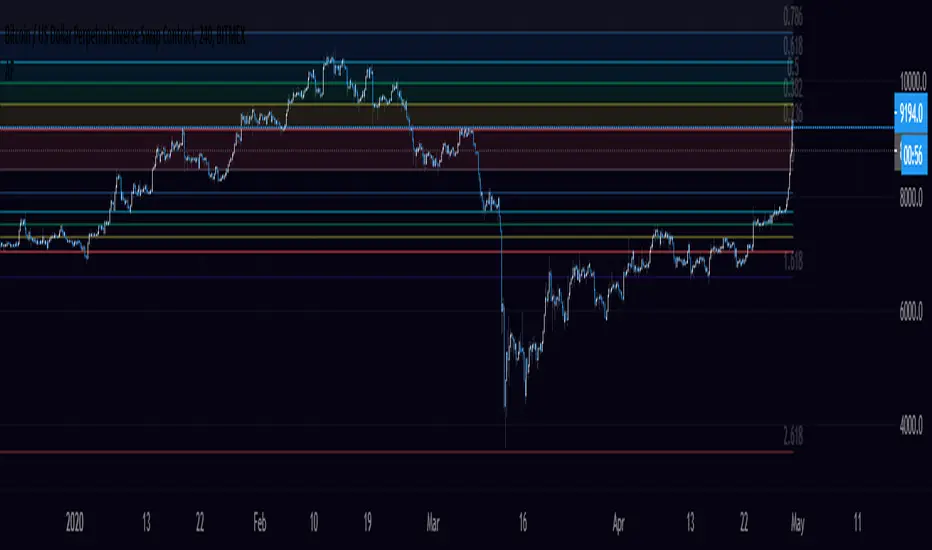
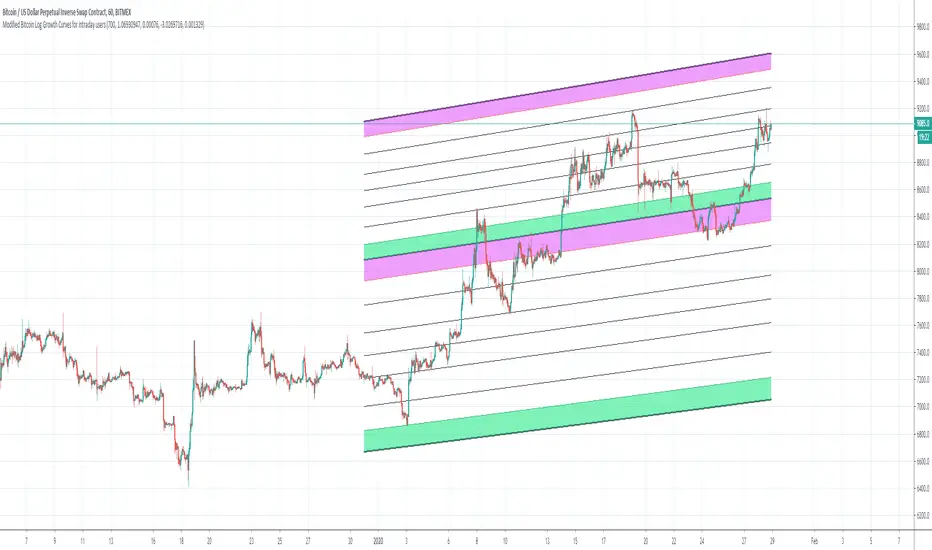
Bitcoin Logarithmic Growth Curves for intraday usersI wish to thank @Quantadelic who created this great indicator and leaving it open for others to improve.
I have made changes to make it user-friendly for the intraday traders.
The changes made have been;
1. Compartmentalized each area of the major Fibonacci level;
2. Added minor Fibonacci levels;
3. Color-coded the support and resistance levels, for better viewing;
4. Zoned each area of the major Fibonacci level; and
5. Created a time-frame display period for quicker loading of the indicator.
I have removed a few things to allow the indicator to run quicker;
1. Future projections; and
2. The major higher levels of the Fibonacci, which may be useful when Bitcoin reaches 100k.
Enjoy
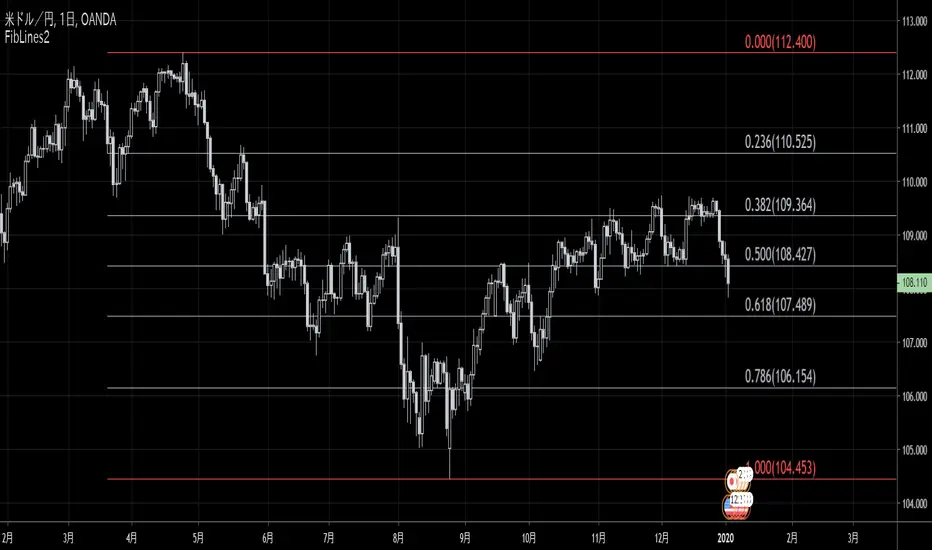
FibLines2This script is a new version of "FibLines" which automatically draws Fibonacci Lines on chart.
0% line and 100% line are determined by "Period" and "Delay" parameter.
◆Params
- Period: specifies periods to detect the highest (bearish) fractal and the lowest (bullish) fractal.
- Delay: specifies the number of new bars you ignore.
(👇 old version)
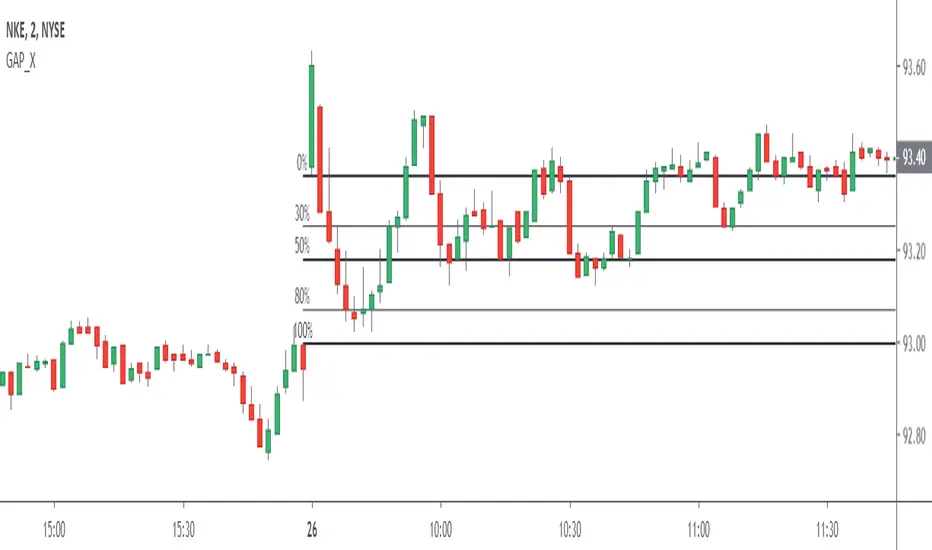
Gap Automatic Retrocess LevelsThis Script detects Bearish / Bullish GAP at market opening 09:30 am NY and automatically traces backward levels, of which 2 are configurable at your discretion.
Bundle of various indicators, All-in-oneThis scripts compiles many indicators into one. It comes from many sources and i added all sources i used. If i forgot one, don't hesitate to message me.
This is useful if you need to setup your chart layout fast. The menu makes it easy to configure it.
You can configure and display:
- Various types of moving averages: RMA, SMA , EMA , WMA , VWMA , SMMA , HullMA, LSMA , DEMA , TEMA
- Stochastic RSI crosses from multi-timeframes directly on candle's close (1h, 4h, D, W)
- Bollinger bands with primary and secondary deviation
- SAR
- Color background using difference between Stochastic RSI K and D
- Support and resistance
- Open high low close from higher timeframes (D, W, M)
- Auto fibonacci levels (still a work in progress, i will add logarithmic fibonacci levels too later)
- "Alt season" for crypto users: if BTC dominance cross his SMA , display a pictogram on every chart
Stil working on:
- Auto fibonacci levels: i will add logarithmic fibonacci levels
- Stochastic crosses
- Alt season: use others types of moving averages
If you have any suggestions / improvements, feel free to message me or write it in the comments below.


Custom Timeframe FibsThis is a testing project for fib levels to try out fivs on multi timeframes
Thank you ShoujiSuzuki


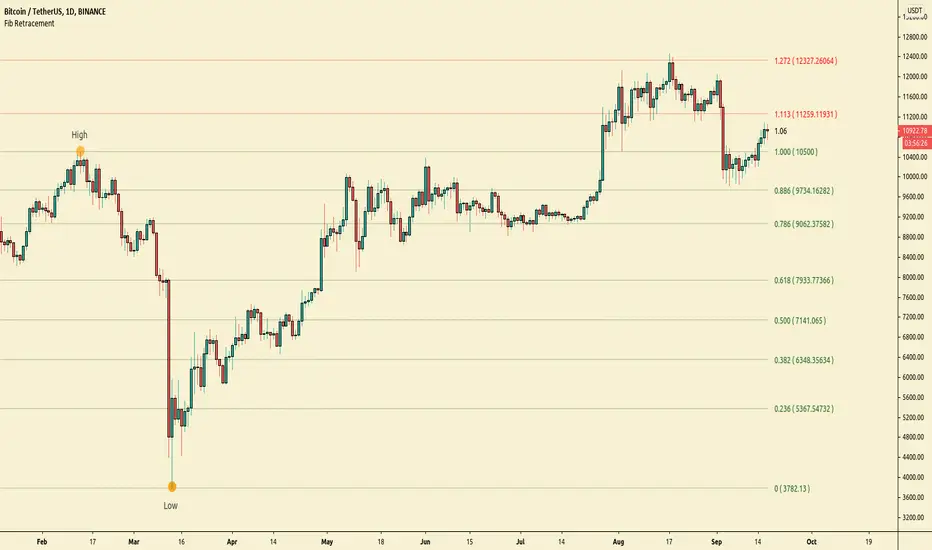
™TradeChartist Fib Extensions™TradeChartist Fib Extensions is a free to use script that helps traders plot Fibonacci Extensions on chart. Even though Trading View has a Fib extensions tool, some traders may prefer a plotting script like this with Fib plot lines extending across the whole of the chart to track historic prices in relation to Fib extensions drawn.
----To draw Fib extensions for uptrend ,
1. Choose a Pivot Low point (LL or a HL) as Pivot 1
2. Choose a Pivot High point (must be higher than Pivot 1) as Pivot 2
3. Choose a Pivot Low point (must be lower than Pivot 2, must be Higher than Pivot 1)
----To draw Fib extensions for downtrend,
1. Choose a Pivot High point (HH or a LH) as Pivot 1
2. Choose a Pivot Low point (must be lower than Pivot 1) as Pivot 2
3. Choose a Pivot High point (must be higher than Pivot 2 and lower than Pivot 1)
Negative extensions of -23.6% and -61.8% fib plots may be useful for some to spot reversals or to set stop losses.
Higher levels can be used if price goes beyond 161.8%
This is a free to use indicator. Give a thumbs up or leave a comment if you like the script
Check my 'Scripts' page to see other published scripts. Get in touch with me if you would like access to my invite-only scripts for a trial before deciding on a paid access for a period of your choice. Half-Yearly, Annual and Lifetime access available on invite-only scripts along with 1hr Team Viewer intro session.

Rumpy's D/W AutofibsUses yesterday's & last week's high/low to plot auto fibs.
You can toggle them on/off separately as it does become a bit cluttered with both enabled.
--------------------------------------
If you find it useful please consider a tip/donation :
BTC - 3BMEXEDyWJ58eXUEALYPadbn1wwWKmf6sA
--------------------------------------
Weekly fibs
--------------------------------------
Daily fibs

Higher High Lower Low Strategy (With Source Code)This script finds pivot highs and pivot lows then calculates higher highs & lower lows. And also it calculates support/resistance by using HH-HL-LL-LH points.
Generally HH and HL shows up-trend, LL and LH shows down-trend.
If price breaks resistance levels it means the trend is up or if price breaks support level it means the trend is down, so the script changes bar color blue or black. if there is up-trend then bar color is blue, or if down-trend then bar color is black. also as you can see support and resistance levels change dynamically.
If you use smaller numbers for left/right bars then it will be more sensitive.
source code of :