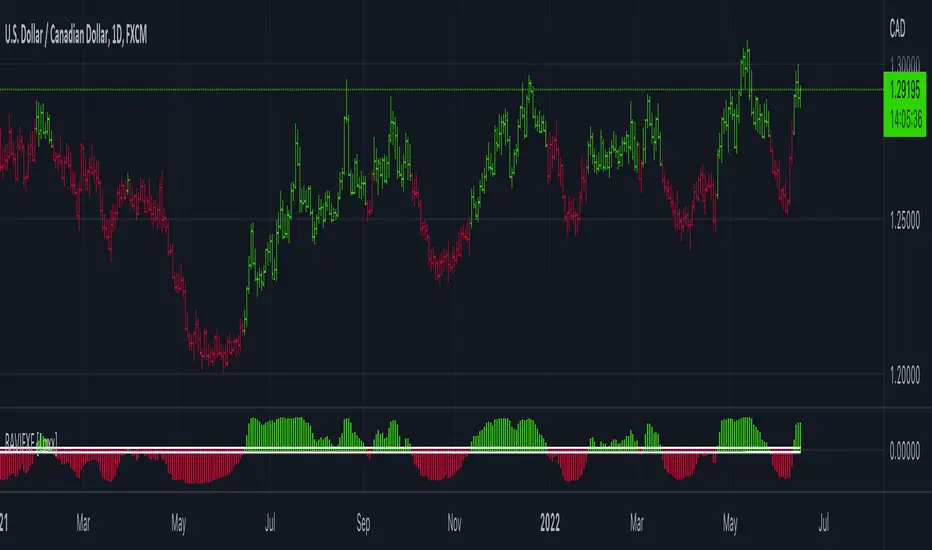
RAVI FX Fisher [Loxx]RAVI FX Fisher is a special implementation of RAVI using WMA moving averages and ATR and then normalized like Fisher Transform. If the histogram falls between the white lines, the market is too choppy to trade. This indicator is tuned for Forex.
What is RAVI?
The Range Action Verification Index (RAVI) indicator shows the percentage difference between current prices and past prices to identify market trends. It is calculated based on moving averages of different lengths.
Included:
-Change bar colors
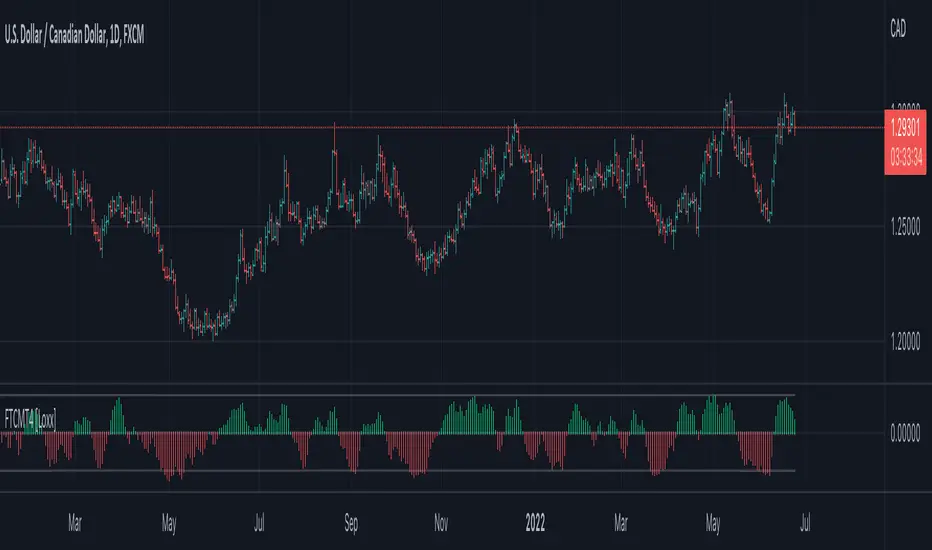
Fisher
Fisher Transform, clone of MT4 "Fisher_no_repainting" [Loxx]The Fisher Transform is a technical indicator created by John F. Ehlers that converts prices into a Gaussian normal distribution.1 The indicator highlights when prices have moved to an extreme, based on recent prices. This may help in spotting turning points in the price of an asset. It also helps show the trend and isolate the price waves within a trend.
Included:
- Oversold and overbought regions
This is an exact clone of the "Fisher_no_repainting" MT4 indicator
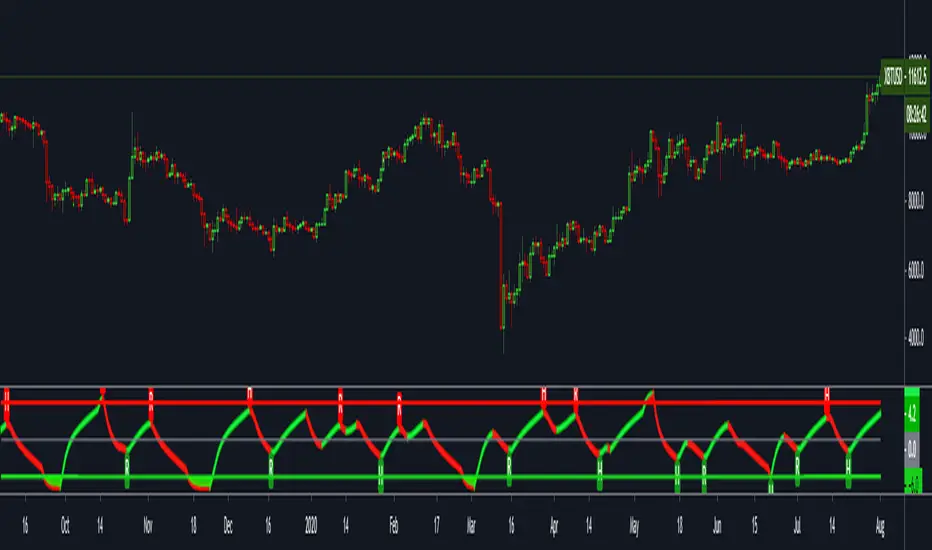
OPAL - Sense→ Hi everyone, very proud to publish my unique leading oscillator ! ←
Sense is a "leading indicator" : it shows what can happen in the future, meanwhile a lagging indicator like MAs shows past sentiment.
Sense diverging with Price ? Care at the reversal !
It can be a great tool to upgrade your timings, after a divergence for example, to snipe reversals or to find Trend entries.
This tool is used for sniping in our levels trading setup (in our trading community)
Sense is made of everything you know about common indicators :
RSI/STOCH/STOCHRSI/MFI/RVSI/PZO/VZO/MOMENTUM/VOLUMES/UO
>>> Basically shows situations where almost all the known indicators reach interesting points in Overbought and Oversold zones
Signals provided :
*Visible and Hidden Minor OB/OS Crosses (Small Arrows)
*Visible and Hidden Major OB/OS Crosses (Bigger Arrows)
*Visible and Hidden Major and Minor Confluence in OB/OS Zones (Rockets/Blood)
*Background Smart Coloring when price reaches OB/OS Zones :
- blue/purple = entering OB/OS Zones
- green/red = extrem multiple OB/OS situation
*Coloration of Middle Line based on std Price Deviation
*Smart Divergences spotting : applied level filter to get divergences that reached OB/OS Zones at least once.
Divergences are scanned twice for confirmation<
*Full alerting system on :
- Full signals = blood and rockets
- Half signals = bigger arrows
- Minor signals = small arrows
- Dual Divergences = on both oscillators (slow & fast)
1) What is the curve i see on Sense ? => It is my homemade oscillator, described above
2) What are thoses Zones around the curve ? => Overbought/Oversold Zones
3) What are those dots on the curve ? => When the oscillator crosses its Triggerline
4) What are those little arrows ? => Printing minor Overbought/Oversold situations
5) What are those bigger arrows ? => Printing major Overbought/Oversold situations
6) What are those Blood dots/ Rockets ? => Printing Confluence situations in Overbought/Oversold Zones
7) Why is background coloring ? => I applied smart coloration based on oscillators location (see above coloration meaning)
8) What are those lines between curve spikes ? => Situations when Price and oscillator are doing different moves, basically divergences, meaning a correction can happen sooner or later
Should be strong on almost every timeframe !
Always backtest, watch, then use or not in your trading strategy.
If you like my work, leave a like :)
Hoping you success !

Indicator Direction Table With Bullish & Bearish LabelsINDICATOR DIRECTION TABLE WITH BULLISH AND BEARISH LABELS
This is a table that shows the bullish, bearish or neutral trend for nine different popular indicators. Each indicator label will change color in real time to make you aware of each change in direction. This way you don’t have to read and analyze a bunch of different indicators constantly and you can focus on price action instead.
Look for the entire table to turn green or red before taking positions.
You can also set alerts for when the entire table of indicators is bullish or bearish.
The indicator settings allow customization of indicator lengths & values, table position and turning the indicator table on or off.
The length and other values for each indicator can be customized to suit your preferences, but by default all of them are set to the normal default settings that Tradingview supplies the indicators with. Typically 14 as the length.
The indicators used in this table are as follows:
MACD - Moving Average Convergence Divergence
Stochastic RSI - Stochastic Relative Strength Index
Vortex - Vortex Indicator
Momentum - Momentum Indicator
RSI - Relative Strength Index
PSAR - Parabolic Stop & Reverse
DMI - Directional Movement Index
MFI - Money Flow Index
Fisher - Fisher Transform Price Action
***MARKETS***
This indicator can be used as a signal on all markets, including stocks, crypto, futures and forex.
***TIMEFRAMES***
This indicator table can be used on all timeframes.
***TIPS***
Try using numerous indicators of ours on your chart so you can instantly see the bullish or bearish trend of multiple indicators in real time without having to analyze the data. Some of our favorites are our Auto Fibonacci, Directional Movement Index + Fisher Price Action, Volume Profile With Buy & Sell Pressure, Auto Support And Resistance and Money Flow Index in combination with this indicator direction table. They all have unique features to help you make better and faster trading decisions.

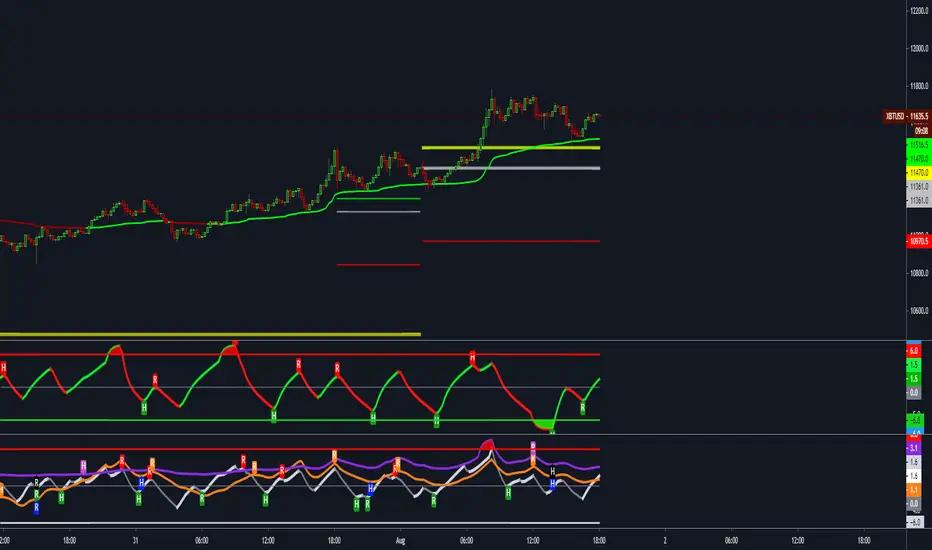
Directional Movement Index + Fisher Price Action With LabelsDIRECTIONAL MOVEMENT INDEX + FISHER PRICE ACTION WITH LABELS
Directional Movement Index shows buy and sell pressure.
Fisher transform shows price action trending bullish or bearish.
Caution dots notify you of conflicting trends.
***HOW TO USE***
The top lines are the fisher transform showing you the price action trend.
The bottom lines filled with color shows the DMI directional movement index.
The yellow dots at the bottom tell you if these two indicators are currently giving conflicting signals.
DMI
If the green line is above the red line and the background is colored green, there is more market buying than selling.
If the red line is above the green line and the background is colored red, there is more market selling than buying.
FISHER TRANSFORM
If the lines are painted green, the price action is trending up.
If the lines are painted red, the price action is trending down.
CAUTION DOTS
If a yellow dot shows up at the bottom of the chart, it is notifying you that the DMI and Fisher Transform are currently giving opposite signals…. so use caution.
***BULLISH/BEARISH LABEL***
There is also a label on the right side that tells you whether there is more buying or selling. This table updates in real time and changes colors so you can get an easy, quick interpretation of the current buy/sell pressure without having to look at the indicator data so you can make faster decisions on whether to enter or exit a trade.
Green means more market buying than selling.
Red means more market selling than buying.
Blue means an equal amount of market buying and selling.
If buying pressure is bullish but below the 20 level, a second label will show up in purple letting you know there is weak buying pressure so use caution.
If selling pressure is bearish but below the 20 level, a second label will show up in purple letting you know there is weak selling pressure so use caution.
There is a third label showing the current trend of the fisher transform. Green means bullish price action. Red means bearish price action.
The fourth label is orange and only shows up when the DMI and Fisher Transform are currently giving opposite signals, so make sure you use caution during those times.
***MARKETS***
This indicator can be used as a signal on all markets, including stocks, crypto, futures and forex.
***TIMEFRAMES***
This directional movement index + fisher transform indicator can be used on all timeframes.
***TIPS***
Try using numerous indicators of ours on your chart so you can instantly see the bullish or bearish trend of multiple indicators in real time without having to analyze the data. Some of our favorites are our Auto Fibonacci, Volume Profile, Momentum, Auto Support And Resistance and Money Flow Index in combination with this Directional Movement Index + Fisher Transform. They all have real time Bullish and Bearish labels as well so you can immediately understand each indicator's trend.

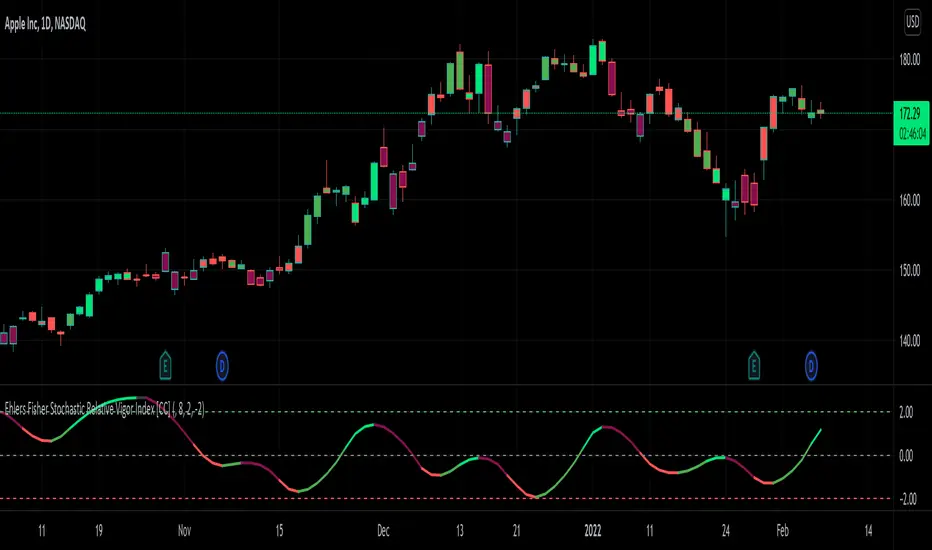
Ehlers Fisher Stochastic Relative Vigor Index [CC]The Fisher Stochastic Relative Vigor Index was created by John Ehlers (Cybernetic Analysis For Stocks And Futures pgs 101-104) and this is a many layered indicator created from his original Relative Vigor Index turned into a stochastic and then performing a Fisher transform on the results. I have included extra smoothing to provide clearer buy and sell signals as well as normal and strong buy and sell signals. As always strong signals are darker in color and normal signals are lighter in color. Buy when the line turns green and sell when it turns red.
Let me know if there are any other scripts you would like to see me publish!
Inverse Fisher Transform on Williams %RInverse Fisher Transform On Williams %R
Since Williams R indicator produces negative values, I preferred to add 50 instead of subtracting 50.
It produces values between 0.5 and -0.5.
Generates clear buy and sell signals.
Williams %R determines overbought and oversold levels.
You can see more softly.

QF FISHERQF fisher is based on John Ehler's fisher transform which converts prices into a Gaussian normal distribution. Its usefulness is in identifying overbought and oversold levels and due to its sharp reversals it provides fast divergences with high accuracy.
QF Fisher is calculated using adaptive period to work on multiple timeframes.

Fish Sniper - TrendicatorThis is a modified version of the Fisher Indicator.
How to use:
If you see the white stream crossing up or down on the dotted/dashed hlines then you are seeing the price and trend heading that direction. The green bars indicate an optimal long position, and the red bars indicate a short or an exit position. The green and red bars show when the white stream passes just above or below the ZERO line (dashed Aqua line).
While entering/exiting on the green/red bars generally a good strategy, it's good to look at the bigger picture and see how far the white stream has traveled to reach the ZERO line. You can often avoid trading on a sideways market if you notice smaller movements on the white stream.
This indicator will also draw a grey candle on your chart to signal it's time to exit a long trade and it will draw a purple candle when it's time to enter a long.
I mostly use this indicator as an additional confirmation to enter or exit an open position, it's worked well for me in avoiding some big drops in my crypto trading and entering early on some nice uptrends.

Pivot Range - Fisher's Methodology(1D & 3D & W & M)Pivot Range - Fisher's Methodology(1D & 3D & W & M)
Version 2.00
Created by TWA_TradeWithAmir(TWA_PriceActionTips)
Updated 10/29/2020
Based On Mark B. Fisher's ACD Methodology
* 1D Pivot Range, 3D Pivot Range, Weekly Pivot Range & Monthly Pivot Range

Daily Risk RangesThis indictor creates daily Risk Ranges using historical volatility, volatility skew and vol-of-vol.

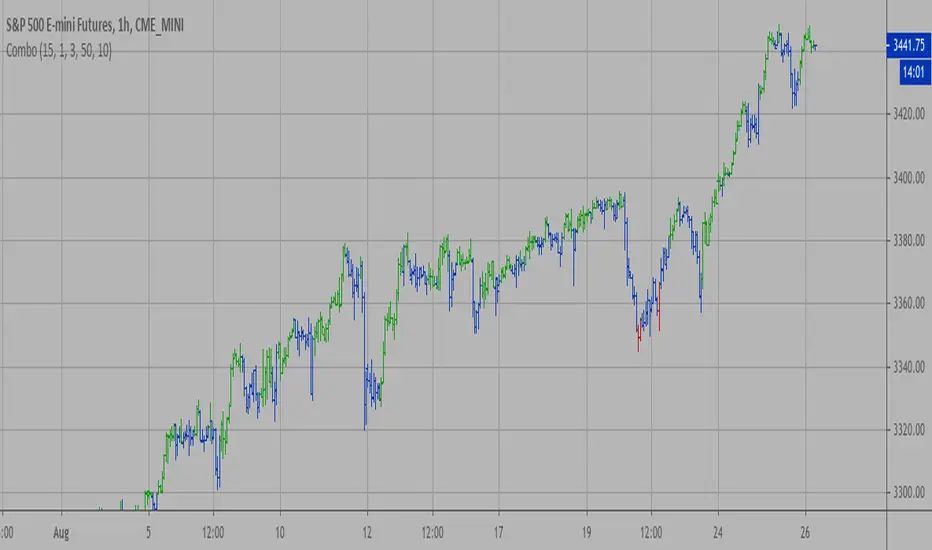
Combo Strategy 123 Reversal & Fisher Transform Indicator This is combo strategies for get a cumulative signal.
First strategy
This System was created from the Book "How I Tripled My Money In The
Futures Market" by Ulf Jensen, Page 183. This is reverse type of strategies.
The strategy buys at market, if close price is higher than the previous close
during 2 days and the meaning of 9-days Stochastic Slow Oscillator is lower than 50.
The strategy sells at market, if close price is lower than the previous close price
during 2 days and the meaning of 9-days Stochastic Fast Oscillator is higher than 50.
Second strategy
Market prices do not have a Gaussian probability density function
as many traders think. Their probability curve is not bell-shaped.
But trader can create a nearly Gaussian PDF for prices by normalizing
them or creating a normalized indicator such as the relative strength
index and applying the Fisher transform. Such a transformed output
creates the peak swings as relatively rare events.
Fisher transform formula is: y = 0.5 * ln ((1+x)/(1-x))
The sharp turning points of these peak swings clearly and unambiguously
identify price reversals in a timely manner.
WARNING:
- For purpose educate only
- This script to change bars colors.
FTSXFisher transform & RSX for reversal points in price.
Potential price reversals are regular divergences and potential trend continuations are hidden divergences, OB/OS levels are shown with red and green lines.
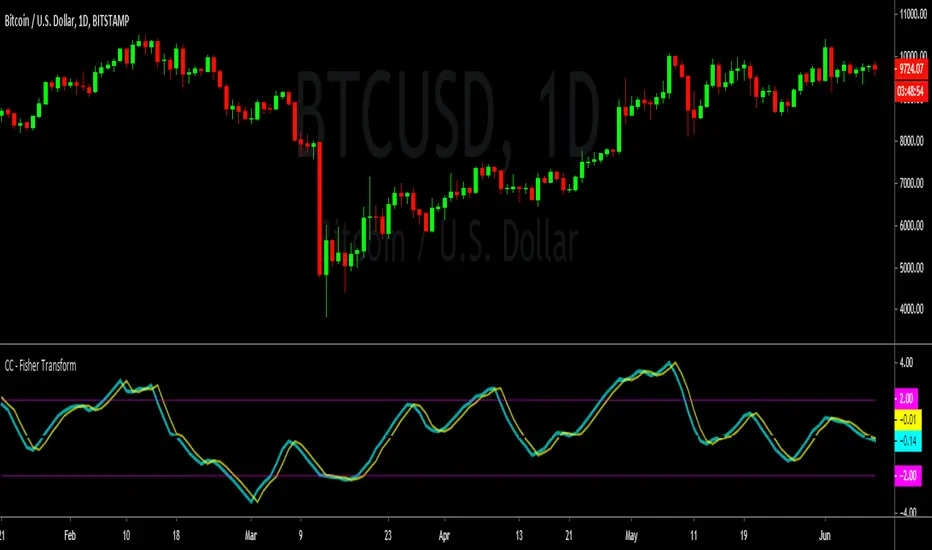
Cracking Cryptocurrency - Fisher TransformCracking Cryptocurrency - Fisher Transform
A modern spin on a classic. John Ehler's formulas helped transform a generation of traders from working with traditional indicators such as Stochastic and moving average filters to applying frequency and wave theory to their price chart analysis. There are few tools as powerful as Ehler's Fisher Transform , which transforms the behavior of price in a Gaussian Distribution, or a Normal Probability Distribution. This allows us to attain a bell curve of price, with our outliers clearly and objectively identifiable as well as accurately indicate trend direction by bisecting our wave into peaks and troughs.
Features & Functions
Simple and Clean. Only the data you want, no unnecessary information cluttering your work flow.
Adjustable Sources. Select which data source you want to compile your data from from an easy drop-down menu.
Adjustable Triggers. Standard versions of the Fisher have been unable to innovate on the Trigger Line, a vital part of utilizing this to generate trade signals and setups. In this version, choose and adjust your own Trigger and Smoothing Filter based on tried and true implementations.
Adjustable Thresholds. Most versions of the Fisher do not truly allow the customization of the algorithm to suit the asset you are analyzing. All thresholds in this version are fully adjustable to customize this indicator to work for you, not against you.
---
Purpose
To remain true to Ehler's original vision of the Fisher Transform while providing traders a functional and efficient indicator with modern innovations and conveniences.
Ehlers Fisher Transform Indicator [CC]The Fisher Transform Indicator was created by John Ehlers and the beauty of this indicator is that it provides sharp and clear turning points that are also very early. Buy when the indicator line is green and sell when it is red.
This was a special request so let me know if you would like me to publish other scripts or if you want something custom done!

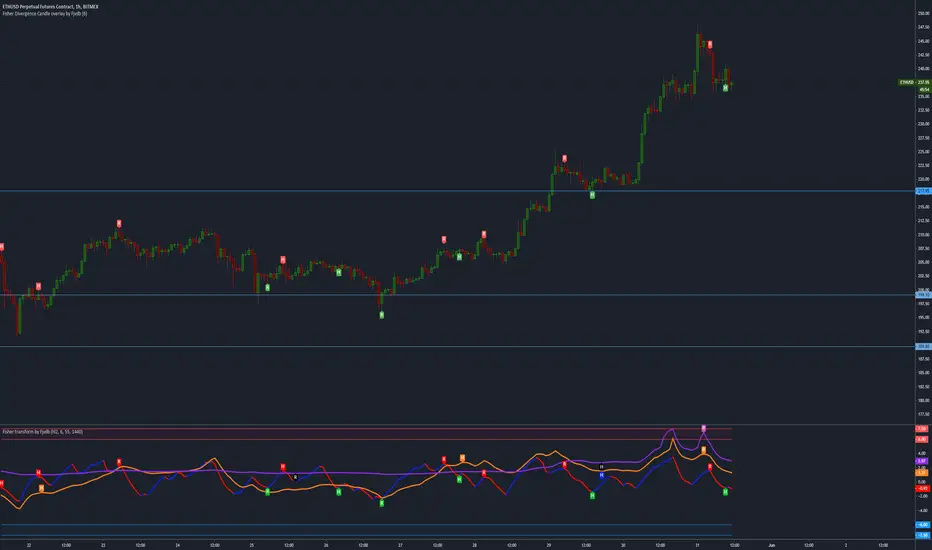
Fisher Divergence Candle OverlayOverlays Ehler's Fisher oscillator divergences on candles, handy for saving space on charts.
Fisher Transform Divergence PointerThis script points regular and optionally hidden types of bullish and bearish Fisher Transform divergences on the chart by drawing the divergence lines and optionally labels.
Hidden divergence is disabled by default, it can be enabled over settings window.
Regular divergence is enabled by default, it can be disabled over settings window.
There is an option to display the price channel additionally.
Added alerts for all types of divergences.

Fisher Transform DivergenceEhler's Fisher transform with instant confirmation divergences.
Scheduled update is adding hidden divergences, currently under construction

PriceDivergence (ps4)This script implements price divergence module using signals from several factors like:
RSI, RSI Stochastic, MACD, Volume MA, Accumulation/Distribution, Fisher Transform and CCI

Simple 𝔇 Oscillators𝔻𝕚𝕧𝕖𝕣𝕘𝕚𝕟𝕘 𝕆𝕤𝕔𝕚𝕝𝕝𝕒𝕥𝕠𝕣𝕤
No Offset's, No delay
There is 6 Oscillators diverging in release version
For micro tf charting -requires manual tune on input menu

Fisher Least Squares Moving AverageIntroduction
I already estimated the least-squares moving average numerous times, one of the most elegant ways was by rescaling a linear function to the price by using the z-score, today i will propose a new smoother (FLSMA) based on the line rescaling approach and the inverse fisher transform of a scaled moving average error with the goal to provide an alternative least-squares smoother, the indicator won't use the correlation coefficient and will try to adresses problems such as overshoots and lag reduction.
Line Rescaling Method
For those who did not see my least squares moving average estimation using the line rescaling method here is a resume, we want to fit a polynomial function of degree 1 to the price by reducing the sum of squares between the price and the filter, squares is a term meaning the squared difference between the price and its estimation. The line rescaling technique work as follow :
1 - get the z-score of a line.
2 - multiply this z-score with the correlation between the price and a line.
3 - multiply the precedent result with the standard deviation of the price, then sum that to a simple moving average.
This process is shorter than the classical least-squares moving average method.
Z-Score Derivation And The Inverse Fisher Transform
The FLSMA will use a similar approach to the line rescaling technique but instead of using the correlation during step 2 we will use an alternative calculated from the error between the estimate and the price.
In order to do so we must use the inverse fisher transform, the inverse fisher transform can take a z-score and scale it in a range of (1,-1), it is possible to estimate the correlation with it. First lets create our modified z-score in the form of : Z = ma((y - Y)/e) where y is the price, Y our output estimate and e the moving average absolute error between the price and Y and lets call it scaled smoothed error , then apply the inverse fisher transform : r = IFT(Z) = tanh(Z) , we then multiply the z-score of the line with it.
Performance
The FLSMA greatly reduce the overshoots, this mean that the maximas of abs(r) are lower than the maxima's of the absolute correlation, such case is not "bad" but we can see that the filter is not closer to the price than the LSMA during trending periods, we can assume the filter don't reduce least-squares as well as the LSMA.
The image above is the running mean of the absolute error of each the FLSMA (in red) and the LSMA (in blue), we could fix this problem by multiplying the smooth scaled error by p where p can be any number, for example :
z = sma(src - nz(b ,src),length)/e * p where p = 2
In red the FLSMA and in blue the FLSMA with p = 2 , the greater p is the less lag the FLSMA will have.
Conclusion
It could be possible to get better results than the LSMA with such design, the presented indicator use its own correlation replacement but it is possible to use anything in a range of (1,-1) to multiply the line z-score. Although the proposed filter only reduce overshoots without keeping the accuracy of the LSMA i believe the code can be useful for others.
Thanks for reading.

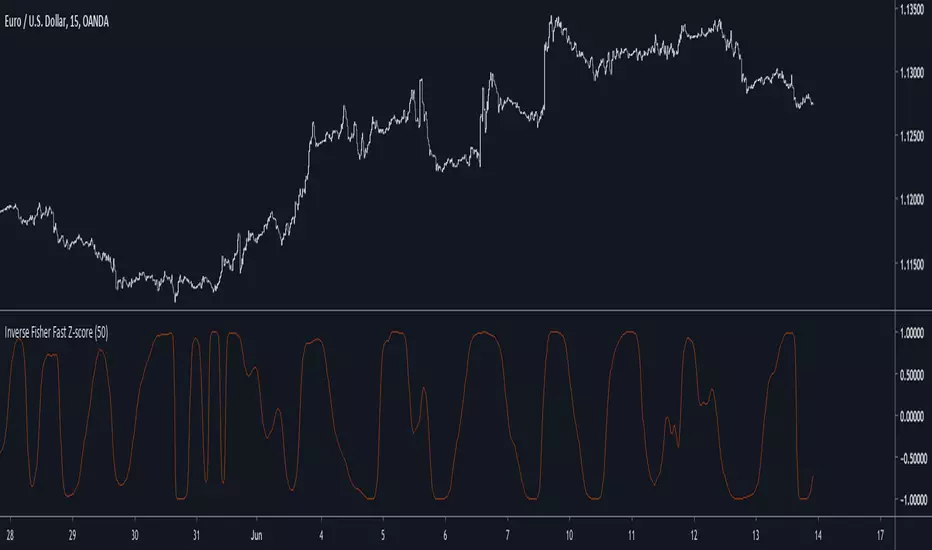
Inverse Fisher Fast Z-scoreIntroduction
The fast z-score is a modification of the classic z-score that allow for smoother and faster results by using two least squares moving averages, however oscillators of this kind can be hard to read and modifying its shape to allow a better interpretation can be an interesting thing to do.
The Indicator
I already talked about the fisher transform, this statistical transform is originally applied to the correlation coefficient, the normal transform allow to get a result similar to a smooth z-score if applied to the correlation coefficient, the inverse transform allow to take the z-score and rescale it in a range of (1,-1), therefore the inverse fisher transform of the fast z-score can rescale it in a range of (1,-1).
inverse = (exp(k*fz) - 1)/(exp(k*fz) + 1)
Here k will control the squareness of the output, an higher k will return heavy side step shapes while a lower k will preserve the smoothness of the output.
Conclusion
The fisher transform sure is useful to kinda filter visual information, it also allow to draw levels since the rescaling is in a specific range, i encourage you to use it.
Notes
During those almost 2 weeks i was even lazier and sadder than ever before, so i think its no use to leave, i also have papers to publish and i need tv for that.
Thanks for reading !