Fixed-Range Volume-Profile ZonesFixed Range Volume Profile Zones (with Dynamic Percentile Buffers)
This indicator calculates a fixed‑range volume profile over a user‑defined lookback period and identifies three key zones:
– VAL (Value Area Low)
– POC (Point of Control)
– VAH (Value Area High)
Volume is grouped into user‑selected price bins to create a profile of where the most trading activity occurred.
The script then splits the distribution into three zones and highlights the extremes (VAL/VAH) and the highest‑volume price (POC).
Dynamic Percentile Buffers
Instead of static offsets, this version computes the 10th and 90th percentile prices (user‑adjustable) of recent closes over the same lookback window.
These percentiles are used to create adaptive buffers above VAH and below VAL.
The buffers automatically expand or contract with market volatility and recent price distribution, filtering out weak or noisy touches.
Visual Elements:
– Green/orange/red horizontal lines = VAL / VAH / POC
– Green shading below VAL = buy zone
– Red shading above VAH = sell zone
– Down arrows above bars = closes above VAH + buffer
– Up arrows below bars = closes below VAL – buffer
Inputs:
– Lookback Days: number of bars used to build the profile
– Number of Bins: controls resolution of the volume profile
– VAH Percentile and VAL Percentile: choose which percentile levels to use for dynamic buffers
Use Cases:
– Quickly identify areas of high participation (POC) and potential support/resistance (VAL/VAH)
– Filter out weak breakouts using dynamic buffers
– Combine with other signals to improve entries/exits
⚠️ Disclaimer:
This script is for educational and informational purposes only.
It does not constitute financial advice or a recommendation to buy or sell any security.
Past performance or historical data does not guarantee future results.
Always perform your own analysis and use risk management when trading.
Fixedrange

Bar Magnified Volume Profile/Fixed Range [ChartPrime]This indicator draws a volume profile by utilizing data from the lower timeframe to get a more accurate representation of where volume occurred on a bar to bar basis. The indicator creates a price range, and then splits that price range into 100 grids by default. The indicator then drops down to the lower timeframe, approximately 16 times lower than the current timeframe being viewed on the chart, and then parses through all of the lower timeframe bars, and attributes the lower timeframe bar volume to all grids that it is touching. The volume is dispersed proportionally to the grids which it is touching by whatever percent of the candle is inside each grid. For example, if one of the lower timeframe bars is interacting with "2" of the grids in the profile, and 60% of the candle is inside of the top grid, 60% of the volume from said candle will be attributed to the grid.
To make all of this magic happen, this script utilizes a quadratic time complexity algorithm while parsing and attributing the volume to all of the grids. Due to this type of algorithm being used in the script, many of the user inputs have been limited to allow for simplicity, but also to prevent possible errors when executing loops. For the most part, all of the settings have been thoroughly tested and configured with the right amount of limitations to prevent these errors, but also still give the user a broad range of flexibility to adjust the script to their liking.
📗 SETTINGS
Lookback Period: The lookback period determines how many bars back the script will search for the "highest high" and the "lowest low" which will then be used to generate the grids in-between
Number Of Levels: This setting determines how many grids there will be within the volume profile/fixed range. This is personal preference, however it is capped at 100 to prevent time complexity issues
Profile Length: This setting allows you to stretch or thin the volume profile. A higher number will stretch it more, vise versa a smaller number will thin it further. This does not change the volume profiles results or values, only its visual appearance.
Profile Offset: This setting allows you to offset the profile to the left or right, in the event the user does not appreciate the positioning of the default location of the profile. A higher number will shift it to the right, vise versa a lower number will shift it to the left. This is personal preference and does not affect the results or values of the profile.
🧰 UTILITY
The volume profile/fixed range can be used in many ways. One of the most popular methods is to identify high volume areas on the chart to be used as trade entries or exits in the event of the price revisiting the high volume areas. Take this picture as an example. The image clearly demonstrates how the 2 highest areas of volume within this magnified volume profile also line up to great areas of support and resistance in the market.
Here are some other useful methods of using the volume profile/fixed range
Identify Key Support and Resistance Levels for Setups
Determine Logical Take Profits and Stop Losses
Calculate Initial R Multiplier
Identify Balanced vs Imbalanced Markets
Determine Strength of Trends

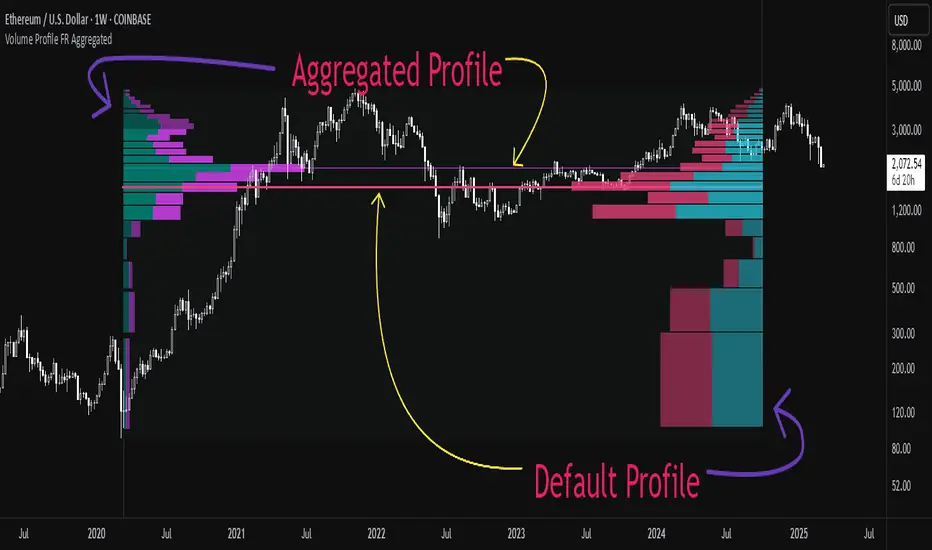
Aggregated Volume Profile Spot & Futures ⚉ OVERVIEW ⚉
Aggregate Volume Profile - Shows the Volume Profile from 9 exchanges. Works on almost all CRYPTO Tickers!
You can enter your own desired exchanges, on/off any others, as well as select the sources of SPOT, FUTURES and others.
The script also includes several input parameters that allow the user to control which exchanges and currencies are included in the aggregated data.
The user can also choose how volume is displayed (in assets, U.S. dollars or euros) and how it is calculated (sum, average, median, or dispersion).
WARNING Indicator is for CRYPTO ONLY.
______________________
⚉ SETTINGS ⚉
‾‾‾‾‾‾‾‾‾‾‾‾‾‾‾‾‾‾‾‾‾‾
Data Type — Choose Single or Aggregated data.
• Single — Show only current Volume.
• Aggregated — Show Aggregated Volume.
Volume By — You can also select how the volume is displayed.
• COIN — Volume in Actives.
• USD — Volume in United Stated Dollar.
• EUR — Volume in European Union.
• RUB — Volume in Russian Ruble.
Calculate By — Choose how Aggregated Volume it is calculated.
• SUM — This displays the total volume from all sources.
• AVG — This displays the average price of the volume from all sources.
• MEDIAN — This displays the median volume from all sources.
• VARIANCE — This displays the variance of the volume from all sources.
• Delta Type — Select the Volume Profile type.
• Bullish — Shows the volume of buyers.
• Bearish — Shows the volume of sellers.
• Both — Shows the total volume of buyers and sellers.
Additional features
The remaining functions are responsible for the visual part of the Volume Profile and are intuitive and I recommend that you familiarize yourself with them simply by using them.
________________
⚉ NOTES ⚉
‾‾‾‾‾‾‾‾‾‾‾‾‾‾‾‾
If you have any ideas what to add to my work to add more sources or make calculations cooler, suggest in DM .
Also I recommend exploring and trying out my similar work.
PriceScalperThis is a simple script that will visually show where buy and sell points occur based upon configurable price action. I wrote this purposefully to evaluate stablecoins and other narrow or fixed ranged markets where algorythms don't generally do well.
Putple triangles, pointing up, are buy signals.
Purple triangles, pointing down are sell signals
Alert conditions of BUY ASSET and SELL ASSET are provided for convience.
