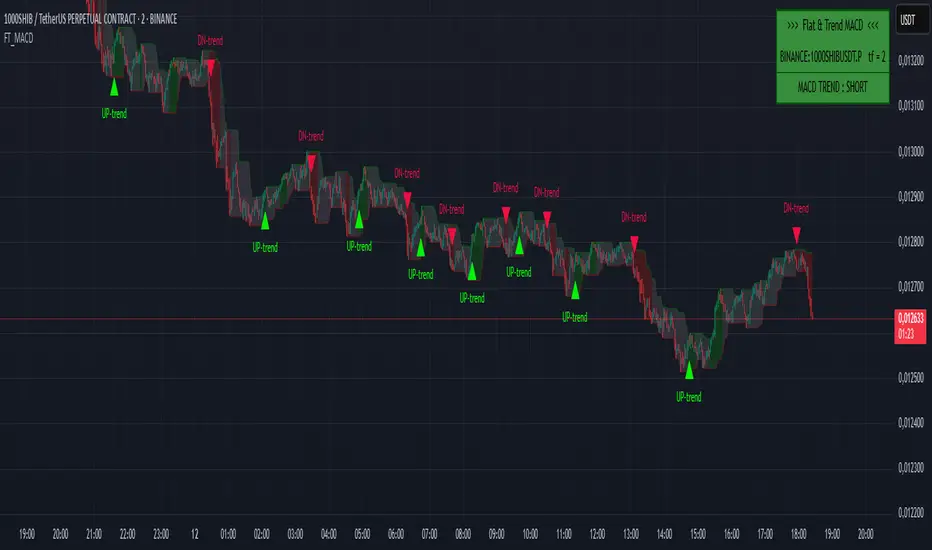
Flat & Trend MACD💡 The MACD indicator with trend interpretation and flat zones on top of the chart!
👉 This indicator clearly shows the zones of predominance of buyers, sellers, as well as zones of uncertainty (flat).
Suitable for any instrument and timeframe!
The MACD settings are standard.
The setup menu sets the length of Fast, Slow and smoothing for calculating the MACD oscillator.
🔹The indicator tracks the value of the MACD relative to zero, taking into account the uncertainty zone, which is calculated at 50% of the average value of the deviation of the MACD for a short period. This avoids most false buy and sell signals.
🔹When the MACD value is positive and goes beyond uncertainty, a buy signal appears (green triangle on the chart), when the MACD value is negative and goes beyond uncertainty, a sell signal appears (red triangle on the chart). The built-in alert gives a signal of a trend change.
Also, the trend direction is highlighted by the background color of the price channel on the chart.
🔹If the MACD value is in the zone of uncertainty of the buyer and seller, the background turns gray and an orange square appears on the chart. The built-in alert gives a signal about the beginning of the flat zone.
A scoreboard is displayed in the upper right corner, which shows the current status of the indicator and a warning about the presence of a flat.
The flat display can be disabled in the indicator settings.
The colors can be changed in the Style menu.
👉 I wish everyone a profit and be sure to follow risk management in trading!
For any questions, you can write to me in private messages or by the contacts in my signature.
===============================================
💡 Индикатор MACD с интерпретацией тренда и флэтовых зон поверх графика!
👉 Данный индикатор наглядно показывает зоны преобладания покупателей, продавцов, а также зоны неопределенности (флэт).
Подходит для любого инструмента и таймфрейма!
Параметры настройки MACD - стандартные.
В меню настройки задается длина Fast, Slow и сглаживание для расчета MACD-осциллятора.
🔹Индикатор отслеживает значение MACD относительно нуля с учётом зон неопределённости, которая расчитывается в 50% среднего значения отклонения MACD за небольшой период. Это позволяет избежать большинства ложных сигналов на покупку и продажу.
🔹Когда значение MACD является положительным и выходит за пределы неопределённости - появляется сигнал на покупку (зеленый треугольник на графике), когда значение MACD является отрицательным и выходит за пределы неопределённости - появляется сигнал на продажу (красный треугольник на графике). Встроенное оповещение дает сигнал о смене тренда.
Также направление тренда подсвечивается окраской фона ценового канала на графике.
🔹Если значение MACD находится в зоне неопределённости покупателя и продавца - фон окрашивается в серый цвет и на графике появляется оранжевый квадрат. Встроенное оповещение дает сигнал о начале зоны флэта.
В правом верхнем углу высвечивается табло, которое показывает текущий статус индикатора и предупреждение о наличии флэта.
Отображение флэта можно отключить в настройках индикатора.
Цвета можно изменить в меню "Стиль".
👉 Желаю всем профита и обязательно соблюдайте риск-менеджмент в торговле!
По любым вопросам Вы можете написать мне в личные сообщения или по контактам в моей подписи.
FLAT
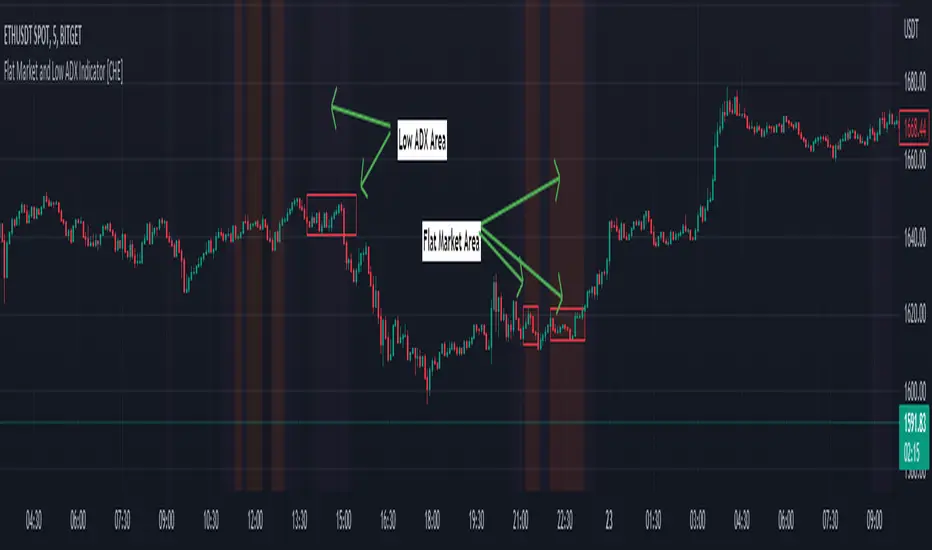
Flat Market and Low ADX Indicator [CHE]Why use the Flat Market and Low ADX Indicator ?
Flat markets, where prices remain within a narrow range for an extended period, can be both critical and dangerous for traders. In a flat market, the price action becomes less predictable, and traders may struggle to find profitable trading opportunities. As a result, many traders may decide to take a break from the market until a clear trend emerges.
However, flat markets can also be dangerous for traders who continue to trade despite the lack of clear trends. In the absence of a clear direction, traders may be tempted to take larger risks or make impulsive trades in an attempt to capture small profits. Such behavior can quickly lead to significant losses, especially if the market suddenly breaks out of its flat range, causing traders to experience large drawdowns.
Therefore, it is essential to approach flat markets with caution and to have a clear trading plan that incorporates strategies for both trending and flat markets. Traders may also use technical indicators, such as the Flat Market and Low ADX Indicator, to help identify flat markets and determine when it is appropriate to enter or exit a position.
The confluence between flat markets and low ADX readings can further increase the risk of trading during these periods. The ADX (Average Directional Index) is a technical indicator used to measure the strength of a trend. A low ADX reading indicates that the market is in a consolidation phase, which can coincide with a flat market. When a flat market occurs during a period of low ADX, traders should be even more cautious, as there is little to no directional bias in the market. In this situation, traders may want to consider waiting for a clear trend to emerge or using range-bound trading strategies to avoid taking excessive risks.
Introduction:
Pine Script is a programming language used for developing custom technical analysis indicators and trading strategies in TradingView. This particular script is an indicator designed to identify flat markets and low ADX conditions. In this description, we will delve deeper into the functionality of this script and how it can be used to improve trading decisions.
Description:
The first input in the script is the length of the moving average used for calculating the center line. This moving average is used to define the high and low range of the market. The script then calculates the middle value of the range by taking the double exponential moving average (EMA) of the high, low, and close prices.
The script then determines whether the market is flat by comparing the middle value of the range with the high and low values. If the middle value is greater than the high value or less than the low value, the market is not flat. If the middle value is within the high and low range, the script considers the market to be flat. The script also uses RSI filter settings to further confirm if the market is flat or not. If the RSI value is between the RSI min and max values, then the market is considered flat. If the RSI value is outside this range, the market is not considered flat.
The script also calculates the ADX (Average Directional Index) to determine whether it's in a low area. ADX is a technical indicator used to measure the strength of a trend. The script uses the ADX filter settings to define the ADX threshold value. If the ADX value is below the threshold value, the script considers the market to be in a low ADX area.
The script provides various input options to customize the display settings, including the option to show the flat market and low ADX areas. Users can choose their preferred colors for the flat market and low ADX areas and adjust the transparency levels to suit their needs.
Conclusion:
In conclusion, this Pine Script indicator is designed to identify flat market and low ADX conditions, which can help traders make informed trading decisions. The script uses a range of inputs and calculations to determine the market direction, RSI filter, and ADX filter. By customizing the display settings, users can adjust the indicator to suit their preferences and improve their trading strategies. Overall, this script can be a valuable tool for traders looking to gain an edge in the markets.
Acknowledgments:
Thanks to the Pine Script™ v5 User Manual www.tradingview.com
Flat Detect By Bollinger BandsThis simple script indicate the potential flat market zones, calculated based on the Bollinger Bands width.
It's showing the Bollinger Bands in red when the market is detected as flat.
You can adjust the Width Threshold with precision on the inputs settings.
Enjoy :)

Chop & Trend===========
Chop & Trend
===========
A handy little indicator illustrating not only areas of Chop or "flat" market conditions, but also to indicate the start of a new trend and the new trend's direction.
-----------
Using just a few algorithms to indicate the aforementioned (RSI, Jurik Moving Average and Angle of MA) we've tried to keep it simple as we believe adding too many variables can only degrade a good indicator, and not enhance it, as many would lead you to believe.
There's a few settings to play with regarding Relative Strength, Jurik MA and the ability to set an angle to determine when chop/trend starts or ends.
Good Luck and Happy Trading!
-theCrypster
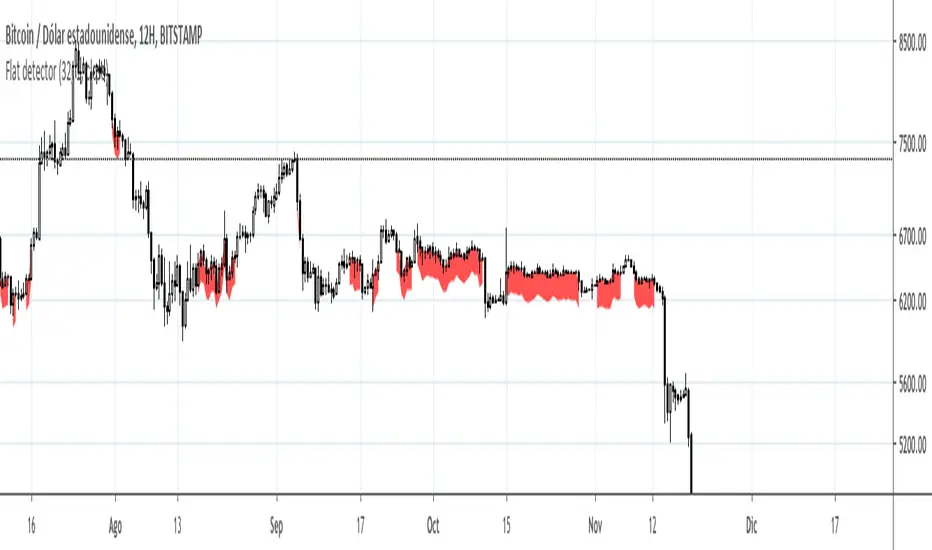
FLAT MARKET DETECTOR Paint in red when we are in a flat market
Generally after flat markets we find volatility
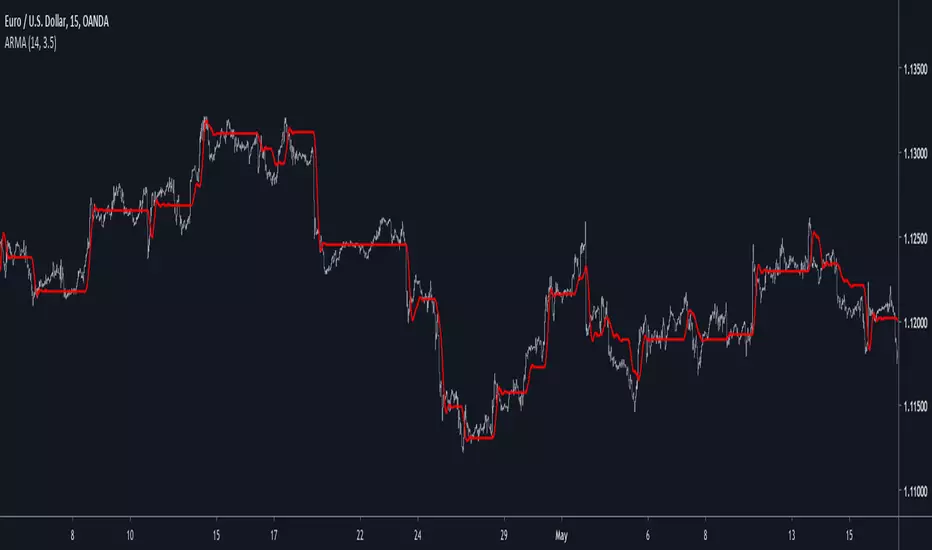
Autonomous Recursive Moving AverageIntroduction
People often ask me what is my best indicators, i can't really respond to this question with a straight answer but i would say you to check this indicator. The Autonomous Recursive Moving Average (ARMA) is an adaptive moving average that try to minimize the sum of squares thanks to a ternary operator, this choice can seem surprising since most of the adaptive moving averages adapt to a smoothing variable thanks to exponential averaging, but there are lot of downsides to this method, i really wanted to have a flat filter during flat markets and this is what i achieved.
The Indicator
length control the amount of smoothing during trending periods, gamma is the trend sensitivity threshold, higher values of gamma will make an overall flat filter, adjust gamma to skip ranging markets.
gamma = 2, we can adjust to 3 while preserving smoothing reactivity with trading periods.
gamma = 3
low length and higher gamma create more boxy result, the filter add overshoots directly in the output, its unfortunate.
The Zero-Lag option can reduce the lag as well as getting additional flat results without changing gamma.
Conclusion
The indicator need work, but i can't leave without publishing it, the overshoots are a big problems, changing sma for another stable filter can help. I hope you find an use to it, i really like this indicator.
Thanks for reading
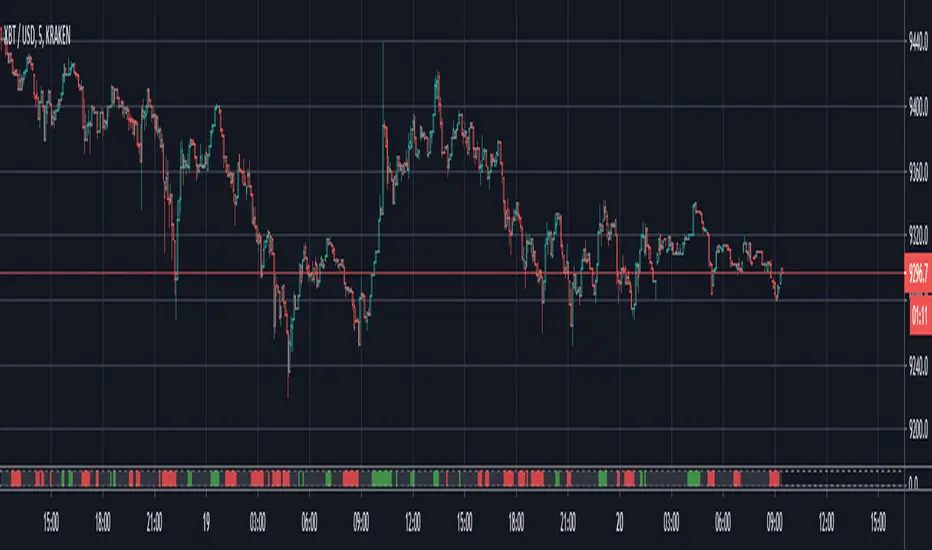
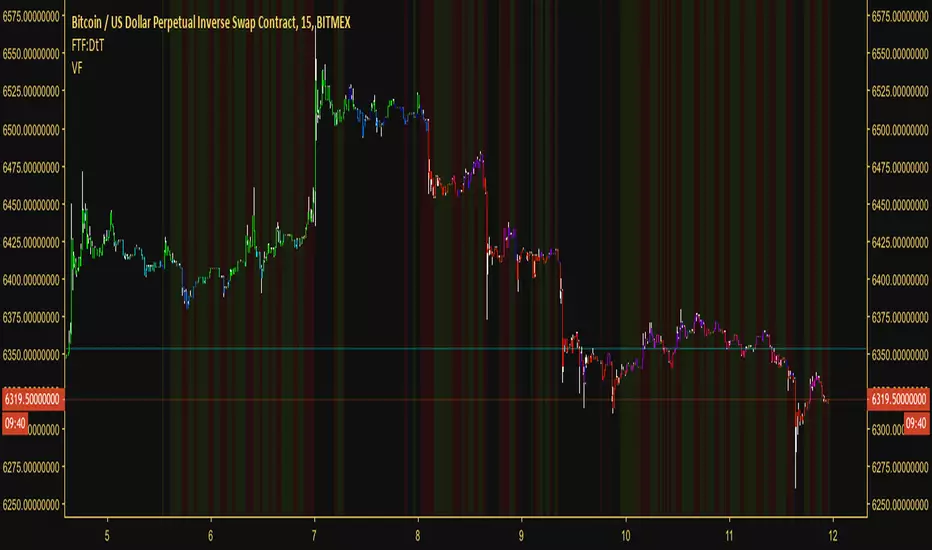
Volatility FilterOver the past few weeks (as of today, which is: 12th of October 2018) there has been little to no volatility in most of the major cryptocurrencies. What volatility does come in comes and goes very quickly. It's difficult to discern good and bad moments to be in a trade. As a result I decided to create a volatility filter based on Hurst exponent market phases, Bollinger Band width, moving averages, volume and the average true range. The results are the above.
You can use this indicator against any asset or within any market. It actually reaps excellent results against the DJI and XAUUSD One of my suggested uses for it is if you're scalping, only enter a position when there is volatility (when there's no background color present). If you're swinging, only enter a position when there's low volatility (when the red background color is present).
Another way to use it (although this isn't intended, just incidental) is to take a position in the direction of the first bar after the red background has gone/after low volatility has passed. So if we get a declining candle when we exit a low volatility zone, short. Otherwise long. This is the experimental side of it though.
However, this indicator won't tell you what direction to trade in, so in order to get use from it I suggest having a trend filter and a trigger. Luckily these two things are in most traders' arsenal. If not, take a look at my other script which is a timelessly brilliant trigger for buying and selling:
Something else to consider is that the volatility is relative. If we go through a period of incredibly high volatility then afterwards we can sometimes expect the volatility filter to plot a red background even though there is still acceptable volatility left in the market. The volatility at that point is much less than the volatility beforehand.
With all that said, this easy-to-read tool will help you avoid flat periods when scalping and, conversely, help you determine good times to enter a swing trade. For those who had difficulty trading the markets as of late due to volatility, this indicator is perfect for you
Access to the filter is provided for 10$, payable in most low-transaction-fee cryptocurrencies. Access is limited to 250 customers. For more information message me through TradingView or message @overttherainbow through Telegram.
Have a nice day and good luck trading.
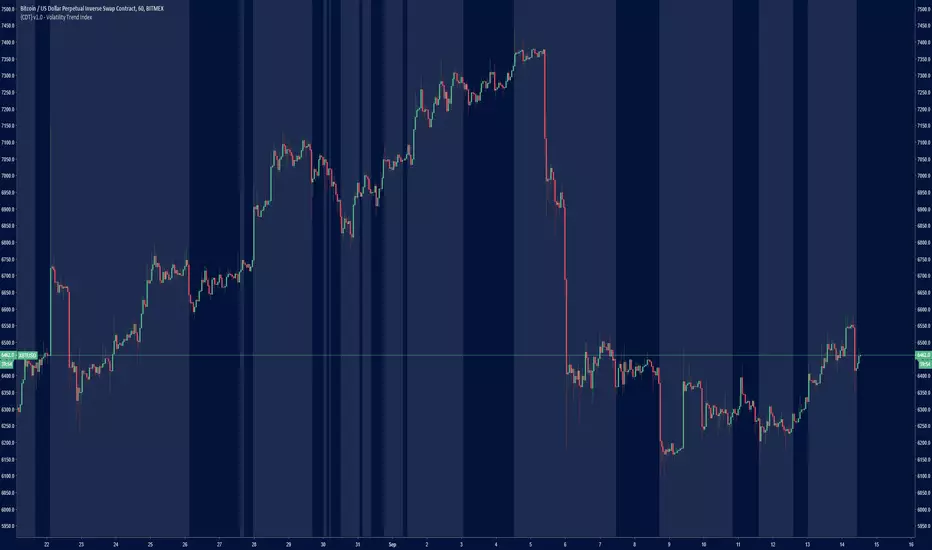
{CDT} v1.0 - Volatility Trend IndexHighlights areas where there is an increase in volatility and trend.
Does not determine direction, just good times to trade.
Flat Market Filters4 separate indicators in one to identify flat/ranging market conditions, with the intention of filtering out MA crosses during periods of flatness (or targetting ranging conditions for mean reversion strats)
Options to use any combination of the 4 indicators (AND/OR settings for each indicator combination) and separate config options for each indicator.
Updates to come. Message for access.
