VEP - Volume Explosion Predictor💥 VEP - Volume Explosion Predictor
General Overview
The Volume Explosion Predictor (VEP) is an advanced indicator that analyzes volume peaks to predict when the next volume explosion might occur. Using statistical analysis on historical patterns, it provides accurate probabilities on moments of greater trading activity.
MAIN FEATURES
🎯 Intelligent volume peak detection
Automatically identifies significant volume peaks
Anti-consecutive filter to avoid redundant signals
Customizable threshold for detection sensitivity
📊 Advanced statistical analysis
Calculates the average distance between volume peaks
Monitors the number of sessions without peaks
Tracks the maximum historical range without activity
🔮 Predictive system
Dynamic probability: Calculates the probability of an imminent peak
Visual indicators: Background colors that change based on probability
Time forecasts: Estimates remaining sessions to the next peak
📈 Visual signals
Colored arrows: Green for bullish peaks, red for bearish peaks
Statistics table: Complete real-time overview
ALERT SYSTEM
🚨 Three Alert Levels
New Valid Volume Peak: New peak detected
Approaching Prediction: Increasing probability
High Peak Probability: High probability of explosion
HOW TO USE IT
📋 Recommended setup
Timeframe : Works on all timeframes but daily, weekly or monthly timeframe usage is recommended. In any case, it should always be used consistently with your time horizon
Markets : Stocks, crypto, forex, commodities
Threshold for volume peak realization : It's recommended to start with 2.0x (i.e., twice the volume average) for normal markets, 1.5x for more volatile markets. This parameter can be set in the settings as desired
🎨 Visual interpretation
Green Arrows : Peak during bullish candle
Red Arrows : Peak during bearish candle
Red Background : High probability (>90%) of new peak
Yellow Background : Medium probability (50-70%)
📊 STATISTICS TABLE
The table shows:
Total peaks analyzed
Average distance between peaks
Current sessions without peaks
Forecast remaining sessions
Percentage probability
Volume threshold needed for peak realization
STRATEGIC ADVANTAGES
🎯 For Day Traders
Anticipates moments of greater volatility for analysis, supporting the evaluation of trading setups and providing context on low volume periods
📈 For Swing Traders
Identifies high-probability volume patterns, supporting breakout analysis with volume and improving understanding of market timing
🔍 For Technical Analysts
Understands the stock's volume patterns.
Helps evaluate the historical market interest and supports quantitative research and analysis
OTHER THINGS TO KNOW...
A) Anti-Consecutive Algorithm : allows to avoid multiple and consecutive volume signals and peaks at close range
B) Statistical Validation : Uses standard deviation for accuracy
C) Memory Management : Limits historical data for optimal performance
D) Compatibility : Works with all TradingView chart types
⚠️ IMPORTANT DISCLAIMER
This indicator is exclusively a technical analysis tool for studying volume patterns. It does not provide investment advice, trading signals or entry/exit points. All trading decisions are at the complete discretion and responsibility of the user. Always use in combination with other technical and fundamental analysis and proper risk management.
DESCRIZIONE IN ITALIANO
💥 VEP - Volume Explosion Predictor
Panoramica Generale
Il Volume Explosion Predictor (VEP) è un indicatore avanzato che analizza i picchi di volume per prevedere quando potrebbe verificarsi la prossima esplosione di volume. Utilizzando analisi statistiche sui pattern storici, fornisce probabilità accurate sui momenti di maggiore attività di trading.
CARATTERISTICHE PRINCIPALI
🎯 Rilevamento intelligente dei picchi di volume
- Identifica automaticamente i picchi di volume significativi
- Filtro anti-consecutivo per evitare segnali ridondanti
- Soglia personalizzabile per la sensibilità del rilevamento
📊 Analisi statistica avanzata
Calcola la distanza media tra i picchi di volume
Monitora il numero di sessioni senza picchi
Traccia il range massimo storico senza attività
🔮 Sistema predittivo
Probabilità dinamica: Calcola la probabilità di un imminente picco
Indicatori visivi: Colori di sfondo che cambiano in base alla probabilità
Previsioni temporali: Stima delle sessioni rimanenti al prossimo picco
📈 Segnali visivi
1) Frecce colorate: Verdi per picchi rialzisti, rosse per ribassisti
2) Tabella statistiche: Panoramica completa in tempo reale
SISTEMA DI ALERT
🚨 Tre Livelli di Alert
1) New Valid Volume Peak: Nuovo picco rilevato
2) Approaching Prediction: Probabilità in aumento
3) High Peak Probability: Alta probabilità di esplosione
COME UTILIZZARLO
📋 Setup consigliato
- Timeframe : Funziona su tutti i timeframe ma è consigliabile un utilizzo su timeframe giornaliero, settimanale o mensile. In ogni caso va sempre utilizzato coerentemente con il proprio orizzonte temporale
- Mercati : Azioni, crypto, forex, commodities
- Limite affinché si realizzi il picco di volumi : Si consiglia di iniziare con 2.0x (ovvero due volte la media dei volumi) per mercati normali, 1.5x per mercati più volatili. Questo parametro può essere settato nelle impostazioni a proprio piacimento
🎨 Interpretazione visuale
Frecce Verdi : Picco durante candela rialzista
Frecce Rosse : Picco durante candela ribassista
Sfondo Rosso : Alta probabilità (>90%) di nuovo picco
Sfondo Giallo : Probabilità media (50-70%)
📊 TABELLA STATISTICHE
La tabella mostra:
1. Totale picchi analizzati
2. Distanza media tra picchi
3. Sessioni attuali senza picchi
4. Previsione sessioni rimanenti
5. Probabilità percentuale
6. Soglia volume necessaria affinché si realizzi il picco di volumi
VANTAGGI STRATEGICI
🎯 Per Day Traders
Anticipa i momenti di maggiore volatilità per analisi, supportando la valutazione dei setup di trading e fornendo al contempo un contesto sui periodi di basso volume
📈 Per Swing Traders
1. Identifica pattern di volume ad alta probabilità, supportando l'analisi dei breakout con volume e migliorando la comprensione dei tempi di mercato
🔍 Per Analisti Tecnici
Comprende i pattern di volume del titolo.
Aiuta a fare una valutazione dell'interesse storico del mercato ed è di supporto alla ricerca e analisi quantitativa
ALTRE COSE DA SAPERE...
A) Algoritmo Anti-Consecutivo : permette di evitare segnali e picchi di volume multipli e consecutivi multipli a distanza ravvicinata
B) Validazione Statistica : Utilizza deviazione standard per l'accuratezza
C) Gestione Memoria : Limita i dati storici per performance ottimali
D) Compatibilità : Funziona con tutti i tipi di grafico TradingView
⚠️ DISCLAIMER IMPORTANTE
Questo indicatore è esclusivamente uno strumento di analisi tecnica per lo studio dei pattern di volume. Non fornisce consigli di investimento, segnali di trading o punti di ingresso/uscita. Tutte le decisioni di trading sono a completa discrezione e responsabilità dell'utente. Utilizzare sempre in combinazione con altre analisi tecniche, fondamentali e una adeguata gestione del rischio.
Fomo

FOMO Indicator - % of Stocks Above 5-Day AvgThe FOMO Indicator plots the breadth indicators NCFD and S5FD below the price chart, representing the percentage of stocks in the Nasdaq Composite (NCFD) or S&P 500 (S5FD) trading above their respective 5-day moving averages.
This indicator identifies short-term market sentiment and investor positioning. When over 85% of stocks exceed their 5-day averages, it signals widespread buying pressure and potential FOMO (Fear Of Missing Out) among investors. Conversely, levels below 15% may indicate oversold conditions. By analyzing these breadth metrics over a short time window, the FOMO Indicator helps traders gauge shifts in investor sentiment and positioning.

FOMO Alert (Miu)This indicator won't plot anything to the chart.
Please follow steps below to set your alarms based on price range variation:
1) Add indicator to the chart
2) Go to settings
3) Choose timeframe which will be used to calculate bars
4) Choose how many bars which will be used to calculate max and min range
5) Choose max and min range variation (%) to trigger alerts
5) Choose up to 6 different symbols to get alert notification
6) Once all is set go back to the chart and click on 3 dots to set alert in this indicator, rename your alert and confirm
7) You can remove indicator after alert is set and it'll keep working as expected
What does this indicator do?
This indicator will generate alerts based on following conditions:
- If min and max prices reach the range (%) from amount of bars on timeframe set for any symbol checked it will trigger an alert.
- If next set of bars reaches higher range than before it will trigger an alert with new data
- If next set of bars doesn't reach higher range than before it will not trigger alerts, even if they are above the range set (this is to prevent the alert to keep triggering with high frequency)
Once condition is met it will send an alert with the following information:
- Symbol name (e.g: BTC, ETH, LTC)
- Range achieved (e.g: 3,03%)
- Current symbol price and current bar direction (e.g: 63,477.1 ▲)
This script will request lowest and highest prices through request.security() built-in function from all different symbols within the range set. It also requests symbols' price (close) and amount of digits (mintick) for each symbol to send alerts with correct value.
This script was developed with main purpose to send alerts when there are strong price movements and I decided to share with community so anyone can set different parameters for different purposes.
Feel free to give feedbacks on comments section below.
Enjoy!

Market Condition DetectorThis script allows to change the background color of the main chart to green or red depending on the following factors:
Based on the QQQ graph whatever ticker you are watching
- Price > EMA20 Da
- Net New Highs > 0
- 10EMA Da > 20 EMA Da
When you are trading Break-Out, EP or other similar trades you will need the market at your back to improve both the winrate and the risk reward ratio.
This is a very useful tool if you struggle with the FOMO biais. It will help you detect the trend at a glance.
Remember that the top best trader are waiting for their trade to work and only after getting some traction, and only then will they take the next trade.
I also proceeded to find a formula that make the indicator be the smoother possible with the less possible amount of noise.
/!\ This indicator is intended for use on daily charts . /!\

Fear Of Missing Out grid of forex tradingAbstract
This script finds potential safe grids placing limit orders without fear of missing out.
This script computes grids according to power of 1.0025 .
You can reference those price levels for your trading.
Introduction
Grid trading is a popular trading method.
Traders plan several price levels as grids and repeat buying at lower grids and selling at higher grids.
Grids can be round number like multiple of 100 pips.
Grids can also be support and resistance according to price history.
Some traders may think they need to adjust grids to trade.
However, there are several problems in choosing grids.
One problem is rate of change is related and therefore exponential. 20 to 30 is different from 30 to 40.
Another interesting point is there are some special impressing reversal price levels.
Several months ago, I had a question why usdjpy bounced near 108.3 .
After using a calculator, I found that 108.3 = 100 * 1.083 ≒ 100 * pow(1.0025,31) .
1.0025 , as known as 0.25% of change, is a potential stop out zone.
Therefore, we can compute grids and one grid is a little more than 1.0025 times than an another one.
After we finished computing grids, we can consider buy and sell near those grids.
Note that different traders may obtain different grid values.
For example, from 1.0 to 2.0 , it can be splited as 270 grids or 277 grids because pow(1.0025,277)<2 .
Those grids cannot always imply potential reversal points but they can be useful for traders looking for 0.25% profit targets with reducing fearing of buying or selling too early.
Computing grids
This script split from 1.0 to 10.0 into three segments.
One is 1.0 to 2.0 .
The second segment is from 2.0 to 5.0 .
The third segment is from 5.0 to 10.0 .
This script does the same thing for 0.1 to 1.0 , 10.0 to 100.0 , and so on.
For 1.0 to 2.0 and 5.0 to 10.0 , this script split a segment as 270 grids.
For 2.0 to 5.0 , this script split a segment as 360 grids.
The last step is display the next grids to the daily low and daily high.
Maybe also display the grids behind grids shown.
Parameters
x1,x2,x3,x4 : display the next x1,x2,x3,x4 grids to daily high and daily low. 1 means the next grid to daily high and daily low. 2 means the next grid to 1.
x_seg : default 2.0 . This script split from 1.0 to 10.0 into three segments. One is 1.0 to x_seg. The second segment is from x_seg to 10.0/x_seg . The third segment is from 10.0/x_seg to 10.0 .
x_grid1 : how many grids in the first segment
x_grid2 : how many grids in the second segment
x_lowprice : add this number for bigger grid distance. Generally, you don't need this number when trading forex but you may need it in stock trading. For stocks with price between 50 to 100, I recommend you use x_lowprice=100.
Conclusion and suggestions
This script can find potential grids for trading.
If price touches grids usually, we can consider buy and sell after price touches grids.
If price reverses before touching grids usually, we may consider buy and sell before price touches grids.
Those grids can remind us don't buy too much unless the price touches the next grid.
For instruments with less volatility, maybe we need more grids.
For traders with more money, they may also consider more grids for more dedicated range trading to collect more profit.
Reference
Sorry, I forgot them.

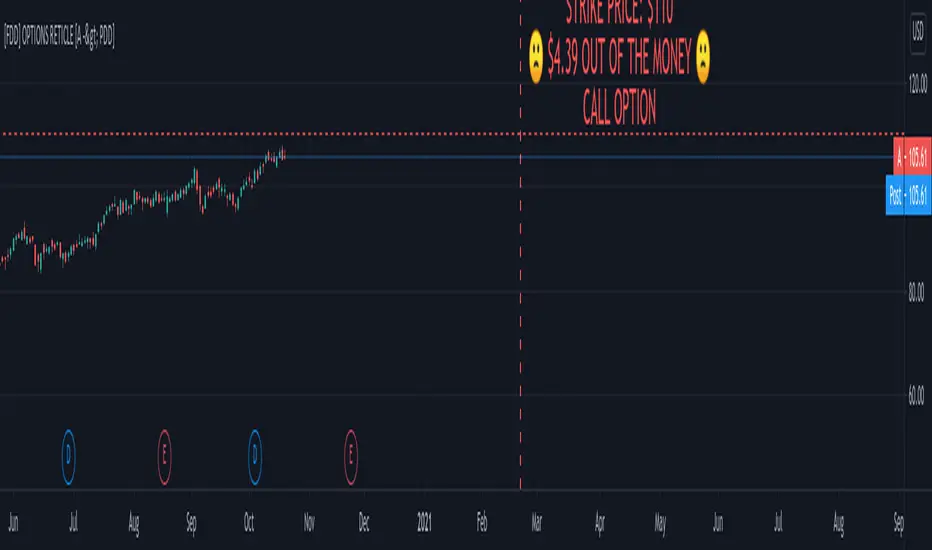
FOMO DRIVEN DEVELOPMENT OPTIONS RETICLE Options Reticle caters to degenerate traders and gamblers worldwide, reaching out for long distant contract expiration and just OTM strike placement.
Generate the overlay yourself using the tradingview-options-reticle CLI tool found on GitHub.
The Options Reticle provides a targeting system overlay that will show a horizontal OTM strike price and verticle expiration target. If you're thinking as soon as the expiration date has passed, this overlay will be useless; you're right but, you can use the options-reticle CLI tool to generate a new overlay from a watchlist exported from TradingView.
OVERLAY FEATURES:
Quick Action PUT (QAP) Mode - When you flip the chart by adding a 0- in front of the symbol, you will see the PUT contract target. Strike Price / Expiration Crosshairs.
Fill Mode - Shows a fill between the historical price and the target strike price. It will show green when ITM and red when OTM. Target information panel - Shows the company name, days till expiration, month and day of expiration, strike price, dollars OTM or ITM, and the contract type.
Emotion Indicator - Shows an exact representation of your feelings based on if you were in the trade. It has an accuracy of 99.9 percent.
QUICK ACTION PUT (QAP) MODE :
This style of reticle is not visible until you flip the chart. The advantage of the (QAP) is that it maintains the same appearance as the standard style of reticle, making PUT contract targeting feel the same. When targeting with (QAP) mode, be aware that the chart prices are reversed. Up is down, and down is up; this can be confusing but will feel normal overtime. Activate QAP mode by appending a 0- to the symbol of the chart. If nothing appears, no put option data was found for that symbol.
CALIBRATING YOUR RETICLE :
The overlay is generated using the options-reticle CLI tool found on GitHub. The adjustment script will parse a watchlist exported from TradingView then download options data for each ticker in the watchlist. The max amount of symbols you can add to a single overlay is about 200. Any more than 200 and the overlay will crash. Luckily, If you use a TradingView watchlist with more than 200 ticker symbols to generate overlays, the options-reticle command-line tool will automatically create multiple overlays with 200 tickers each. You can add multiple overlays to your chart to get all the tickers in the watchlist.
RETICLE GENERATION AND MOUNTING :
Add all the tickers you want to track into a watchlist on Tradingview.
Export the watchlist into a txt file using TradingView's watchlist export list button.
Open the terminal and change to the directory with the downloaded watchlist txt file.
Install options-reticle command tool with pipx. pipx install tradingview-options-reticle.
Run the command options-reticle download --watchlist {name of watchlist.txt file}. This will download the options data to an options_data.toml in the same directory as the watchlist txt file.
Run the command options-reticle build --options-data-input-path options_data.toml. This will generate the overlay scripts. If the watch list has more than 200 ticker symbols, it will generate a separate overlay script for every 200 ticker symbol chunk.
Copy and paste each of the generated overlay scripts one at a time into the Pine Editor on TradingView, then click the Add to Chart button. Make sure you copy the entire code.
FUTURE FEATURES :
Give the choice to generate PUT option contracts without using QAP mode. This option will allow you to use the input settings to change the contract type without flipping the chart.
Max OTM target argument - This will allow the option-reticle CLI to generate overlays with deeper OTM contracts. It currently only searches for the first OTM contract.
Add the ability to change the crosshair line type.
Keltner Channels times 4!Have you always wanted the ultimate MOMO buying script? Well here you go, KC stacked on top of one another.
As Trump would say,
ENJOY!

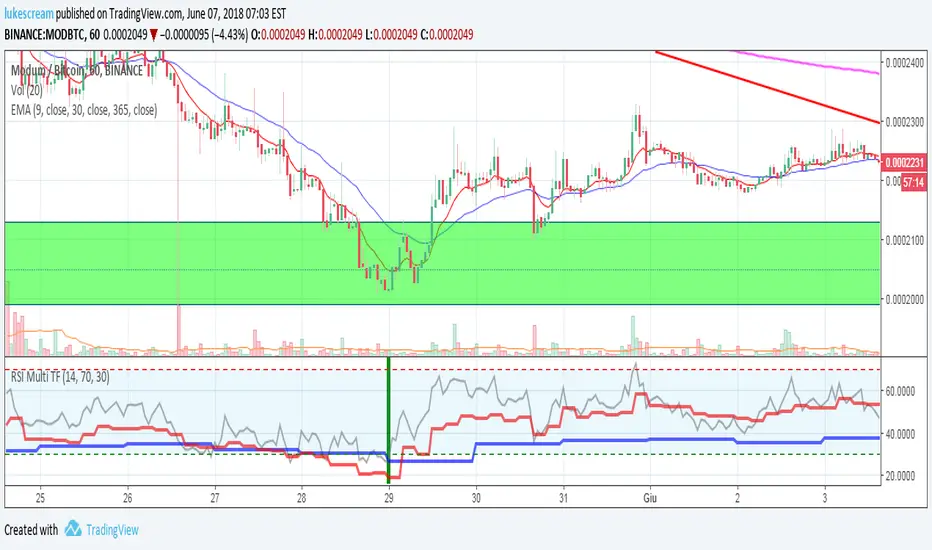
RSI Multi Time Frame - Spot Panic Sell Moments and profit!Union of three RSI indicators: 1h, 4h and daily. In order to show 1h RSI, you have to set it as active time frame on the chart.
Purpose: spot "triple oversold" moments, where all the three RSI are under the threshold, which is 30 by default but editable.
Target Market: Cryptocurrencies. Didn't try it on other ones, may work as well. Fits Crypto well as, by experience, I can tell it usually doesn't stay oversold for long.
When the market panics and triple oversold occurs, the spot is highlighted by a green vertical bar on the indicator.
The indicator highlights triple overbought conditions as well (usually indicating strong FOMO), but I usually don't use it as a signal.
I suggest to edit the oversold threshold in order to make it fit the coin you're studying, minimizing false positives.
Special thanks to Heavy91, a Discord user, for inspiring me in this indicator.
Any editing proposal is welcome!
I reposted this script, as the first time I wrote it in Italian. Sorry for that.