Keltner-Aroon-EFI FlowKeltner-Aroon-EFI Flow (KAE)
KAE Flow is a quantitative composite indicator designed to identify dominant market trends by fusing three distinct dimensions of price action: Volatility, Trend Age, and Volume Pressure.
Unlike standard indicators that rely on a single data point (like a moving average crossover), KAE Flow aggregates three independent logic engines into a single normalized "Flow" score. This score is then smoothed using an Arnaud Legoux Moving Average (ALMA) to filter out noise while retaining responsiveness to genuine trend reversals.
This script operates strictly on the current chart timeframe, ensuring all signals are causal, non-repainting, and reliable for real-time analysis.
1. The Quantitative Engine (How it Works)
The indicator polls three separate components. Each component votes "1" (Bullish), "-1" (Bearish), or "0" (Neutral). These votes are averaged to create the raw signal.
K — Keltner Channels (Volatility Dimension)
Concept: Measures volatility expansion.
Logic: The script calculates Keltner Channels using an EMA center line and ATR bands.
Bullish (+1): Price closes above the Upper Channel.
Bearish (-1): Price closes below the Lower Channel.
This component ensures we only trade when price is breaking out of its expected volatility range.
A — Aroon (Trend Age Dimension)
Concept: Measures the strength and "freshness" of a trend.
Logic: We utilize the Aroon Up and Aroon Down metrics.
Bullish (+1): Aroon Up is greater than Aroon Down AND Aroon Up is > 70.
Bearish (-1): Aroon Down is greater than Aroon Up AND Aroon Down > 70.
This filters out weak or aging trends, ensuring the move has mathematical momentum.
E — Elder’s Force Index (Volume Dimension)
Concept: Measures volume-weighted price change.
Logic: We calculate the raw Force Index (Close - Close ) * Volume and smooth it with an EMA.
Bullish (+1): Smoothed EFI > 0.
Bearish (-1): Smoothed EFI < 0.
This component confirms that price movement is supported by actual volume flow (accumulation/distribution).
2. Signal Processing (ALMA Smoothing)
Raw aggregation can be noisy. The composite score is passed through an ALMA (Arnaud Legoux Moving Average) filter.
Why ALMA? It uses a Gaussian distribution to provide smoothness without the significant lag associated with SMA or EMA. This creates the "Flow" line that resists false flips during choppy consolidation.
3. How to Use
The indicator plots a signal line and dynamically colors the price bars and background to reflect the dominant bias.
Deep Blue (Bullish Flow): The KAE Score is > 0.1. All three engines (or the majority) are aligned bullishly. Traders typically look for long entries or hold existing long positions.
White (Bearish Flow): The KAE Score is < -0.1. The majority of engines detect bearish volatility and volume. Traders typically look for short entries.
Gray (Neutral): The score is between -0.1 and 0.1. The market is in equilibrium or transition. Trend-following strategies should be paused.
4. Configuration
Logic Engine: You can toggle individual components (K, A, or E) on or off to isolate specific market dimensions.
Smoothing: Adjust the ALMA Window and Offset to fine-tune the sensitivity of the signal line.
Lengths: Fully customizable periods for Keltner, Aroon, and EFI to adapt to different asset classes (e.g., Crypto vs. Forex).
Forceindex

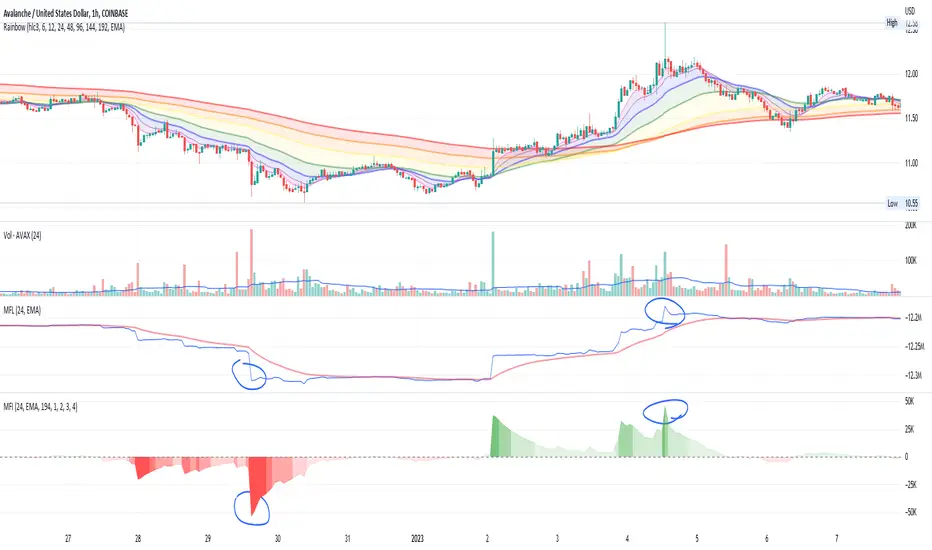
Money Flow IntensityThis indicator works very similarly to Elder's Force Index (EFI) and builds on top of what I have for the Money Flow Line (see my other scripts). It combines price movements with volume to create sort of "dollar flow" pressure up and down, looking for "smart money" ("big money") to make their move.
The indicator uses a lookback period to calculate a standard deviation of the movement intensity, then creates gradients to visualize how intense the movement is relative to other movements. This helps measure the pull away from the average more easily than with the Money Flow Line alone.
Much like with EFI, high intensity moves can indicate two things:
1. Strength and conviction in the current direction OR...
2. A reversal is coming soon
You can also watch for waning volume in the current direction, indicating that a trend is losing interest and may be due for a pullback.
There is no way to know, but combining this with price action and a trend indicator can help give you some good educated guesses about what could happen next. Combine with averaging in or out and managing risk appropriately. Good luck :)
Force Index// 2020.7.30 version
// This indicator is for the second filter in Triple Screen Trading System
// force index will combine volume and price together to decide the power of price change
// force index = volume * (Change of Price)
// try to smooth the series of force index by ema force index
// Method to use this index
// This indicator is for the second filter in Triple Screen Trading System
// if Trend is bull, long when force index is below 0
// if Trend is bear, short when force index is above 0
// As for how to decide bullish market or bearish market, please check it according to the first filter of Triple Screen Trading System

Force IndexWhat is the force index ?
The force index is an oscillator used to confirm price breakout strengths and identify potential trends.
It was popularized by A. Elder.
How the force index is computed ?
Knowing that volume is the fuel of a price movement, reliable breakouts and trend continuation are more likely to occur on high volume breakouts. This is why the force index is computed with the intensity of the price movement, and it's volume , using the formula ema13((close(n) - close(n-1)) * volume ) .
How to use the force index
An important change in the force index indicate a strong momentum in the price action.
You can read more about the force index interpretation on Investopedia
Customization
You can display the indicator as an histogram, or as a line chart.
You can change EMA length, although it's recommended to keep it at default value.

Elder's Force Index with bollinger bandsThis scripts is usefull to identify possible top or bottoms of the markets.
Red BB : Sell
Green BB : Buy

Range Force Impulse The "Range Force Impulse" indicator combines 4 useful indicators into one, freeing up chart real-estate and giving the trader insight into trend health, bull/bear commitment, range and volatility all at a glance.
The indicator consists of the following:
Direction - True Range and Average True Range columns shown above and below 0 depending on direction of the period's price
-- TR (gray) shows the current period's trading volatility
-- ATR (Impulse colors, see below) shows an EMA of TR over a specified length
-- Can be used to determine stops and targets (Example: Stop loss at prev close - ATR, Target at 2x ATR)
Index - Alexander Elder's EMA of (change(close) * volume), shows crosses above 0 (green) and below 0 (red), and intermediate signals
-- Shows bull vs. bear interest/commitment/dominance
-- Elder recommends EMA length of 2 for daily chart buy/sell signals, and 13 for weekly chart bull/bear dominance & trend direction signals
-- Intermediate signals are shown above 0 when falling (salmon), or below 0 when rising (pale yellow)
System - Range columns are colored using Alexander Elder's censorship system (green: do not short, red: do not long, blue: is up to you)
-- Shows overall trend health (Macd histogram and EMA up/down changes)
