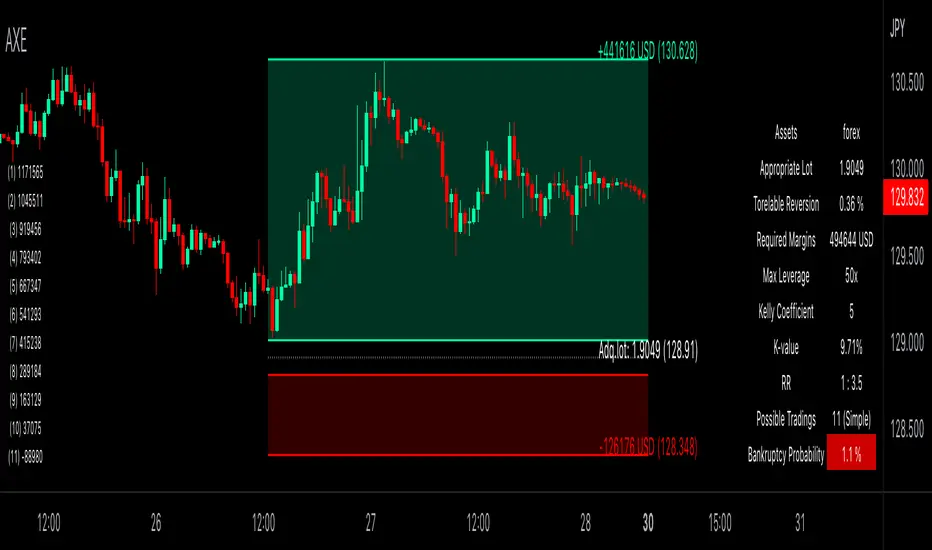
Auxiliary Equity Configurator (AXE)Auxiliary Equity Configurator (AXE) is a whole new level money management auxiliary that calculates statistically preferable lot based on the Account balance, Winning rate, Risk reward ratio, and Kelly multiplier configured a priori in the input panel.
On the chart, RR visualization bands, Expected balance history matrix in the worst successive trading loss (for displaying how many times you can trade with a given lot at simple/compound interest), and Info-table for the calculation details are shown.
Regarding RR visualization bands, whenever the Tolerable drawback input changes, the proper lot is calculated based on the given data. You can easily access how many lots you should possess and the take-profit/stop-loss price to set. A tolerable drawback can be placed in the quoted currency rate of the displayed chart, except the forex and part of CFD symbols (Gold, Silver, Platinum, WTI oil, Brent oil, Natural gas, and more in the future!) that is valued in Pips. Parameters are configurable in suit with the broker you are using. Also, RR visualization bands are brilliantly interactive, thanks to pine v5 interactive scripts.
The currency for Account balance and Tolerable drawback is automatically converted to USD for internal calculation; therefore, no mess-ups around thinking currency value conversion whatsoever! The design for each tool is highly customizable, too.
Unleash yourself from consuming the colossal amount of time thinking of money management with AXE!
Forex
DTFL FOREX OverlayThese tools are used by FOREX traders who primarily follow the DTFL trading strategy, however, they can easily be utilized by any other FOREX trader looking for an all-in-one indicator that includes sessions, previous high/lows, session values, various moving averages and lockable ADR/ATR lines.

High - Low Difference (Forex)This script is created to read and label the difference between High and Low of a candle in points term & in percentage term.
This is basically made for Forex Trading.
Do explore the settings of the scrip.

SMART4TRADER - BREAKOUTThis indicator shows the breakthrough of extremes for the selected period. The default period is set = 3
The indicator checks on the current bar whether the maximum or minimum prices for the selected period are broken
----------------
Данный индикатор показывает прорыв экстремумов за выбранный период. По-умолчанию выставлен период = 3
Индикатор проверяет на текущем баре пробиты ли максимальные или минимальные значения цен за выбранный период

Heikin Ashi Trailing Stoploss ActivationThe Basics
This indicator should be used on regular candle sticks. It is possible to trigger an alert, when the block flips from red to green bar. Or vice versa.
Red block represents a red Heikin Ashi candle.
Green block for green Heikin Ashi candle.
It can be used as a trailing stoploss for (DCA/ TV) bots, when riding trends.
What Makes It Different
The user can preset the price (of the asset e.g. BTC), where it will start looking for Heikin Ashi flips. Every Heikin Ashi flip before this preset price will be ignored. Preset prices could be chosen tactically at resistance levels.
Different time frames of Heikin Ashi flips can be used together. E.g. 10 min, 3 hour or 2 Day time frames. If this is possible within your Tradingview subscription.
Example
The user has a long position (bought at the green arrow.) The user wants to start trailing at price 88 USDT (blue line).
The indicator will only trigger when the following conditions are met:
Cross of red block on the indicator (representing red Heikin Ashi candle)
Price has crossed 88 USDT
If the candlestick turns from a green to a red block, before crossing 88 USDT. It will NOT trigger the alert. Visible as the orange down arrows. In the indicator below it is displayed as a red block.The alert will go off at the red down arrow on 10th Nov (if chosen for Once per bar close). The price condition of 88 USDT was already met at 7th Nov.
Final Words
Disclaimer: Please use it with care and at own risk. The owner of this indicator is not liable for any financial losses.
Past performance is no guarantee of future returns.

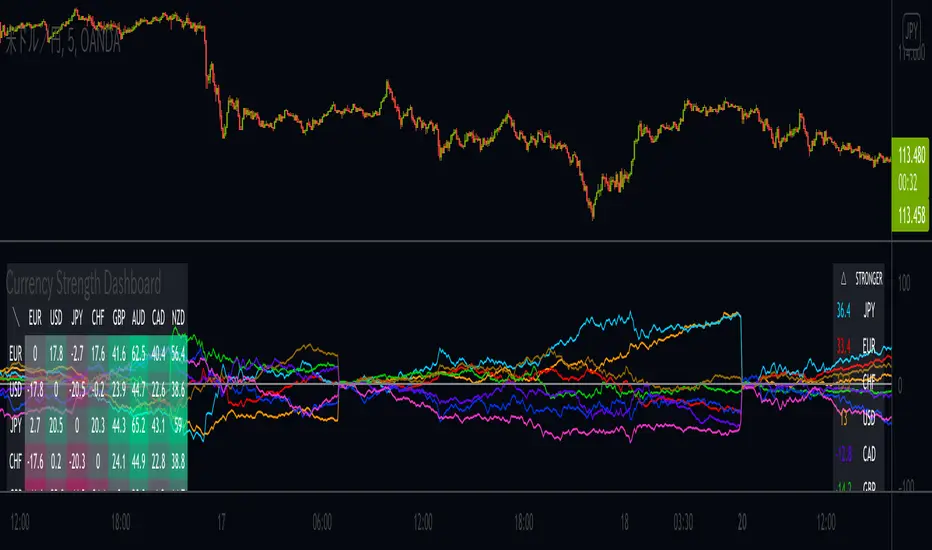
Currency Strength DashboardDrawing Currency Strength (consists of: USD, EUR, JPY, GBP, AUD, CHF, CAD, NZD) historical plots in parallel with currency strength heat map and dynamic legend, which makes this script unique as Dashboard.
Calculation criteria is based on user's input: Session, by which you can recalculate based on D, W, M.
Supertrend NinjaSupertrend Ninja
The Basics
The Supertrend Ninja is a trend-following indicator. The indicator is optimised for daily, 2 days and 3 days candlesticks and can be used on varying trending markets.
Supertrend Ninja using 2 days candlesticks only gave 7 bullish signals in 2020 and 2 in 2021 for Bitcoin/USDT (based on Binance charts). Greatly reducing false signals. It can be used on lower time frames as well, although you will encounter more noise.
This indicator could be used as a compass for DCA or TV bots as well.
What To Look For
When the background of the candlestick closes green with an upwards pointing pink arrow. It indicates a possible bullish (up)trend. To enter a trade its best to place an order a few ticks above the candle high. This way we only enter a position, when there is trend continuation.
When the background of the candlestick closes red with a downwards pointing black arrow. It indicates a possible bearish (down)trend. To enter a trade its best to place an order a few ticks below the candle low.
Exits can be determined by Fibonacci extensions, orderblocks or other resistances to name a few. Or exit the trade when the opposite background color appears.
Final words
Disclaimer: Please use it with care and at own risk. The owner of this indicator is not liable for any financial losses.
Past performance is no guarantee of future returns.

Triple CSWhat this indicator does:
This indicator will be scanning for ranges of extremity.
It measures multiple underlying factors in the financial markets like measuring levels of strength using RSI, momentum using Stochastics and extreme ranges using Bollinger Bands.
What is "extreme range" criteria: ranges above 70 or below 30 on RSI and Stoch are considered extreme, as well as moments of extreme volatility exceeding overbought and oversold levels on BBs.
All monitored data is to be plotted in a horizontal row, providing information about oversold, overbought and mid-range market conditions. This data will either meet the criteria simultaneously and plot a Red or Green indication or it will miss one or more requirements, plotting Gray indications.
This indicator is a real-time indicator, meaning it's updating live and due to this tracking in real-time, indications not yet 'printed' can give false readings. For performance purposes, it is best practice to allow all indication plots to 'print', meaning if a plot ever changes in color, it's best to allow that candle to fully close , ticking to 0:00 before confirming the accuracy of the indicator's findings.
How it works:
This indicator scans multiple sources of data simultaneously. When appropriate conditions within a trading range are met, the indicator will update it's color.
The indicator will plot Gray , Green , and Red indications which can be explained below.
-
Grey plots : No indication of full extremity, meaning one or more conditions being tracked has not met requirements, suggesting price is likely in mid-range.
-
Green plots : Extremity level lows have been simultaneously met, data indicates extreme oversold conditions are likely present.
-
Red plots : Extremity level highs have been simultaneously met, data indicates extreme overbought conditions are likely present.
What market will this indicator work on?
Stocks > Forex > Crypto
All the above are supported by this indicator.
Charts with more history have more data for the indicator to utilize. (Lack of data can result in poor performance.)
- This indicator performs best on 4H, 12H, D, and W timeframes, although you can use this indicator on any timeframe TradingView supports.
This indicator was created to find ranges of extreme trade which can help traders be more confident in their timing with the market.
Trading can be difficult, let an algorithm scan the market and monitor for early signs of volatility changes.
Past performance does not guarantee future results. Please do your due diligence when placing trades.

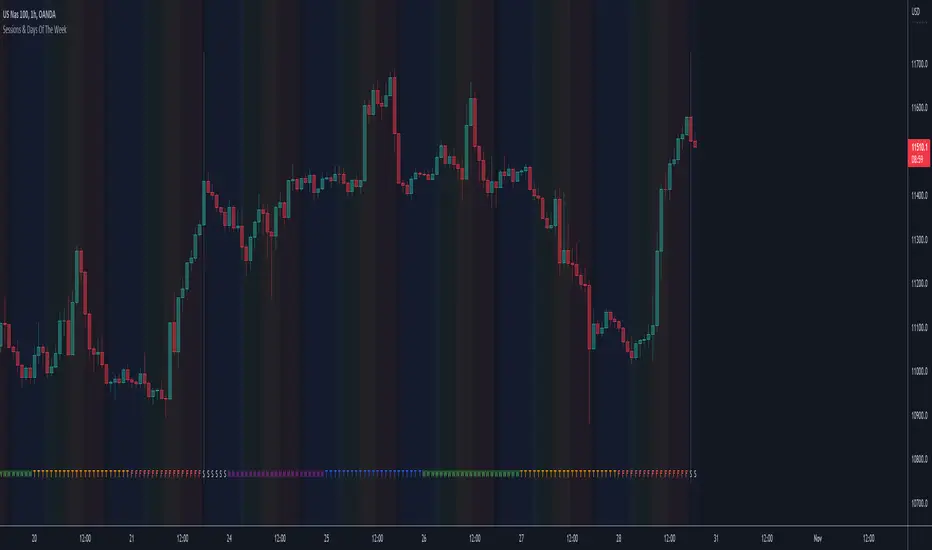
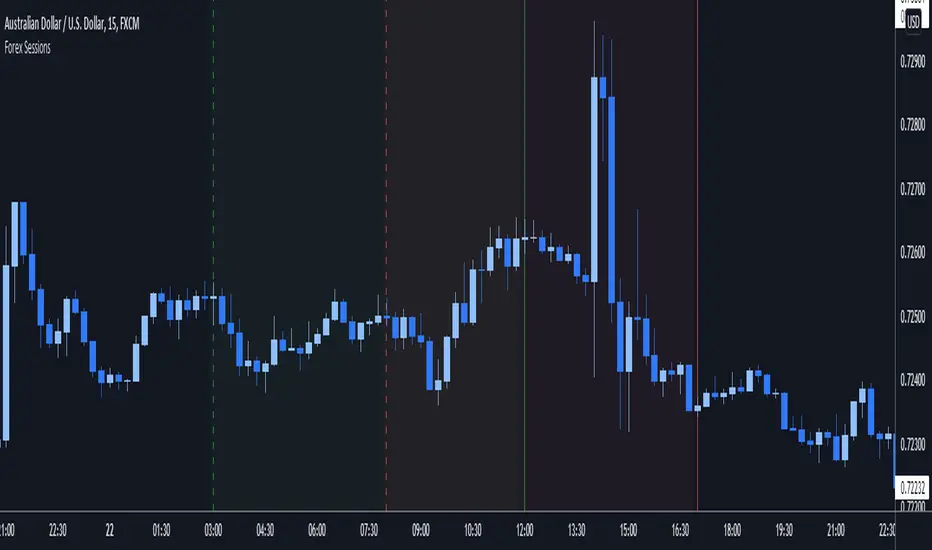
Sessions & Days Of The WeekTraders tend to focus their energy on specific sessions or time periods. This indicator will plot the days of the week, and also highlight the following sessions: Frankfurt (2:00am - 11:00am EST), London (3:00am - 12:00pm EST), New York (8:00am - 5:00pm EST), Sydney (5:00pm - 2:00am EST), Tokyo (7:00pm - 4:00am EST).
It’s important to be aware that Session Open and Close times will vary based on the time of year, as countries shift over to daylight savings time.
Fibonacci Moving AverageThe Fibonacci Moving Average is a powerful indicator that takes into account many underlying moving averages to give out an approximate short-term/long-term view of the markets. Its strength lies with dynamic support and resistance levels. I have created this indicator in order to improve trend-following entry positions.

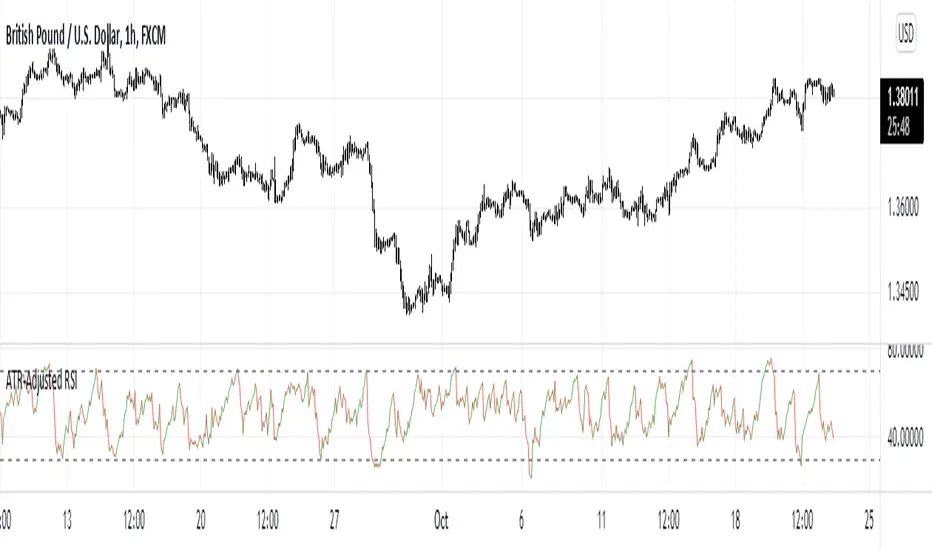
ATR-Adjusted RSIThis indicator adjusts the RSI values using the Average True Range. It is used the same way as a normal RSI.
FY Forex ScalperFy Forex Scalper Indicator:
A powerful indicator that you can use to scalp forex markets, it helps you identify the trend and direction of the market in both long term and short term time frames. The Arrows give you entry points. Read the detailed explanation below and if you have any questions feel free to message.
How does it work:
Fy Forex Scalper has two main aspects one is candles and the other is band both are color coded and works independently. As we all know, markets are not always trending and often move in a tight range. The Fy Forex Scalper indicator assists you in identifying trading opportunities by displaying trading zones and non-trading zones by painting the candles in three different colors: red, yellow, and green. When the candles are red, the script is in the selling zone, when the candles are green, the script is in the buying zone, and when the candles are yellow, the script is non trading zone. The band mainly works as support and resistance and gives you overall trend direction, If the band is red the trend direction is down and if band is in green the trend is up. So both candles and band give you the trend direction how to enter the trade explained below.
How to enter the trade:
Long Entry: Enter the trade when you get the up arrow near the band and make sure the band color is green. When you get the up arrow and band is red you can consider it as false signal.
Short Entry: Enter the trade when you get a down arrow near the band and make sure the band color is also red. When you get the down arrow and the band is in green color you can consider it as a false signal.
What markets it work:
Mainly use it for Forex, Crypto or scripts that move faster.
What time frame is best:
Use 5 mins when the market is moving (like Asian or London opening) use one min when the market isn’t moving.
Can we use it for Swing Trading:
Though it works , but the primary purpose of this indicator is for scalping so better use it on shorter time frames.
How to get access:
This is invite only script so to get access message me.

Forex Session Volume ExplorerFigure out the best time to trade your favorite Currency Pair, Commodity, or Crypto!
This indicator is an exploration of how Forex Sessions affect volume. The colored plots below represent the accumulative volume during each of the four major trading sessions: London, New York, Tokyo, and Sydney.
Plots have been normalized as a percentage of total volume, i.e. London = 34.2 signifies that 34.2% of all volume occurs during the London Session.
Trading the session with the highest volume will greatly benefit your Win Rate, especially when using "typical" indicators and strategies.
Use in conjunction with my previous tool for a clean & customizable visual representation of Forex Sesssions:
Forex Trading Sessions
Cheers,
EFX (@DasanC)

Forex Trading SessionsThere are a million Forex Trading Session indicators out there, but I couldn't find one with all of the following requirements:
1. Automatically show the Sessions that actually affect the current pair (for instance, Tokyo session doesn't matter when trading EURGBP)
2. Editable colors or at the very least no distracting colors
3. Editable times for each exchange session
4. Unique indication of the start of a session vs the end of a session. (Sometimes, I don't notice a background going from Navy Blue to Black)
This indicator has everything I could ever want in a Sessions Tool:
Subdued default colors
Editable colors
Editable session ranges
Obvious, but not obnoxious indication of start and stop
Automatically hide irrelevant Sessions
Cheers. EFX
Intraday FOREX london scalperThis forex System is only for ECN Broker Account.
Pairs: Major with spread < 0.0001 (EUR/USD).
Setup:
Wait for the market to make to 60 minute from the open.
If the market is near the intraday high be prepared to go short
If the market is near an intraday low for the same time period, then be prepared to go long.
Rules for entry
For sell setups: Enter on sell stop 1 pip from low of the last 15 min bar.
For buy setups: Enter in buy stop 1 pip from high of the last 15-minute bars.
Rules for exit
Take profit: Close out positions on 6 pips profit..
Stop Loss: Close out on 5 pips loss or if trade takes more than 1 minute.

Forex sessions with daylight savingsThis will adjust with Daylight Savings (DS) however you will need to update the start and end dates of DS once each year. That said, it's valid for 2021 and I'll try to remember to update this script each year so people don't have up to do the update of the DL start and end dates.
If there is a way to know these dates automatically in pine script someone please let me know.
Notice that Sydney has an offset of -1 instead of 1 for DS since being on the other side of the planet (sorry flat Earthers but this is a side-effect of a globe) they need to put their clocks backwards for DS instead of forwards.
Features:
Shows sessions for: Frankfurt, London, New York, Sydney & Tokyo
Includes Daylight savings changes
Has a legend you can display and hide to see which colors are for which sessions around the world
Allows you to show or hide each session individually
Allows you to display the legend in the same opacity as the indicators or 0 opacity to make it more readable.
This is my first public script so feedback most welcomed.

ExpertToken Buy/Sell SignalExpertToken Buy/Sell Signal เป็นอินดิเคเตอร์ที่สามารถบอกสัญญาณการซื้อขาย และบอกแนวโน้มของราคาได้
หลักการทำงาน
สัญญาณ Buy/Sell ถูกกำหนดโดยการใช่ CCI วัดโมเมนตัมการซื้อขาย หาก CCI ส่งสัญญาณว่าแรงขายเยอะเกินไป และมีแนวโน้มราคาจะกลับตัวสูงขึ้น ก็จะส่งสัญญาณ Buy แต่หาก CCI ส่งสัญญาณว่าแรงซื้อเยอะเกินไป และมีแนวโน้มราคาจะกลับตัวต่ำลง ก็จะส่งสัญญาณ Buy
เส้นสีน้ำเงินเป็นเส้น EMA 200 ไว้ใช้บอกแนวโน้มระยะยาว
เมฆขาว ประกอบไปด้วย เส้นสีเขียว(เส้น EMA เคลื่อนที่เร็ว) และเส้นสีแดง(เส้น EMA เคลื่อนที่ช้า) โดยให้ทั้งสองเส้นตัดกันเพื่อบอกสัญญาณการกลับตัว ค่าเริ่มต้นของทั้งสองเส้นเป็น 20, 50
วิธีการใช้อินดิเคเตอร์
ขั้นตอนแรก ให้ดูเส้นสีน้ำ หากราคาอยู่เหนือเส้นสีน้ำเงิน อาจมีแนวโน้มที่ราคาจะขึ้น
ขั้นตอนที่สอง ให้ดูเมฆ ที่ถูกสร้างขึ้นโดยการน้ำเส้น EMA 2 เส้น สีเขียวและสีแดง หากเส้นสีเขียวอยู่เหนือเส้นสีแดง ราคาอาจมีแนวโน้มที่ขึ้น หากเส้นสีแดงอยู่เหนือเส้นสีเขียว ราคาอาจจะลง แต่ถ้าหากราคาอยู่ในโซนเมฆขาว(ราคาอยู่ระหว่างเส้นเขียวกับสีแดง) ราคาอยู่ในช่วงเป็นกลาง
สุดท้าย หากมีข้อความบอกสัญญาณบอกว่า Buy หรือ Sell ให้พิจารณาจากสองขั้นตอนก่อนหน้านี้ หากมันสอดคล่องกับสองขั้นตอนก่อนหน้านี้ ให้พิจารณาการเปิดตำแหน่งตามสัญญาณ
################################################################################################
ExpertToken Buy/Sell Signal is an indicator that can give you trading signals. and tell the trend of the price
How it works
Buy/Sell signals are determined by using CCI to measure trading momentum.
If CCI signals too much selling pressure and there is a tendency for the price to reverse higher It sends a buy signal, but if CCI signals that it is overbought and the price tends to reverse lower will send signal Buy
The blue line is the EMA 200 line to indicate a long-term trend.
The white cloud consists of a green line (fast moving EMA line) and a red line (slow moving EMA line), with the two lines intersecting to signal a reversal. The default values for both lines are 20, 50.
How to use the indicator
The first step is to look at the watercolor lines. If the price is above the blue line There may be a tendency for prices to go up.
The second step is to look at the clouds that are created by watering the 2 EMA lines, green and red. If the green line is above the red line The price may tend to go up. If the red line is above the green line, the price may go down, but if the price is in the white cloud zone (the price is between the green and red line), the price is in the neutral range.
Finally, if there is a signal to say Buy or Sell, consider the previous two steps. If it complies with the previous two steps Consider opening a position based on a signal.

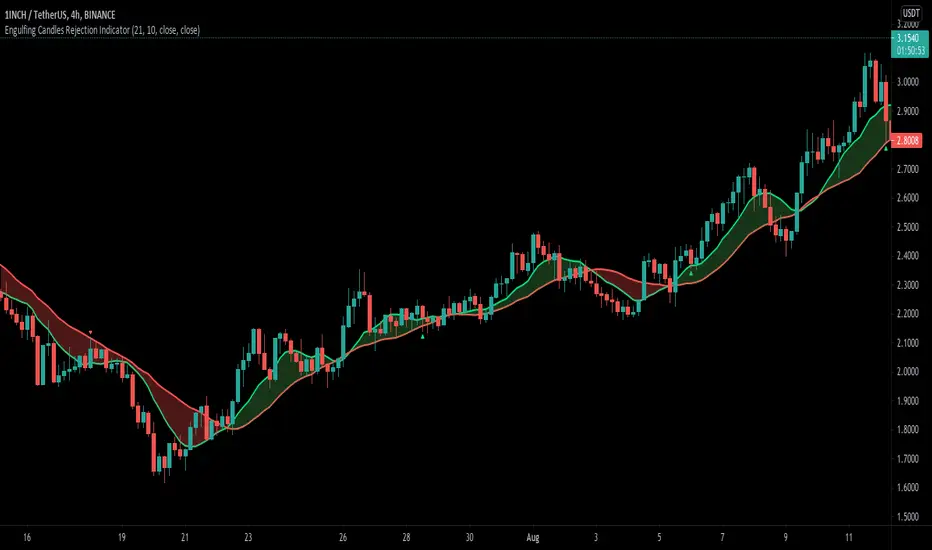
Engulfing Candle Rejection IndicatorThis indicator allows you to filter noisy chart, with engulfing candles which have been rejected from current trend lines. Trend lines by default are 21 MA (fast) and 10 MA (slow one). If fast moving average is greater than slower one, automatically indicator would represent that like uptrend, and if opposite then like a downtrend.
Consider to work only on higher time frames like 1H and higher, so you really can find only best entries.
Have fun, best wishes!
Volatility Adjusted Grid [Gann]█ OVERVIEW
Gann Square of 9 is one of the many brilliant concepts from W.D.Gann himself where it revolves around the idea that price is moving in a certain geometrical pattern. Numbers on the Square of 9 spiral tables, especially those lie in every 45degree in the chart act as key vibration levels where prices have tendency to react to (more on the table below).
There are few square of 9 related scripts here in Tradingview and while there's nothing wrong with them, it doesn't address 1 particular issue that i have: The numbers can be too rigid even when scaled based on current price because the levels are fixed, which makes them not tradable on certain timeframes depending on where the price currently sitting.
Heres 5min and 1hour Bitcoin chart to illustrate what i mean: Grey line on the left is based on Volatility Adjusted levels, while red/blue on the right are the standard Gann levels.
You can see that on 1hour chart, it provides a good levels (both Volatility Adjusted and the standard one happened to share the same multiplier in this case),
1Hour Chart:
On 5 min chart tells a different story as the range between blue/red levels can be deemed as to big for a short term trade, while the grey line is adjusted to suit that particular timeframe (You can still adjust to make it bigger/smaller from the settings, more on this below)
5Min Chart:
█ Little bit on Gann Square of 9 table
This is the square of nine table, the numbers highlighted in Red are known as Cardinal Cross and considered to be a major Support/Resistance while those in Blue color are known as Ordinal Cross considered as minor (but still important) Support/Resistance levels
Similarly, this script use these numbers (and certain multipliers) to print out the levels, with Cardinal numbers represented by solid lines and Ordinal numbers by dotted lines.
█ How it Works and Limitations
The Volatility Adjusted grid will go through several iterations of different multipliers to find the Gann number range that is at least bigger than times ATR. Because it's using ATR to determine the range, occasionally you'll notice that the line become smaller as ATR contracting (and vice versa). To overcome this, you can change the size range multiplier from the settings to retrieve the previous range size.
Use the size guide at the bottom left to find the multiplier that suits your need:
1st Row -> Previous Range -- Change Range Size to number lower than this to get a smaller range
2nd Row -> Next Range -- Change Range Size to number higher than this to get a larger range
Example:
Before:
After:
As you'll soon realise, the key here is to find the range that fits the historical structure and suits your own strategy. Enjoy :)
█ Disclaimer
Past performance is not an indicator of future results.
My opinions and research are my own and do not constitute financial advice in any way whatsoever.
Nothing published by me constitutes an investment recommendation, nor should any data or Content published by me be relied upon for any investment/trading activities.
I strongly recommends that you perform your own independent research and/or speak with a qualified investment professional before making any financial decisions.
Any ideas to further improve this indicator are welcome :)

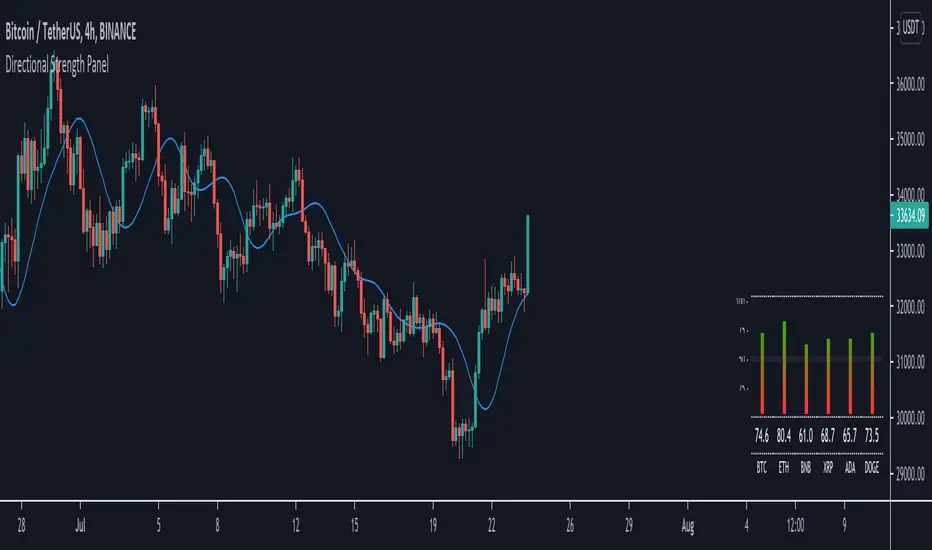
Directional Strength Panel█ OVERVIEW
The panel display trend momentum of selected coins/symbol (up to 6) based on the Arnaud Legoux Moving Average (ALMA). I'm using ALMA to measure the trend because it resolves 2 main issue of the more common moving averages, smoothing and responsiveness. By removing the minor fluctuations in price without sacrificing the responsiveness, the trend become much more clearer and easier to be measured.
In essence, as the meter approaches 100, it means the ALMA is pointing up (0 means pointing down)
█ Features
- Adjustable ALMA settings with options to turn on/off display the ALMA on current chart
- Select 6 symbols of your choice to be monitored in the settings (You have to manually update the label to display)
- Working on all timeframes
- Switch the panel color to suit background chart theme (Light/Dark)
█ Developer Notes
I'm working with table a lot lately and decided to publish this as a sample if anyone wishes to edit the script to display whatever they want. main calculation in get_data() function should be clamped to value between 0-100. As for the panel size, you can edit the row_max (currently set to 20 and 40) if you need it to be smaller or bigger (**i feel anything smaller than 16 is ugly)
█ Disclaimer
Past performance is not an indicator of future results.
My opinions and research are my own and do not constitute financial advice in any way whatsoever.
Nothing published by me constitutes an investment recommendation, nor should any data or Content published by me be relied upon for any investment/trading activities.
I strongly recommends that you perform your own independent research and/or speak with a qualified investment professional before making any financial decisions.
Any ideas to further improve this indicator are welcome :)
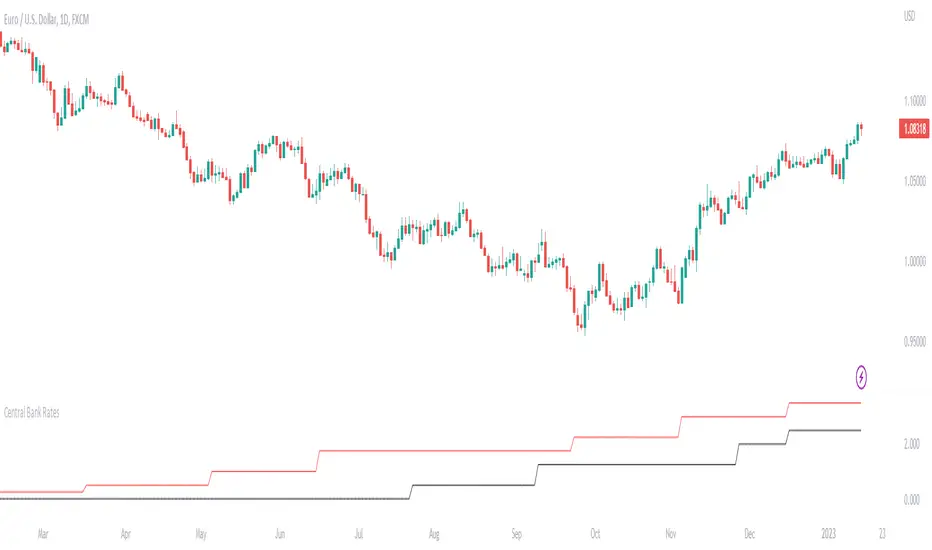
Central Bank Interest RatesThis indicator will show central bank interest rates on any major currency pairs.
I included the last 10 values for the study and will update them with future changes.
Major currencies: USD, CAD, NZD, AUD, JPY, EUR, CHF, GBP
I might add CZK, TRY, ZAR, and Yuan in the future.
Sideways detection bollinger bandsSideways detection indicator using Bollinger bands .
In this case we take the original ratio between lower and upper and we smooth it even harder in order to get a better idea about the accuracy of the trend.
If the initial ratio is not between 0 and 1 and the smooth ratio is higher than our selected value, we get an idea if we are a in trending market or not.
Of course using it as a standalone has no usage, and it has to be combined with other tools like moving average, oscillators and so on.
IF you have any questions let me know

3x EMA fast, 3 x MA slow + BB + PsarThis is a trend system which combines multiple fast EMA + mulitple slower SMA together with bollinger band channel and PSAR.
For entry rules the ones that I use are:
Long
We are inside BB channel, psar is ascending, and our close is above all moving averages or below all EMA'S + 1 SMA
WE can exit either when our close is below all EMA's or when PSAR is descending or when we hit upper/lower BB levels
Short
We are inside BB channel, psar is descnending, and our close is below all moving averages or below all EMA's + 1 SMA
WE can exit either when our close is above all EMA's or when PSAR is ascending or when we hit upper/lower BB levels
If you have any questions, let me know
