[astropark] Moon Phases [alarms]Dear Followers,
today I'm glad to present you an indicator which calculates Moon Phases and let's you set an alert over it.
This is a public free indicator based on the public one by @paaax:
I added my usual alert system logic, plus some more customization inputs for easy coloring.
The lower the timeframe you use it and set your alerts on, the more precise the alert value you get.
Here below the script for backtesting it:
Enjoy!
-- astropark
Forex

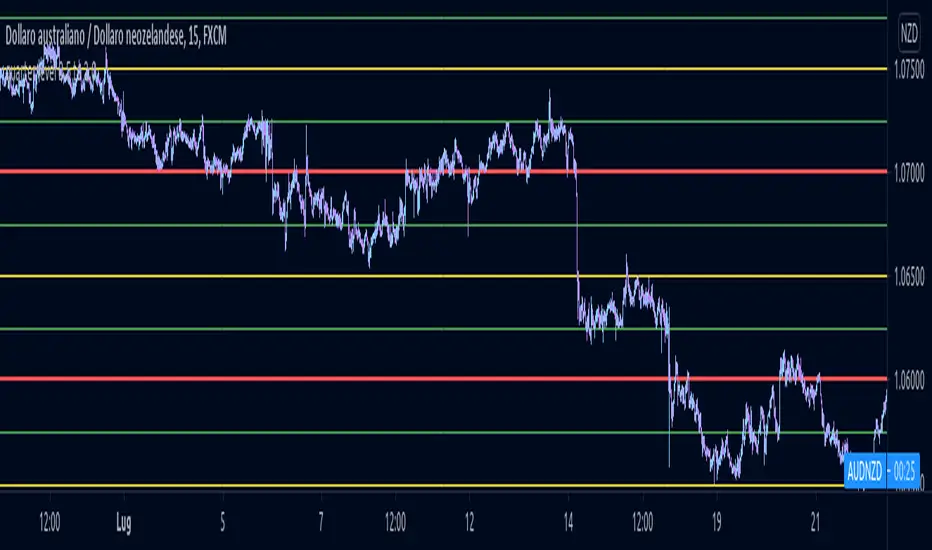
quarter level dinamicLimited quarter level script but more flexible in compared to my FX script, same logic behind
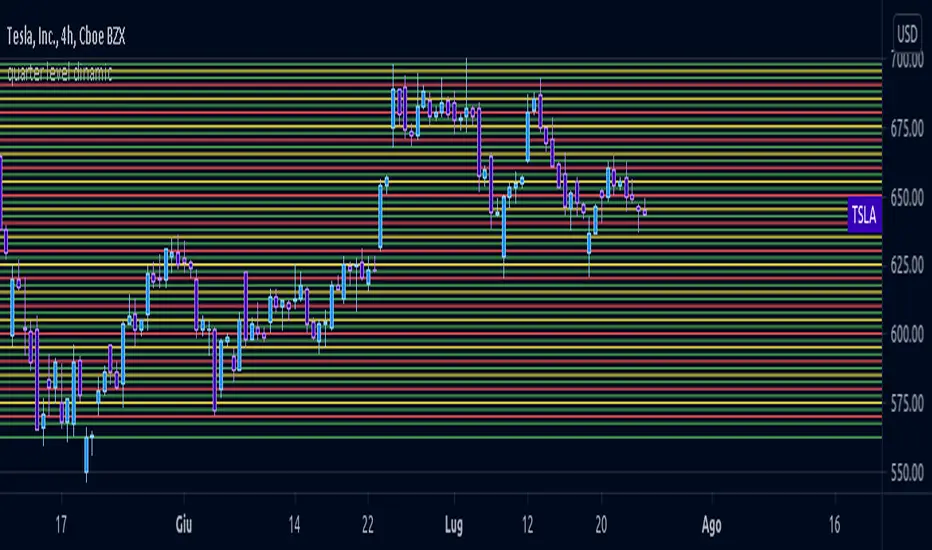
quarter level 0.5 to 2.0This script could help to see edged level for a reverse on forex, not for yen pairs and is based on quarter and round number theory.
I suggest to use it on H4 timeframe or lower to have a confermation on support or resistance level.
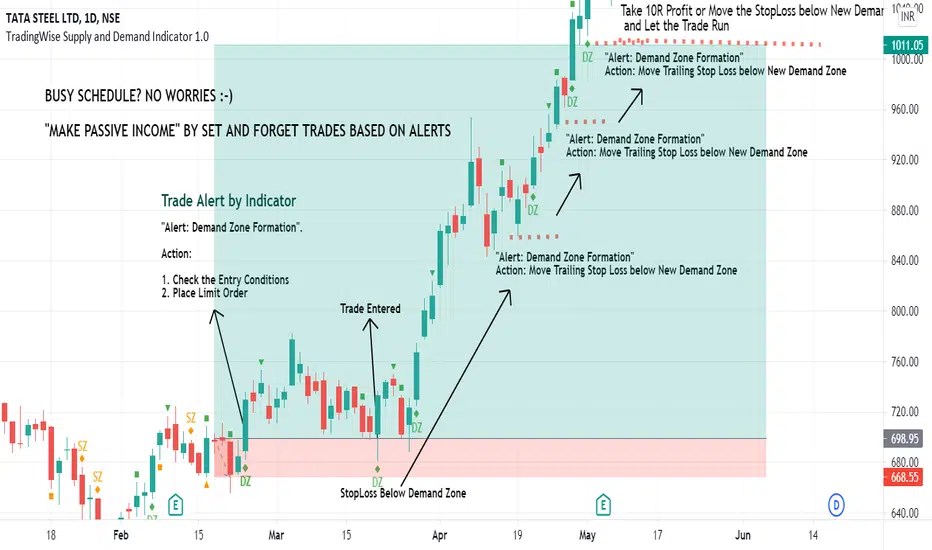
TradingWise Supply and Demand Indicator 1.0TradingWise Supply and Demand Indicator 1.0 is based on the Price Action candlestick patterns to identify the Supply and Demand zones in the charts (Areas of liquidity). It works on all Timeframes and Asset Classes. This Script helps the traders to identify the demand and supply zones with identifications on the candle stick patterns indicating the origin of the Strong move. Also it generates Alerts automatically once the supply or demand area is formed thus by reducing the hours spent on the charts and reducing the missed trade Opportunities as well. This Indicator is extremely helpful for those on Full time Jobs/ Busy Schedule.
Buy/Sell Alerts by Indicator:
Green Diamond + DZ Sign ---> Indicates the Demand Zone Formation. Place Buy Trade upon Entry Criteria Met
Orange Diamond + SZ Sign ---> Indicates the Supply Zone Formation. Place Sell Trade upon Entry Criteria Met
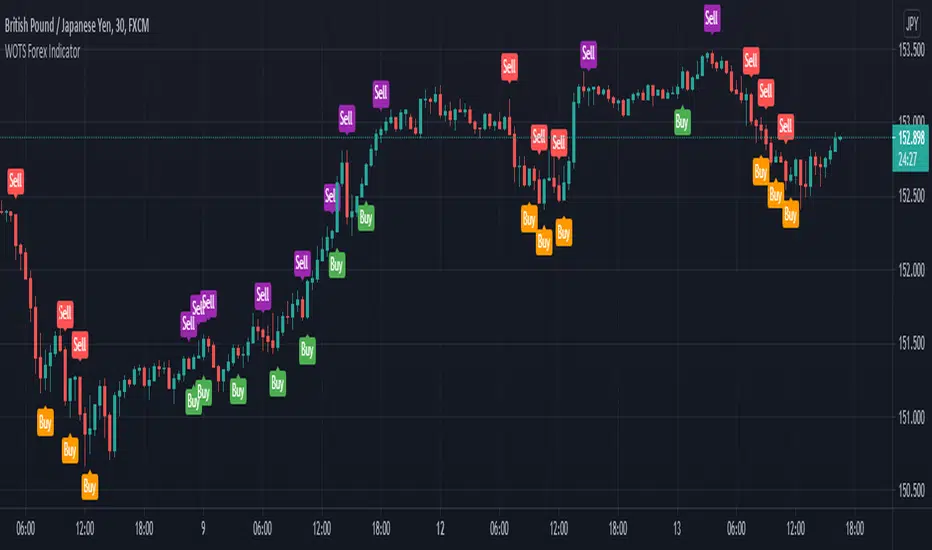
WOTS Forex IndicatorThe WOTS Forex Indicator gives you a true picture of the market entry points, after a scan it performs every period (after every candlestick closes) . It is pretty straightforward in its use with clear visual representation of the entry and exit points provided by the indicator.
This allows you to make improved entry and exit points either you're going long or short on any Forex pair you like, and accommodates many trading styles, systems, and strategies.
It will work along most TradingView indicators and the timeframes we recommend you using it are the 30M, 1H and sometimes the 4H chart.
The specific components of the indicator are:
Methodology:
The indicator uses a MACD oscillator to determine the local trend direction and to give buy & sell signals when its conditions are met.
An optional build-in indicator, exponential moving average cross (EMA cross), can be used to filter out 'false' signals.
The calculation of the entry points are drawn from universal prices that fit every pair in the Forex market you may choose.
Persistent variables are used for buy and sell prices, enabling color-coding of the signals (profitable or not).
Features:
Color coded labels - Buy & Sell
Four types of entries - Bull Buy = orange, Scalp Buy = green & Bear Sell = purple, Scalp Sell = red
Universal prices fitting all Forex pairs
Four Buy and Sell signal alerts
Remarks:
In our experience and recommendation, the values used work best on the 30-minute & 1-Hour timeframes. We encourage everyone to experiment the best results we had, were on this specific timeframe, higher or even lower.
Using the indicator on non-standard charts (Heikin Ashi, Renko etc.) can produce unrealistic results.
- Thanks to John Aslanis and Alexandros Temelkou the idealists and creators of this indicator.
Use the link below to watch a tutorial video, request a trial, or purchase for access
test Xbr Super Volume 3.0A new update that can be used in liquid markets using graphical analysis.
The logic of this indicator is to automatically carry out the analysis of points where there is volume absorption, indicating on the graph through an arrow and lines from which defenses and fights can be generated.
Using this methodology we can find good moments to negotiate.

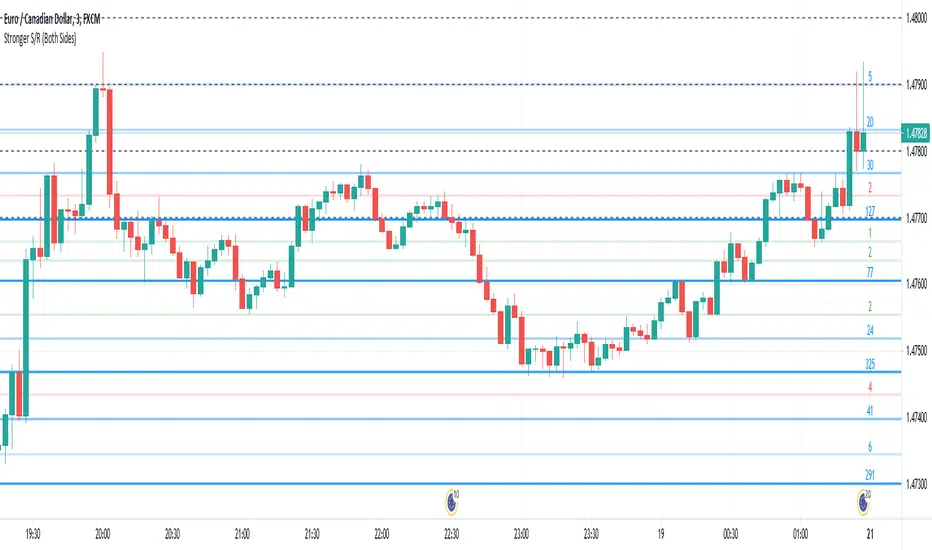
Stronger Classical Support/Resistance + Round LevelsI wrote some Support/Resistance scripts before this. In this new script, I implemented the logic of the code from the scratch, so it's very different from my previous S/R indicators and I think it's more advanced, accurate and efficient.
As the result it could do the followings for now:
- Draw more strong classical resistance/support levels by checking previous direction changes of the chart as far as Pine technically allows
- Colorize the levels based on the counted points of retracement/pullback (The darker the color is, the stronger the level is.)
- Show the number of reactions to each level
- Change the color of each level based on its main role as support, resistance or both
- Draw close round levels to current price for Forex pairs
I suggest all users of my previous S/R indicators to try this one.
Feel free to send me any issue or opinion!
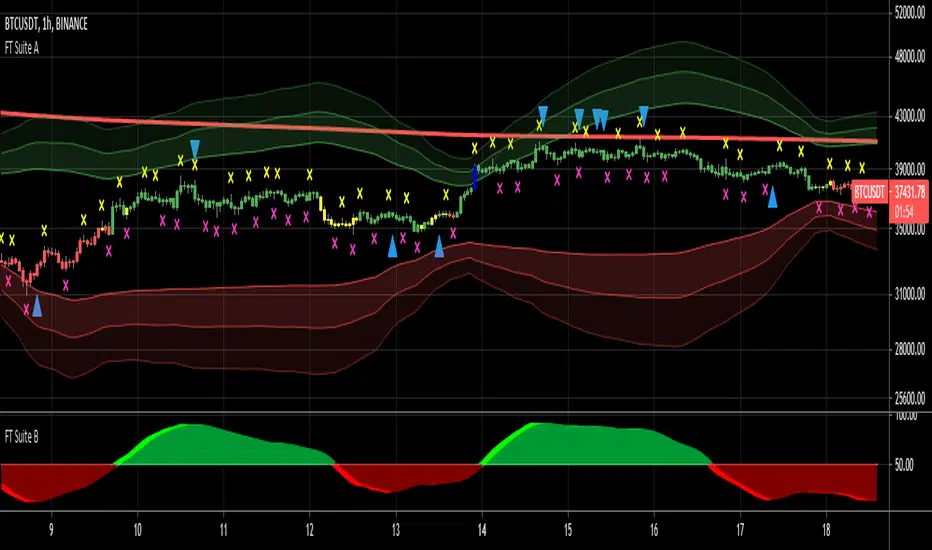
FieryTrading Suite AThis trading suite offers a complete package to traders, both long- and short-term. The idea here is that by combining FieryTrading Suite A and B, one can get a better grip on the markets, thus making more profitable trades. This trading suite is suited for all time frames and assets. Ideally one would combine this trading suite with their own strategies or indicators.
This indicator pack consists of several parts and offers quite some customization.
// FieryTrading Suite A
Bar Trend: the bars will get colored according to the current, short-term, trend. Green is bullish, red is bearish and yellow is neutral. By tweaking the Bar Trend Length one can make the bar trend more or less responsive. Higher lengths are better for long term trading, whereas a shorter length is better for short-term or scalping.
MTF EMA: this is actually two indicators in one. First, we have the EMA on the chart, which is a general current trend indicator. Above the EMA means bullish, under the EMA means bearish. This EMA is also colored according to the long-term trend, which gets pulled from a higher time-frame. Green means long term bullish, red long-term bearish, yellow neutral.
Overshoot Area: the green and red bands around the price are areas where the price might potentially reverse from. This works exceptionally well in consolidating (horizontal) markets. The wider the overshoot area, the stronger the trend. A very tight overshoot area might indicate that the price will soon make a strong move. Increase the overshoot length to make it better suited for long-term. Decrease the length for better detection of small moves.
Extra’s:
1) Extreme bars: when turned on, the bars will color blue if the price reaches a potential strong area of reversal or consolidation. Blue bars are also great areas to exit your current position. Increase the Extreme Multiplier in case you want it less responsive. Decrease the multiplier to quicker spot extreme bars, but with a higher margin of error.
2) FieryTrend: due to its popularity, I’ve decided to included my FieryTrend indicator in the Trading Suite. It’s a great tool to manually find trend lines, resistances and supports. See my FieryTrend indicator for more info.
3) Fractals: when turned on, this option will display fractals on the chart. These fractals are mainly used for stop-loss determination, but can be used for other strategies as well.
4) FT B Reversal: when turned on, this will place reversals of the FieryTrend Suit B on the chart. Make sure to keep the inputs of the FT B indicator the same on both the A and B suite. It might trigger some false-positives, don’t trade this blindly. Wait for the lighter color to completely disappear behind the darker one on FT B.
Alerts: Alerts can be created for Extreme Bars, Bar Trend and FieryTrading Suite B Reversals. Bar trend currently triggers an alert of every bullish / bearish bar, want to make it trigger once in the future, but I’m encountering an unknown bug.
// FieryTrading Suite B
This oscillator tries to give traders an idea of the current trend, as well as trend reversals. The higher the lengths, the bigger the potential trends can become. Be aware that higher lengths are less responsive to market movements. The default inputs are best for most traders. Alerts for this indicator can be made in the FT Trading Suite A, indicated by the blue up / down triangles.
// Potential strategies
There are several potential strategies that one can follow by just looking at the chart. Here are some examples:
1.0 For longer term trades one could simply trade the bar colors. Buy when the bar goes green, sell when it goes red.
1.1 You could exit the trade at either an Extreme Bar or when the price enters the Overshoot Area
1.2 During bullish trends (green bars, green MTF EMA), you could spot potential entries with the FieryTrading Suite B. Enter on every dip on the oscillator. Inverse would be true for shorts.
2.0 You could trade the FT B Reversals during their respective trend. So, trade bearish reversals during a red MTF EMA, bullish reversals during a green MTF EMA.
Never trade one indicator naked. Always use other indicators to confirm your bias.
For take-profit and stop-loss selection I would generally advise to look at the most recent fractal and place the stop above / below the fractal bar. Bullish trades should look at the pink fractal, bearish trades at the yellow fractal. When no fractal is available, look at the reversal bar and apply the same strategy.
For short term trades I’d advise a risk-reward of 1.5, longer term 2 – 2.5.
See the screenshots below for a couple of examples.
For access, please take a look at the "Author's Instructions" below.
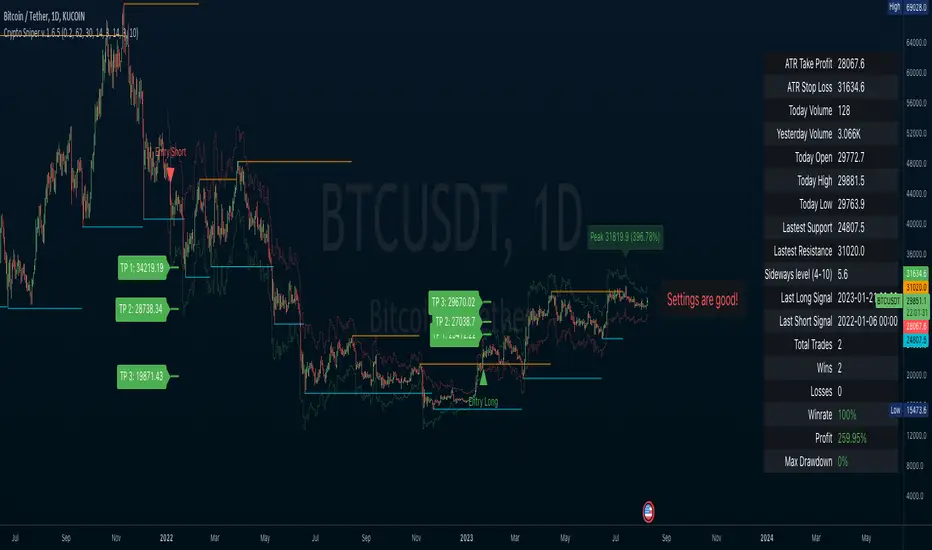
Crypto SniperAn easy to follow indicator for scalping or long term trades. You can add this indicator to other analysis as a complementary indicator or use it alone for entry and exit your trades.
Features
• Simple entry signals, buy the contract at the end of the signal candle
• Additional entry signals can be enabled to increase your position and your profits
• Get exit signals for your opened trades.
• Alert conditions for all entries, additional entries and exits
• Enable ATR plot of Take Profit and Stop Loss
• Customize your ATR settings to adapt the indicator to any market
This indicator use some analysis to get the bottom/top of the cycles. Any market or timeframe and can be used. Specially designed for scalping on cryptocurrency futures markets.
B&S v3.2This strategy uses RMA, Moving Average used in RSI , to create the buy and sell signals. It is the exponentially weighted moving average with alpha = 1/length.
IT SHOWS ON THE GRAPH:
Buy: Long position.
Sell: Short position.
V ⇣: Institutional volume .
V ⇡: Institutional volume .
T ⇣: Downtrend.
T ⇡: Uptrend.
Volume (V ⇣/V ⇡) when Market Makers moving smart money.
When 200SMA is above 100SMA (T ⇡) 200SMA is below 100SMA (T ⇣)
HOW TO USE?
If you are trading any asset that is in an uptrend, avoid shorting until the sign (T ⇣) appears followed by the Institutional Volume signal (V ⇣) indicating reversion.
If you are trading any asset that is in a downtrend, avoid long positions until the signal (T ⇡) appears followed by the Institutional Volume signal (V ⇡) indicating reversal.
For long operations use "🕗 360" setting for Daily timeframe.
For Day Trade use "🕗 30" for 1 hour or 30 minutes timeframe.

Trademinator Forex Quarters"Trademinator Forex Quarters" displays Institutional Hesitation Lines and Butter Zones on any USD or JPY currency pair chart.
The currency pair, timeframe and current trading price are automatically calculated by the indicator, so there's no need to apply any specific settings.
As an option, the quarter level that is applied to the chart by default, can be changed from automatic detection to any other quarter.
In order to analyze confluence among several timeframes, the indicator can be applied several times to the chart and then change the quarter level in the settings.
Quarter levels are referred to by the indicator as follows:
Mayor Whole (Daily)
Mayor Quarters (4H)
Minor Wholes (30 min)
Minor Quarters (5 min)
Forex Position Size CalculatorPosition size calculator for FOREX only!
Lotsize is calculated by using properties described below.
Properties:
- Show position size: Will only be visible on 5m - 15m - 60m chart
- Account Currency:
- Account Size: Between 0 and 10 000 000 units of currency
- Risk: Between 0 and 100%
- Stoploss: Between 0 and 200 pips
- Textcolor

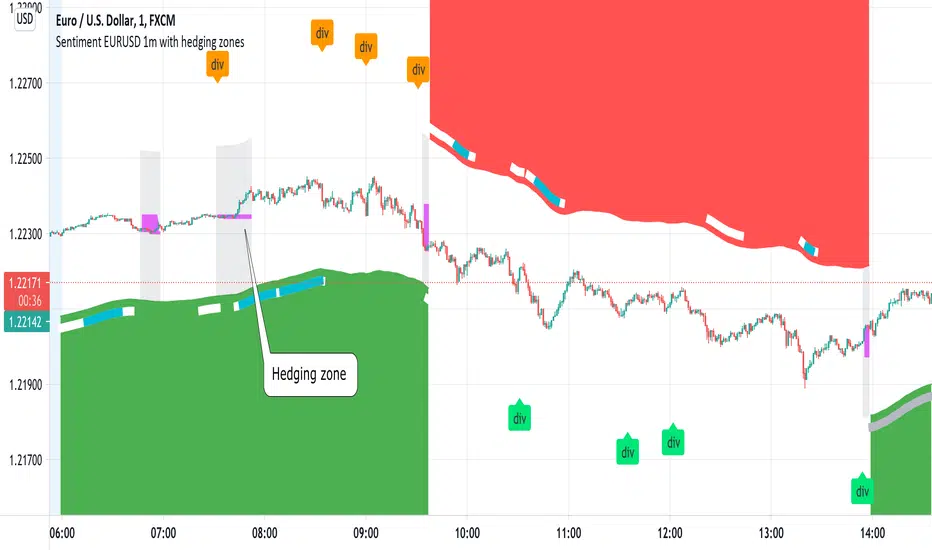
Sentiment EURUSD 1m with hedging zonesThis is a very specialised and optimized script, for 1m EURUSD traders - daytraders, scalpers.
1m trading is very difficult, but it can be also most profitable, if done right.
Why difficult? It is hard to detect market direction - usually when trend indicators reverse, that new trend is already over. One and the same indicator signal sometimes provides one outcome (for example reversal) and sometimes exactly the opposite (continuation). It requires deep understanding on WHEN to use which indicator and when to ignore signals. Set the parameters of your indicators to a very sensitive extent and they will keep changing direction back and forth - always being too late of course :) Set the parameters too losely, and you'll be late with entries 100% of times. Looking for universal trend-showing indicator? There is none...
This script is a result of 2 years of practical following EURUSD 1m market action. Looking at charts with MANUAL TRADER'S eyes. Analyzing all together: price action, indicators, zigzag, divergences, momentum, pivot points, support and resistance. On the one hand traders say only manual trading can be successful and on the other - to stick to one strategy and be automatic when applying to it. So this is it - automatic coding of market signals as if manual trader would do it. Forex is news-driven? Yes, it is. So if market sentiment changes because of some news happening, the script will quickly recognize it and suggest reversal.
Please note I'm not pretending to have a crystal ball. Nobody has. The goal of this script is not to predict where EURUSD market will be, but to correctly notice that is has reversed. Nothing else.
Sometimes the market will move towards reversal, but not cross the line yet - these are so-called HEDGING ZONES. Sometimes they turn out to be reversals and sometimes simply best places for dip entries. Ideally a trader should hedge there, because market could move either way. You might wanna apply apply knowledge of market fundamentals there or look into some micro-indicators. Anyway, it is good to realize where those zones are and this script shows them. In pink.
It is invite-only script. DM me for access.
Bollinger Bands and Floor Pivot pointsThe Bollinger bands set the standard deviation of the reversal points with smoothing over the specified period. That is, if you want to see the standard deviation of resistance and support on an hourly chart with a smoothing period for one day, then you need to set the period 24 in the settings. In this case, the pivot points always coincide with the chart.
The middle Bollinger band smooths out the pivot point, and the upper and lower bands-the resistance of r1 and the support of s1, respectively.
In the settings, you can set the smoothing of the standard deviation of the resistance and support of r2 and s2 instead of r1 and s1
example for working on the daily timeframe for the XRP/USDT cryptocurrency pair

PpSignal Super Smooth Move Average Improved V 1.0© 2013 John F. Ehlers Super Smooth Move Average Improved
In “Predictive And Successful Indicators” in this issue, author John Ehlers describes a new method for smoothing market data while reducing the lag that most other smoothing techniques have.
I applied an improvement to the formula that prevents the repainting of the color change, especially when chart is plotted for greater time intervals. This filter eliminates the noise completely, as opposed to moving averages, e.g., exponential (EMA) which only offers a modest attenuation effect.
Buy when the color is aqua-blue
Sell when the color is orange-red


Market analysis panel MAP DejaVuTradesThe market analysis dashboard allows you to view multiple markets simultaneously to make a quick and timely decision.
You can add up to 6 markets per panel between Forex, Cryptos, Stocks, Futures, CFDs, Indices, and comparing their current state in any different timeframe in which you are currently, selecting it from its configuration.
Below is the explanation of each column of the panel.
►Title: Select the name of your panel grouping by type of market.
►Bullish or bearish market: Reference of the selected time frame indicating a green progress bar when the market trend is bullish, and red when the market is bearish, with the strength percentage.
►Variation by temporality: Current relationship with the close of the previous candle, depending on the selected temporality. indicating you in a green progress bar when the variation is positive, and red when the variation is negative, with their respective percentage.
►Nominal volume: it is a multiplication of the current volume with the current price, its immediate relationship is from the marketcap of the selected market with its respective value.
To view the values, simply put the mouse over the progress bar.

BitcoinNinjas NINJASIGNALS V4 (Script)BitcoinNinjas NINJASIGNALS V4 (Script)
(for Cryptocurrencies, Forex, GunBot, ProfitTrailer, Autoview, CryptoHopper, manual or automated trading, and more)
This is version 4 of our Ninja Signals trading script, with accompanying backtesting strategy.
BitcoinNinjas NINJASIGNALS V4 (Strategy)
•Allows users to easily set automated buy/long and sell/short alerts on TradingView for use with automatic and manual trading of cryptocurrencies, Forex securities, and more (alerts are compatible with automatic trading software such as GunBot, ProfitTrailer, Autoview, CryptoHopper, and more).
•Synthesizes many powerful indicators [e.g., Relative Strength Index (RSI), Stochastic RSI, Money Flow Index (MFI), Moving Average Convergence Divergence (MACD), etc.) into one powerful script to generate very precise buy and sell signals in virtually all market conditions.
•Features user-defined adjustable calibration settings, allowing traders to customize the script to fit any currency / security on any exchange available through TradingView.com, simply by adjusting settings.
•Buy/Long arrows, Sell/Short arrows, & EMA trendline can be customized or hidden, if desired.
•Complete with backtesting strategy version of script which allows users to test various trading strategies based on the alerts the script generates (see information and screenshots below).
•Backtesting strategy features a user-defined adjustable date range, so traders can estimate performance of the script over specific periods of time, such as the last week, month, or year.
•Script and backtesting strategy feature many user-adjustable settings including stop loss and take profit alerts, an ‘only sell for profit’ option (Gunbot-specific), many different buy and sell filters, and more. Simply adjust the script settings and the backtesting results will automatically refresh.
•Backtesting strategy allows for pyramid buying to test various average down / dollar cost average trading strategies. Simply adjust the number of pyramid buys and the quantity of each buy.
•Fully compatible with margin and futures trading for any currency / security on TradingView.com.
DISCLAIMER: By using our BitcoinNinjas ‘Ninja Signals’ planning script, you agree to the BitcoinNinjas 'Terms of Use'. No sharing, copying, reselling, modifying, or any other forms of use are authorized for our documents, script / strategy, and the information published with them. This informational planning script / strategy is strictly for individual use and educational purposes only. This is not financial or investment advice. Investments are always made at your own risk and are based on your personal judgement. BitcoinNinjas is not responsible for any losses you may incur. Please invest wisely.

MasterChartsTrading Price Action Indicators-6.0These are upgraded MasterChartsTrading Price Action Indicators with future projections
---
How to understand price action.
It is very easy to read price action if you have a reference point. These support/resistance lines are there to help you read where the buyers and sellers are likely to make a stand.
You can also think of these indicators as moving pivot points .
MasterChartsTrading Price Action Indicators show good price levels to enter or exit a trade.
The Blue indicator line serves as a Bullish Trend setter.
If your instrument closes above the Blue line, we think about going Long (buying).
For commodities and Forex, when your trading instrument closes below the Red line, we think about Shorting (selling).
For Stocks, I prefer to use the Yellow line as my Bearish Trend setter (on Daily charts ). A stock has to close below the Yellow line first, then rally towards the Red line and top out there. This is where I would short it.

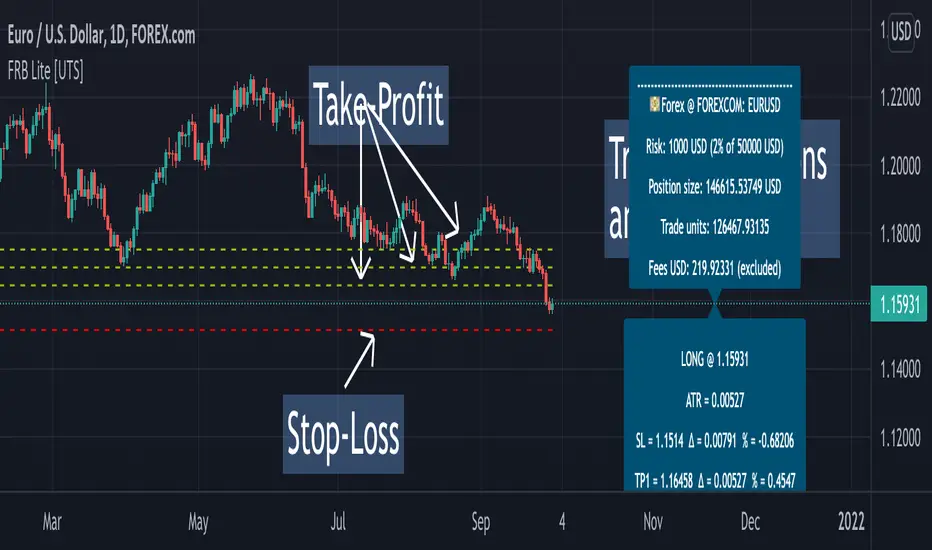
Forex Risk Buddy - Lite: Position Size, SL & TP System [UTS]Forex Risk Buddy - Lite
Position Size, Stop Loss & Take Profit System
The ultimate system to calculate trading risk on forex markets.
The 'Lite' version is limited to the EUR/USD forex trading pair.
💵 Forex
Position Sizing
De-risk possible drawdown by calculating a proper position size.
Define your risk percent based on your net value
Freely define your account currency
Trade any asset by the customizable Base / Quote currency factor
Calculate trading fees
Show all information on a customizable data screen
Stop Loss
Minimize trade risk by calculating your stop-loss.
Percent, Value and Delta display from current price
ATR based (Average True Range, modifiable)
Custom SL value possible
Adjustable
Two visual representations on chart
Automatically and real-time calculated on screen
Take Profit
Multiple take-profit levels to ensure not giving back to the market.
Up to 3 take profit levels to define
ATR based (Average True Range, modifiable)
Custom TP values possible
Easily customizable
Two visual representations on chart
Automatically and real-time calculated on screen
Currencies
Choose an account currency and calculate your risk for every trading pair.
USD
EUR
GBP
AUD
CAD
CHF
HKD
JPY
NOK
NZD
RUB
SEK
SGD
TRY
ZAR
BTC (crypto)
ETH (crypto)
USDT (crypto)
BUSD (crypto)
USDC (crypto)
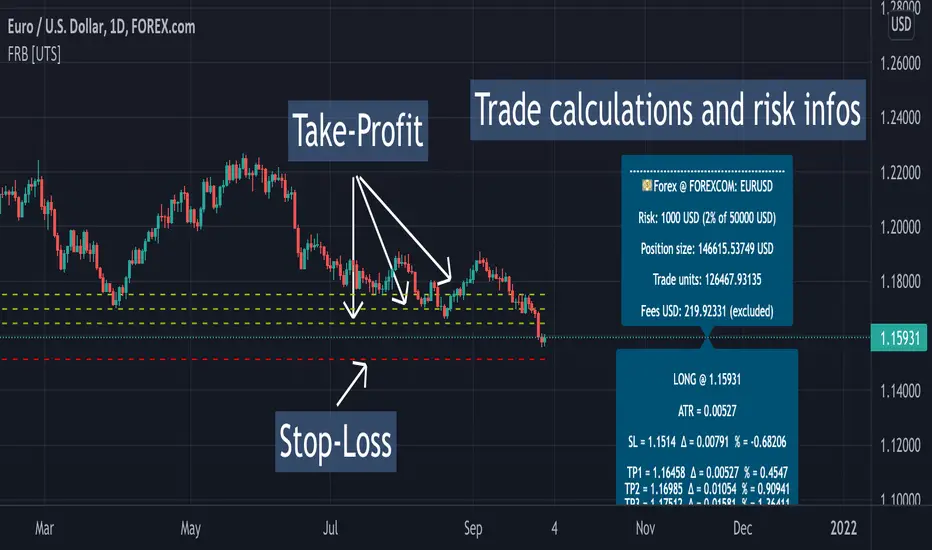
Forex Risk Buddy: Position Size, SL & TP System [UTS]Forex Risk Buddy
Position Size, Stop Loss & Take Profit System
The ultimate system to calculate trading risk on forex markets.
💵 Forex
Position Sizing
De-risk possible drawdown by calculating a proper position size.
Define your risk percent based on your net value
Freely define your account currency
Trade any asset by the customizable Base / Quote currency factor
Calculate trading fees
Show all information on a customizable data screen
Stop Loss
Minimize trade risk by calculating your stop-loss.
Percent, Value and Delta display from current price
ATR based (Average True Range, modifiable)
Custom SL value possible
Adjustable
Two visual representations on chart
Automatically and real-time calculated on screen
Take Profit
Multiple take-profit levels to ensure not giving back to the market.
Up to 3 take profit levels to define
ATR based (Average True Range, modifiable)
Custom TP values possible
Easily customizable
Two visual representations on chart
Automatically and real-time calculated on screen
Currencies
Choose an account currency and calculate your risk for every trading pair.
USD
EUR
GBP
AUD
CAD
CHF
HKD
JPY
NOK
NZD
RUB
SEK
SGD
TRY
ZAR
BTC (crypto)
ETH (crypto)
USDT (crypto)
BUSD (crypto)
USDC (crypto)
Matrix Series and Vix Fix with VWAP CCI and QQE SignalsBased on @ChrisMoody Williams_VIX_Fix and @glaz Matrix Series .
This indicator identify potential zone of reversal according to momentum and volatility.
Includes VWAP CCI and QQE Signals.

[astropark] Volume AnalyzerDear Followers,
today another awesome Analysis Tool, that you can use for day scalping: Volume Analyzer !
This indicator
works on every market, pair and timeframe
lets you see analysis of a different timeframes using the resolution parameter
has an optional trend colored background (I suggest to disable it if you use a different resolution)
integrates a tape profit strategy based on RSI (you can config it and enable/disable it)
lets you setup alarms on bull/bear signal as well as on TP RSI-based signals
I prefer to use this indicator in my day trading on low timeframes , like 5m - 15m - 1h, as you can have access to a more detailed volume information, but it works on high timeframes too as you can see in examples at the bottom of the description.
I truly think that Volume says a lot about future price action, as stated in my Cumulative Volume Delta (CVD) indicator, which you can find here below:
In this indicator, I'm much more interested in the bullish or bearish effect of volume generated by traders and following price action.
Be sure to understand that at current status this is not a complete automated strategy, but an analysis tool which aims to give you a positive bias, a profitable hedge in your trading journey.
As I always say, all tools are great if you use them correctly: this is not the "Holy Grail", so always use proper money and risk management strategies.
This indicator quite often calls bottoms and tops , most of the times it announces a coming reversals , sometimes it fails too of course.
Check this screenshot to have a clear idea of what I'm talking about:
You are supposed to discard signals of the same type that comes later and at a worse price (related to the trend) or you can use to re-fill your still-open position, using it as a re-entry.
You are supposed to act at first signals and average up/down if price goes against you when a new bear/bull signal appears at a better price.
Here it is another element you must consider: price action can deny a reversal stated by volume analysis .
In these cases, you must apply a stop loss in your trade and reverse your position. Don't average up/down your entry.
The reason in this screenshot below:
As you can see, the local downtrend was broken, as it was a simple pullback, previous bull trend was restored and price went up a lot!
The indicator here detected bears rejecting the run-up as much violently as they could, but that was a pullback, nothing more than that: main bull trend was still intact.
Another important advice: don't be greedy, always remember to take profits ! Avoid turning a winning trade into a losing one, which is a common mistake traders do.
That's why I decided to include an RSI based Take Profit algorithm inside:
when background is colored by green (and you can't see any bull signal), then you are in over bought region: start taking profits on you buy/long position or close it or set a trailing stop or a stop loss in profit!
when background is colored by red (and you can't see any bear signal), then you are in over sold region: start taking profits on you sell/short position or close it or set a trailing stop or a stop loss in profit!
when price is in a big overbought or oversold region, then you can see a "ob" label or a "os" label respectively
if you are in a bullish trend (you can see it from the trend colored green background as last signal was a "bull" one), "ob" becomes a clear "tp" - Take Profit advice
if you are in a bearish trend (you can see it from the trend colored red background as last signal was a "bear" one), "os" becomes a clear "tp" - Take Profit advice
Here some examples how you can use the signals produced by the indicator in order to be a successful trader.
I circled with pink signals you as supposed to take, then with a "$" pink backgrounded region where you are supposed to take profits, I finally put an X on failing signals, where you would theoretically have been stopped-out.
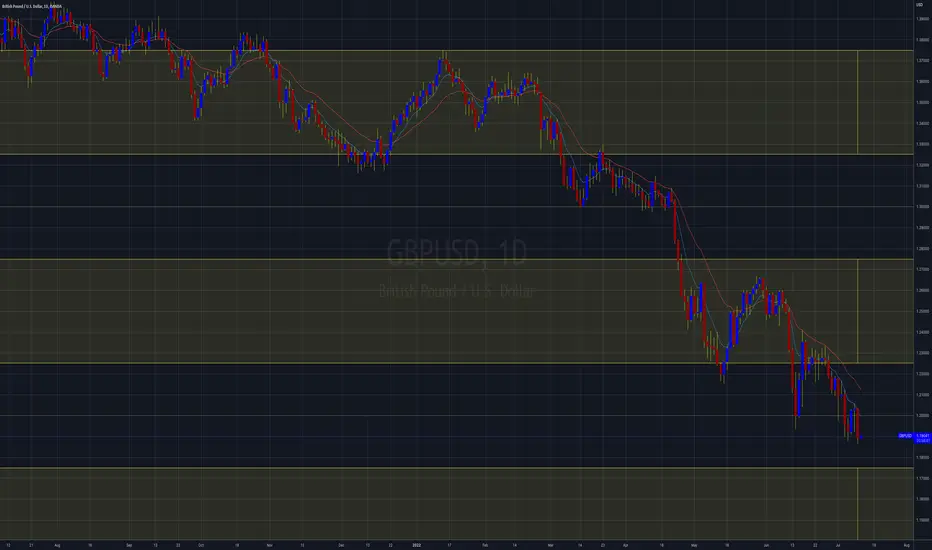
GBPUSD, 15m
ETHUSD, 1h
TSLA, 5m
BTCUSD, 15m
XAGUSD, 1h
EURUSD, 15m
SPX500, 1h
ETHUSD, 1D
ETHBTC, 6h
This is a premium indicator , so send me a private message in order to get access to this script.
