RR 2
Software signal with Trend of the market/Central Pivot Range combined with RR1 for better results.
Forex

RR 1
Software signal with Pivots/Previous day high/Previous day low combined with RR2 for better results.
FairValueGap FVGWhat is a Fair Value Gap or a Gap?
There may be different explanation or reasons of gaps In Forex, my knowledge says that gaps are not very common and they are filled when ever market gets an opportunity to fill. I am trying to figure out the fair Value gap through this indicator.
Gaps are sharp breaks in price with no trading occurring in between. Gaps can happen moving up or moving down. In the forex
market, gaps primarily occur over the weekend because it is the only time the forex market closes. Gaps may also occur on very
short timeframes such as a one-minute chart or immediately following a major news announcement.
How I calculated the gaps Value?
Calculation Method of Gap used is when (low_bar(current bar)-high_bar(two bars back))>0 and (low_bar(two bars back)-high_bar(current bar))>0
The gaps are represented by the Orange and Lime color Bar height.
Do the gaps need to be filtered?
This is the most important part according to me.
Yes, the gaps need to be filtered, Since there are may gaps one after another ,In This Indicator i have used a logic to filter out unnecessary Gaps.
you will be seeing only major Important gaps which you need to focus on.
How gaps Helps?
Gaps sometimes result in corrective price action. In other words, after the gap occurs prices have a tendency to reverse and “fill” the gap.
This is what is look for.
How to use the setting of the indicator and what do they represent?
This indicator setting has 4 options
1.plot major Filtered FVG of Bullish Candles
When you check this option all major FGV will be filtered based on my logic of filtering the gaps
2.plot major Filtered FVG of Bearish Candles
When you check this option all major FGV will be filtered based on my logic of filtering the gaps
3.Plot Bar size representing the GAPS
The bars(lime and orange color) in front of candle bars are the size of the gap.
4.Plot Lines representing the GAPS
You can also visualize the recent gaps through lines , you will be able to see only 3 to 5 recent gaps through line.(not able to plot
all gaps through line because of the limit, so gaps are represented by the orange and lime color bars)
You can also change the resolution in setting of the indicator to get different time frame FGV.
Thanks to mickey1984 for guiding and helping for this concept idea.
Have any question Feel free to ask?

[astropark] price levelsDear Followers,
today another awesome Analysis Tool, that you can use in your trading journey: Price Levels !
Are you a range trading player? a scalper? or maybe a day-trader or a swing-trader? This is for you then. Indeed it's for everyone.
This indicator works on every timeframe, market and pair.
It keeps track of recent important levels generated by price action:
Monday high, low and middle range level
Tuesday high and low
Wednesday high and low
Thursday high and low
Friday high and low
Weekly open, high and low
Monthly open, high and low
Yearly open, high and low
Previous weekly open, high and low
Previous monthly open, high and low
Previous yearly open, high and low
You can:
choose price levels to hide and show
change each level color / thickness / display style (solid or dotted)
choose to show or hide price labels and change their size
Why such indicator should be helpful? How can I use it to do profit?
In multiple ways! Let's talk about Monday Range :
when Monday range is formed, price acceptance below Monday low is a bearish signal, so will more likely want to short / sell
equally price acceptance above Monday high is a bullish signal, so will more likely want to long / buy
it can happen that Monday high is simply retested, with price not being able to stay above it: this is called a retest (in case of a simple wick) or a deviation (in case of price staying above the level just for some candles) and what usually happens is price falling back to Monday middle range level and even back to Monday low.
the opposite can happen of course: you will become bullish if Monday low is tested or a deviation appears below Monday low: price tends to bounce on such occasions back to Monday middle range or even Monday high
Tuesday is usually a marker day within a trading week:
if Monday was pretty bullish, Tuesday high may mark the weekly top, following some red days
if Monday was pretty bearish, Tuesday low may mark the weekly bottom, following some green days
Thursday is the day when big players start to take profits, as the trading week is going to end the next day, so in an all-green week Thursday may be a red one, while in an all-red week it may be a bullish day
Thursday is the day when big players start to take profits, as the trading week is going to end the next day:
in an all-green week, Thursday may be a red one and it's low tends to mark the weekly low
while in an all-red week, it tends to be a bullish day, so here you will refill your shorts for the next blooding day
Let's talk now about the Weekly, Monthly and Yearly price levels : here it is the interesting part for Swing Traders
Weekly open is usually a defining level: on retest, if price keeps staying below then more downside is expected, if price keeps staying above then more upside is expected (similarly to what we said about Monday high and low)
Monthly and Yearly open price levels are usually a "no-brainer" buy level in a bullish trend or equally a sell level in a bearish trend: in this scenarios, a deviation structure is even more powerful in term of price reaction and efficiency
We trade Weekly, Monthly and Yearly high and low price levels as explained for the Monday high and low, but with a swing traders perspective (so a medium-long term trade)
Previous Weekly/Monthly/Yearly price levels are usually very useful as targets in your trades
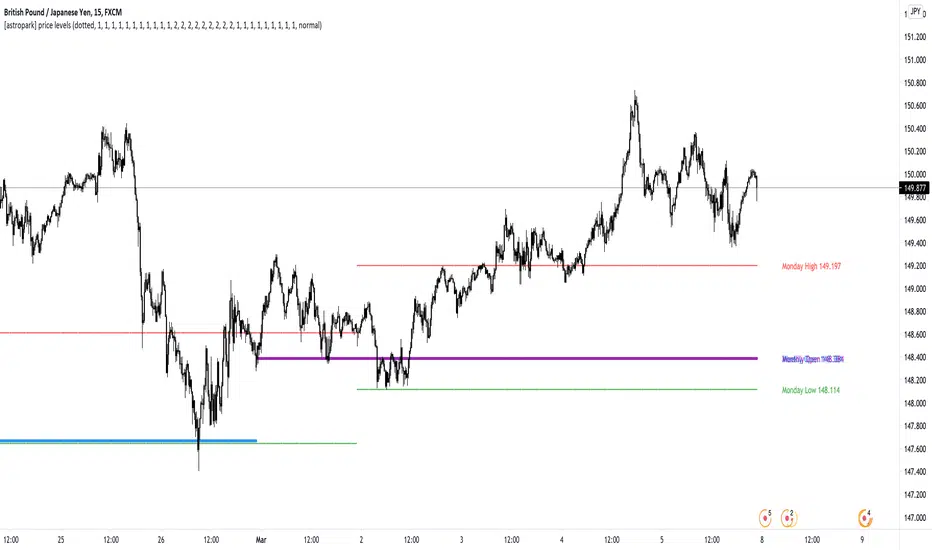
Here below some screenshots that resumes what said above.
Weekly Open as support (bullish) and Monday High deviation (bearish)
Tuesday High, Weekly Open failing as support: bearish
Monday Low deviation (bullish)
Price Acceptance above Monday High and Weekly Open (bullish)
Yearly Open retests as buy opportunities
Deviation below Monthly Open (bullish), Price Acceptance below Monthly and Yearly Open (bearish)
This is a premium indicator , so send me a private message in order to get access to this script.
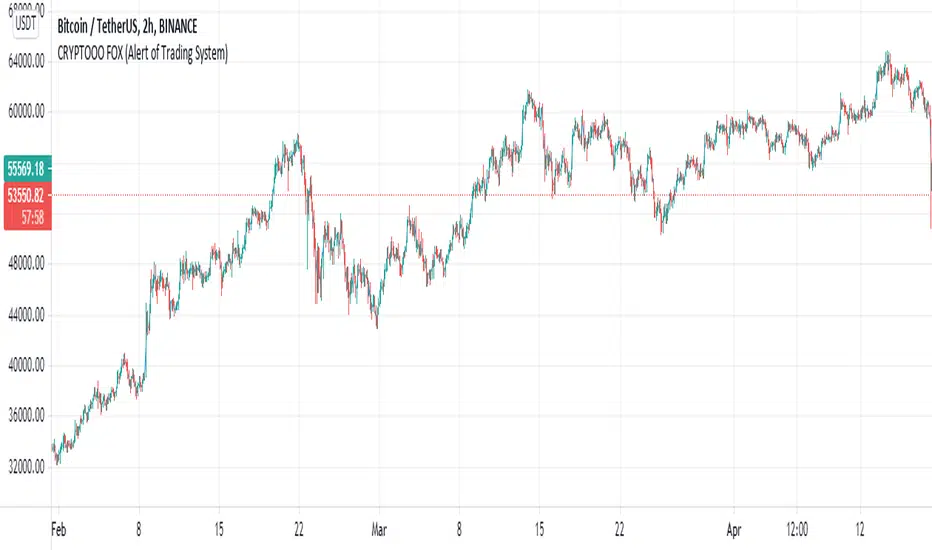
CRYPTOOO FOX (Alert of Trading System)CRYPTOOO FOX (Alert of Trading System) .
---DISCRIPTION---
How Indicator Work :
--Indicator is working on higher time frame so i use two high time frame
the higher is ( 2 H or 3 H or 4 H or 8 H or 12 H or Daily ) and the highest is ( Daily ) Time frame .
-- When the higher time frame cross over the Daily time frame( the Highest ) this mean the TREND and
the PRICE also going UP this strategy is going to long position ( Buy position ) .
-- When the higher time frame cross under Daily time frame( the Highest ) this mean the TREND and
the PRICE also going DOWN strategy going to ( close position ) .
-- Notes :
--Indicator use some averages to calculate the higher time frame .
--Indicator use parabolic indicator to filter entries which name is ( Filter )
--Indicator use one more candle close to confirm entry ( Filter 2 )
--This the best time frame ( HIGHER , HIGHEST ) in this strategy in profit and draw down .
--Indicator is working only in Long position i am not recommend to use it in short positions .
--THIS IS NO REPAINT Indicator .
--DON'T use it in DAILY time frame
--I recommend so mush to use take profit and stop loss although the low draw down but some time
the market have a huge movements .
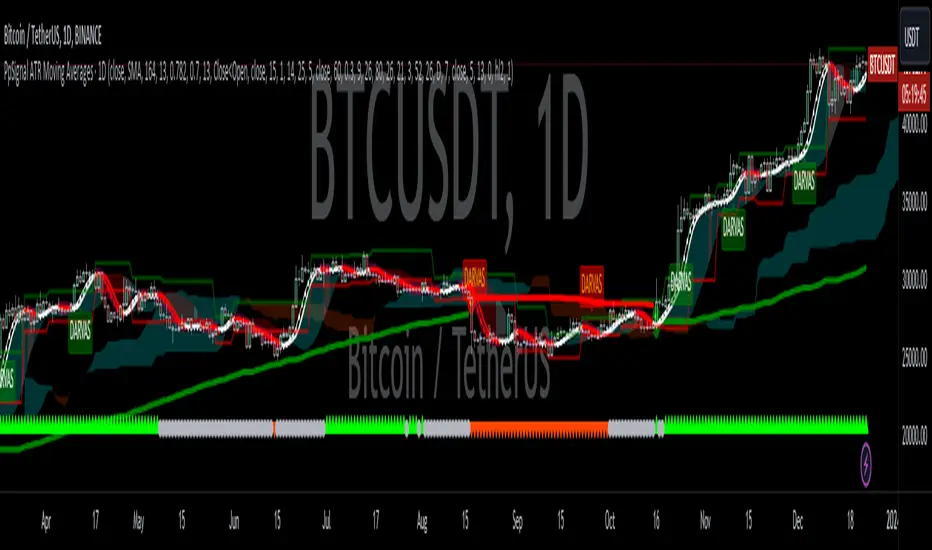
PpSignal Money Flow Index
What Is the Money Flow Index (MFI)?
The Money Flow Index (MFI) is a technical oscillator that uses price and volume data for identifying overbought or oversold signals in an asset. It can also be used to spot divergences which warn of a trend change in price. The oscillator moves between 0 and 100.
Unlike conventional oscillators such as the Relative Strength Index (RSI), the Money Flow Index incorporates both price and volume data, as opposed to just price. For this reason, some analysts call MFI the volume-weighted RSI.
KEY TAKEAWAYS
The Money Flow Index (MFI) is a technical indicator that generates overbought or oversold signals using both prices and volume data.
An MFI reading above 80 is considered overbought and an MFI reading below 20 is considered oversold, although levels of 90 and 10 are also used as thresholds.
A divergence between the indicator and price is noteworthy. For example, if the indicator is rising while the price is falling or flat, the price could start rising.
Money Flow Index=100−
1+Money Flow Ratio
100
where:
Money Flow Ratio=
14 Period Negative Money Flow
14 Period Positive Money Flow
Raw Money Flow=Typical Price * Volume
Typical Price=
3
High + Low + Close
When the price advances from one period to the next Raw Money Flow is positive and it is added to Positive Money Flow. When Raw Money Flow is negative because the price dropped that period, it is added to Negative Money Flow.
How to Calculate the Money Flow Index
There are several steps for calculating the Money Flow Index. If doing it by hand, using a spreadsheet is recommended.
Calculate the Typical Price for each of the last 14 periods.
For each period, mark whether the typical price was higher or lower than the prior period. This will tell you whether Raw Money Flow is positive or negative.
Calculate Raw Money Flow by multiplying the Typical Price by Volume for that period. Use negative or positive numbers depending on whether the period was up or down (see step above).
Calculate the Money Flow Ratio by adding up all the positive money flows over the last 14 periods and dividing it by the negative money flows for the last 14 periods.
Calculate the Money Flow Index (MFI) using the ratio found in step four.
Continue doing the calculations as each new period ends, using only the last 14 periods of data.
What Does the Money Flow Index Tell You?
One of the primary ways to use the Money Flow Index is when there is a divergence. A divergence is when the oscillator is moving in the opposite direction of price. This is a signal of a potential reversal in the prevailing price trend.
For example, a very high Money Flow Index that begins to fall below a reading of 80 while the underlying security continues to climb is a price reversal signal to the downside. Conversely, a very low MFI reading that climbs above a reading of 20 while the underlying security continues to sell off is a price reversal signal to the upside.
Traders also watch for larger divergences using multiple waves in the price and MFI. For example, a stock peaks at $10, pulls back to $8, and then rallies to $12. The price has made two successive highs, at $10 and $12. If MFI makes a lower higher when the price reaches $12, the indicator is not confirming the new high. This could foreshadow a decline in price.
The overbought and oversold levels are also used to signal possible trading opportunities. Moves below 10 and above 90 are rare. Traders watch for the MFI to move back above 10 to signal a long trade, and to drop below 90 to signal a short trade.
Other moves out of overbought or oversold territory can also be useful. For example, when an asset is in an uptrend, a drop below 20 (or even 30) and then a rally back above it could indicate a pullback is over and the price uptrend is resuming. The same goes for a downtrend. A short-term rally could push the MFI up to 70 or 80, but when it drops back below that could be the time to enter a short trade in preparation for another drop.
The Difference Between the Money Flow Index and the Relative Strength Index (RSI)
The MFI and RSI are very closely related. The main difference is that MFI incorporates volume, while the RSI does not. Proponents of volume analysis believe it is a leading indicator. Therefore, they also believe that MFI will provide signals, and warn of possible reversals, in a more timely fashion than the RSI. One indicator is not better than the other, they are simply incorporating different elements and will, therefore, provide signals at different times.
We added T3 Move average to determine more accurate entries.
Standard deviation band To visualize volatility, the thinner or more the bands join, the more volatility the price force has.
Wee added Buy and sell signal when the price broke the superior volatile band is buy and when the price broke de lowe band is selling.

V2_Major_Trend_FinderThis script is a major trend following script. The calculations use Keltner Channels, moving averages and RSI.
The indicator is simple to follow:
Green Candlesticks indicate more bullish momentum expected
Red Candlesticks indicate more bearish momentum expected
blue dots are possible long ideas due to RSI oversold
Orange dots are possible short ideas due to RSI overbought
olive line is a one year moving average
The script is open for those looking for deeper understanding of the script.
Many Regards
Sulaiman

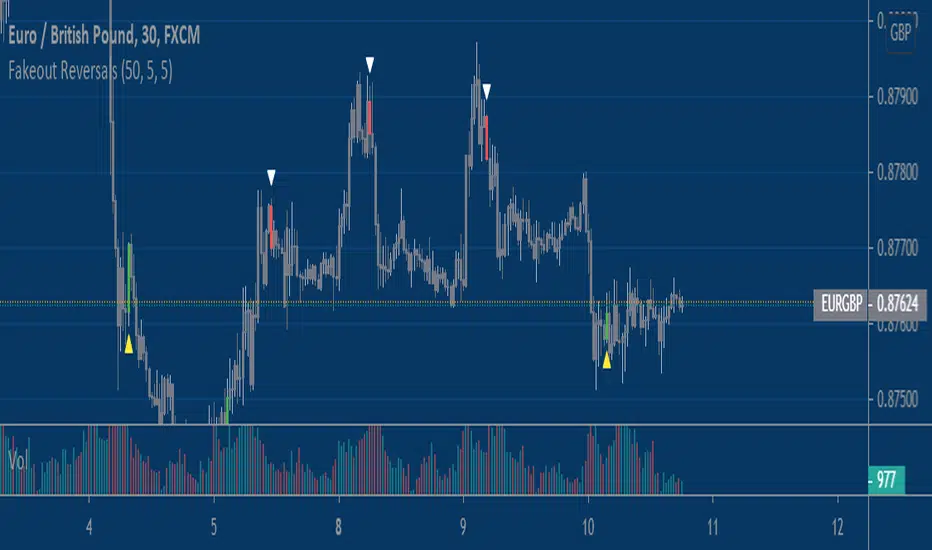
Fake-out ReversalsThis script combines two simple concepts, stop running and short term momentum, into a simple visual signal that can be applied to any market and any timeframe with some adjustment. It looks for price to violate a prior extreme within a certain lookback window, followed by price triggering a momentum filter that helps put the proverbial 'wind at your back' for the user. Users have the ability to customize three inputs; 1) Bars used to calculate price extremes 2)Bars since price violated that extreme 3)The sensitivity of the momentum filter.
You will find that these signals work best in choppy and rangebound price action, less so in trending/grinding markets. For entertainment/educational purposes only.
Enjoy!
PpSignal Ichimoku Kinko HyoWhat is the Ichimoku Kinko Hyo?
The Ichimoku Kinko Hyo, or Ichimoku for short, is a technical indicator that is used to gauge momentum along with future areas of support and resistance. The all-in-one technical indicator is comprised of five lines called the tenkan-sen, kijun-sen, senkou span A, senkou span B and chikou span.
Understanding Ichimoku Kinko Hyo
The Ichimoku Kinko Hyo indicator was originally developed by a Japanese newspaper writer to combine various technical strategies into a single indicator that could be easily implemented and interpreted. In Japanese, "ichimoku" translates to "one look," meaning traders only have to take one look at the chart to determine momentum, support, and resistance.
Ichimoku may look very complicated to novice traders that haven't seen it before, but the complexity quickly disappears with an understanding of what the various lines mean and why they are used.
The Ichimoku indicator is best used in conjunction with other forms of technical analysis despite its goal of being an all-in-one indicator.
Ichimoku Kinko Hyo Interpretation
There are five key components to the Ichimoku indicator:
Tenkan-sen: The tenkan-sen, or conversion line, is calculated by adding the highest high and the highest low over the past nine periods and then dividing the result by two. The resulting line represents a key support and resistance level, as well as a signal line for reversals.
Kijun-sen: The kijun-sen, or base line, is calculated by adding the highest high and the lowest low over the past 26 periods and dividing the result by two. The resulting line represents a key support and resistance level, a confirmation of a trend change, and can be used as a trailing stop-loss point.
Senkou Span A: The senkou span A, or leading span A, is calculated by adding the tenkan-sen and the kijun-sen, dividing the result by two, and then plotting the result 26 periods ahead. The resulting line forms one edge of the kumo - or cloud - that's used to identify future areas of support and resistance.
Senkou Span B: The senkou span B, or leading span B, is calculated by adding the highest high and the lowest low over the past 52 periods, dividing it by two, and then plotting the result 26 periods ahead. The resulting line forms the other edge of the kumo that's used to identify future areas of support and resistance.
Chikou Span: The chikou span, or lagging span, is the current period's closing price plotted 26 days back on the chart. This line is used to show possible areas of support and resistance.
Example of an Ichimoku Kinko Hyo Chart
The following is an example of an Ichimoku indicator plotted on a chart:
Indicator component
Alarm
Have alarm when price and Chicouspan cross Kumo cloud.
Have Alarm when tekn Sen 9 cross Kijusen 26.
Have Hiken ashi buy and sell alarm
Other tools
Mtf cloud.
[astropark] Trend Skywalker V1 [alarms]Dear Followers,
today another awesome Swing and Scalping Trading Strategy indicator: Trend Skywalker !
It shows a trend cloud that reacts very fast to price action, so it's perfect for trending markets: it helps a lot to find out
when a trend is going to end and a new is going to start
when to enter again within a trending market
where to put your stoploss
In this example below you can see the three points above:
In fact in a trending market it will highlight that:
price consolidation within the could is a trend weakening signal , so you can easily spot when a trend is going to end and a new is going to start
bullish/bearish trend cloud retests are nice opportunity to re-enter within a trending market, especially if cloud is thick
where to put your stoploss ( below the cloud and/or recent low in a buy scenario , above the cloud and/or recent high in a sell scenario )
This strategy/indicator has the following options:
change analysis window (the lower, the more reactive; the higher, the less reactive)
enable/disable signals on chart
enable/disable "more confirmations" signals filter
enable/disable bars and background coloring based on trend
enable/disable an automatic Trailing Stop strategy option (Automatic Stops)
enable/disable a peak profit tracker (the max percentage profit labels)
enable/disable highlights of trend cloud retests
enable/disable highlights of trend cloud price breakouts
Here below some examples how the indicator works on many markets and timeframe.
ETH/USD 4h
EUR/USD 15m
LTC/BTC 1h
This strategy only trigger 1 buy (where to start a long trade) or 1 sell (for short trade).
Keep in mind that proper risk management and money management strategies are very important to manage your trades (DM me if you need any clarification on these points).
This script will let you set all notifications you may need in order to be alerted on each triggered signals.
The one for backtesting purpose can be found by searching for the astropark's "Trend Skywalker" and then choosing the indicator with "strategy" suffix in the name, or you can find here below:
This is a premium indicator , so send me a private message in order to get access to this script.

Ehler Fisher applied on distance EMAThis is an improved version of Fisher, which use as a source the distance from EMA , compared to the initial source which was on the close of a candle.
It can be used in any market, any time frame .
For conditions we have multiple conditions for the logic, in this case initially if our fisher is above 0 is a long direction ,if its belowe 0 its a short direction.
Also we can improve this condition even further, in this case if we cross up our previous line its a buy signal, and if we cross down its a sell signal.
For best usage combine the cross together with the position of fisher respecting the 0.
If you have any other questions, let me know with a private message.

Price in BitcoinHi folks,
This script simply converts the price of assets from USD to bitcoin and displays that price in a separate chart. Currently, only assets quoted in USD will work but I will add more currencies in the future.
Use:
1. Make sure the asset you're viewing is quoted in USD or USX. To check, hover over the symbol on the top left part of the chart, click the "More" ellipsis and select "Symbol Info". The currency will be among the info displayed.
2. Apply the script and view the chart at your own risk.
Math:
price(btc) = (x/usd) / (btc/usd)
Cheers!
Jared

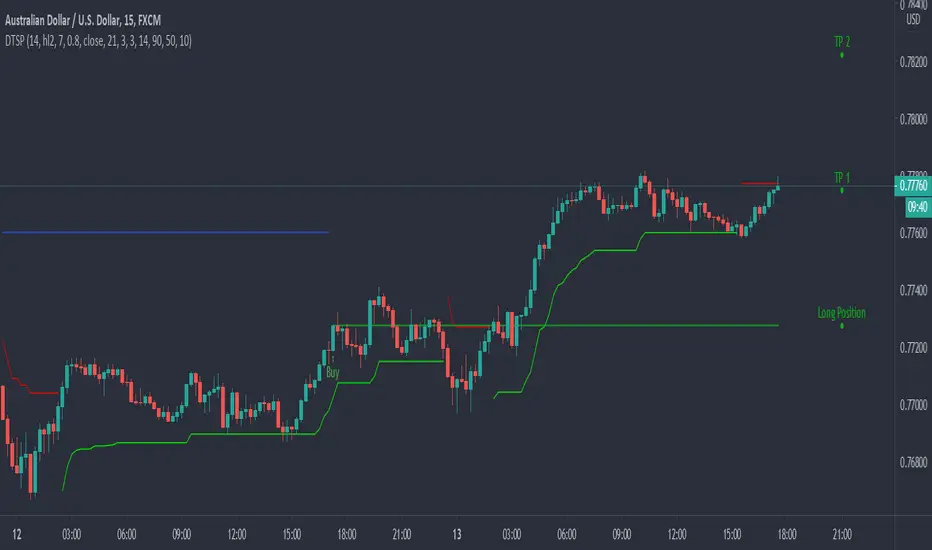
Dynamic Take Profit & Signals (AussieBogan)Dynamic Take Profit & Signals (DTS) help us to dynamically place potential take profit levels. These levels are measured based on standard deviation in conjunction with swing high and low points. Head over to the settings to control your take profit and multiplicative factor setting.
In short, higher values of either setting will return more spread out between tp's. The logic behind using the standard deviation is that a low value of it will return tp closer to where you entered the trade, as such it will have higher chances of the price reaching them.
The Indicator also has alert features for buy and sell so any trader can be aware of every potential signal the indicator produces.
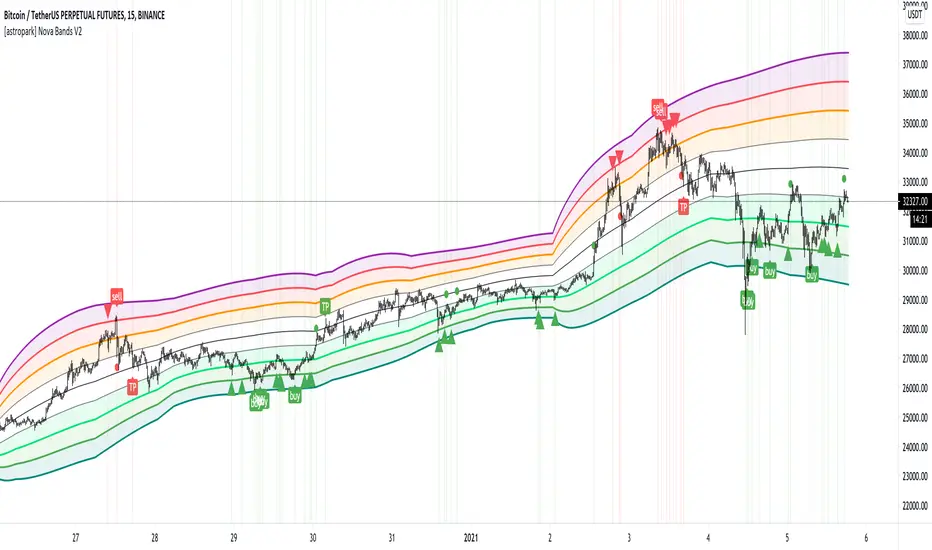
[astropark] Nova Bands V2Dear followers,
today an upgraded version of Nova Bands indicator, here below the previous V1
This is a great analysis and scalping tool for day trading on low timeframes (5-15 minutes) or to plan swing trades on hourly timeframes. It can be used also on high timeframes just for analysis current market trend.
The indicator plots a series of levels which create a nice bands flow.
The slope of levels make you easily understand when price is in consolidation, in uptrend or in downtrend.
The golden rule is always the same: buy low and sell high .
This indicator plots:
3 "price is low here" levels (from dark green to light green)
3 "price is average here" levels
3 "price is high here" levels (from purple to orange)
You can find more details on how to use the indicator in the description of V1.
Please, always remember that:
when bands are flat, price is in consolidation and this is best condition to trade with nova bands
when bands get nearer and nearer is called "Bands Squeeze": price is next to a main breakout move, volatility is coming!
The basic improvement in V2 is a different way to calculate the bands based on different timeframe resolution, default is setup to daily timeframe for example.
A trader who wants to be a winner must understand that money and risk management are very important, so manage your position size and always have a stop loss in your trades.
This is a premium indicator , so send me a private message in order to get access to this script.
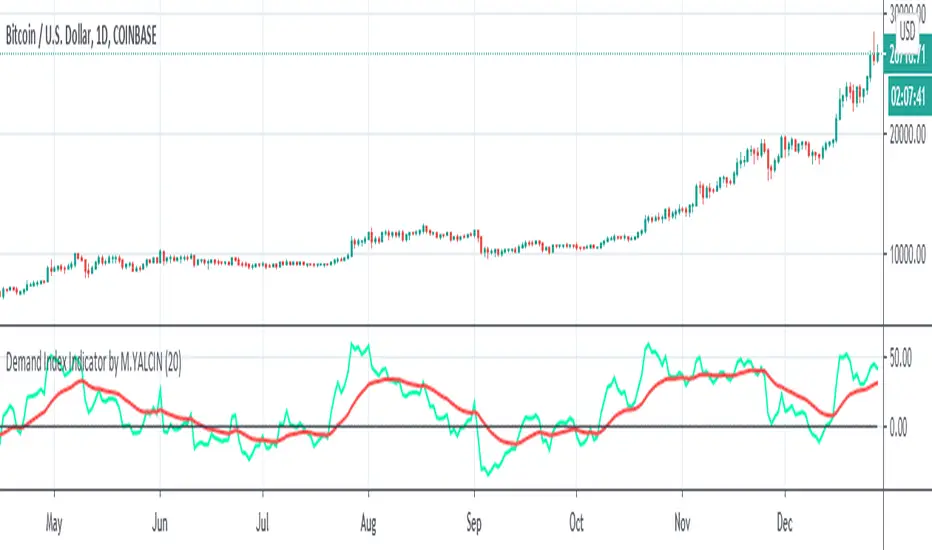
Demand Index Indicator by M.YALCINThe Demand Index is a complex technical indicator developed by James Sibbet that utilizes over 20 columns of data to measure the ratio of buying pressure to selling pressure. James Sibbet established six rules for using Demand Index:
1.A divergence between the Demand Index and price is a bearish indication.
2.Prices often rally to new highs following an extreme peak in the Demand Index.
3.Higher prices with a low Demand Index often indicate a top in the market.
4.The Demand Index moving through the zero line suggests a change in trend.
5.The Demand Index remaining near the zero line indicates weak price movement that won’t last long.
6.A long-term divergence between the Demand Index and price predicts a major top or bottom.
This indicator differs from other demand index indicators on this site in terms of indicator values. However, I think the low number of zigzags highlights this style. On the other hand, I think important points in terms of trading are added to the indicator: 1) According to many observations, the moments when this indicator crosses the zero line are interpreted as buy signals, and vice versa as a sell signal so the 0 line is shown. 2) Again, according to many observations, when the indicator crosses up its own 20-day (bar) exponential moving average is interpreted as a buy signal, and vice versa as a sell signal. Happy New Year ... NOTE: All these ideas do not contain financial advice.
Analog/Digital World Clock by DGTWorld Clocks - something for fun
Happy New Year!
ps: in case no update on the charts then the clock will not update too and will lag or stop till a new update is received

PpSignal Impulse V1.20PpSignal impulse is based on the concept of relative strength index, Rsi its acronym in English.
Although the calculation is similar, it differs in how the force is calculated. To calculate the force we are based on the analysis of the trend through a WMA.
It is important to clarify that you must do a prior analysis of the asset that you are going to trade, such as resistance supports, channels, chart formations, etc.
Buy when the sign is white.
Sell when the signal is red.
You can also perform buy or sell boosts if you activate impulse 2 and 3.

PpSignal Haiken Ashihere is the development of ppsignal Heiken Ashi with a formula of ours.
It also has a Smooth move average.
When HA this green is buying, when red is selling... simple entry system for scalping.
Enjoy it

BE - Volume v2.8Volume´s Indicator Draft
Intend to determinate the volume strengh (whales movements) for comodities and forex
Defaults Set for a regular Volume indicator
Not so Obvious Inputs...
AV = Absolute values (if not, show as negatives, weak´s vol movements)
MA Source = Volume, Positive Vol, Negative Vol. (Identifies Upcommings Price changes)
As already said..
Its a Draft, comments will be appreciated

Forex Breakout AlertThe indicator plots breakout events of user-defined Forex list, providing alert setting for breakout events.
Any big trend begins with a couple of price breakouts. By watching breakout events, we overlook the panorama of the whole market.
---------- Features --------------
User-Defined Forex Asset List, Up To 30 Assets
User-Defined Breakout Threshold
Accessible for wide timeframes: 1m - 1 Month
Plot the Breakouts History of whole market
Progressive color according to the strength of the breakthrough
--------- Indicator Settings -----------
"Show Bull or Bear?": To show Bull Breakout, Bear Breakout or Both
"User-Defined Breakout Threshold": User can defined the threshold of breakout, default value 999 means using default setting
"Use Green for Bull? ": Toggle color for Bull, defval: true, if your region use red for bull, toggle it.
"Exchange": Your exchange name, which is used to defined tickerid, defval="", optional - can be empty
"Asset PostFix": postfix of your asset symbol, which is used to define tickerid, defval="", change it if necessary
---------- Versions Description ----------
The features may change later without advance notice.
DEMO version has basic features.
---------- Access to Indicators ----------
Contact the author by Private Chat for access to Invite-Only versions and a trial.
---------- Install Invite Only Version----------
Open the chart -> Add Indicators (On the Top or press /) -> Invite-Only Scripts (last button of the left bar)
Like/Favorite the indicator
Click to install on the chart
---------- About Loading Time ----------
It may take up to 1-3 minutes for your browser to load a new setting, depending on the your computer and network speed. For convenience, you can keep related pages open continuously.
---------- FAQ -----------
1. Why can't I see older breakout labels?
Due to system limit, 500 is the maximum of labels.
In order to see older breakout events, please Select Bull or Bear, instead of Both; Or Increase the threshold to filter weak breakouts.
2. How to watch more than 30 Forex?
Due to system limit, 30 assets is the maximum.
In order to watch more assets, user can open the indicator in another sub-chart, add your 2nd assets list, save the layout, set alerts for different lists respectively.
---------- Disclaimer ----------
By using or requesting access to the indicator, you acknowledge that you have read and accepted that the indicator and any related content, including but not limited to: user manual, tutorials, ideas, videos, chats, emails, blog, are for the purpose of trading strategies studying and paper trading.
If a customer or user uses the indicator or related content mentioned above for live trading or investment, she/he should take all risks and responsibility.
---------- Updates ----------
The latest updates override the previous description.
To activate a update: Close the browser, Reopen the chart and apply the indicator.
【外汇资产突破预警】指标绘制一系列外汇资产的突破事件,提供突破预警
任何大趋势都开始于一系列的价格突破。通过监控突破事件,可以俯瞰市場的運動
---------- 产品特征------------
用户自定义的交易品种列表,多达30个品种
用户自定义的突破门槛
适用于宽泛的时间维度:1分钟--1月
绘制整个市场的突破历史
漸進顏色 根據突破的力度
------------- 指标设置说明 -------------------
"展示牛熊突破?": 展示牛突破,熊突破或者两者
“用户自定义突破门槛”: 自己定义突破门槛,999代表默认的设置
"綠色為牛?": 切換標籤顏色,默認綠色為牛
“交易所”:用来定义资产前缀,可以为空
“资产后缀”: 用来定义资产后缀,可以为空
---------- 版本描述 ----------------
產品特徵後續可能變化,恕不事先通知
DEMO版本供試用
----------- 獲取指標使用權 ------------
通過私信聯繫作者,要求訂閱或試用
----------- 安裝指標 -----------------
加指標 -》 Invite-Only (左邊欄目)
點贊或者收藏指標
點擊安裝指標
----------- 關於載入時間 ---------------
可能需要1--3分鐘來完成載入,取決於用戶的電腦和網絡速度,方便起見可以保持相關頁面持續開啟
------- FAQ ----------
1. 如何查看更早的突破歷史
由於系統限制,500 個標籤是上限
為了查看更早的突破,請選擇牛或者熊,而不是兩者;或者提高"用戶自定義突破門檻" 來過濾掉弱突破
2. 如何監控更多資產?
由於系統限制,30個資產是上限
為了監控更多資產,可以在第二個子圖表加載指標,保存圖表,分別在不同的圖表設置突破預警
---------- 免責聲明 ----------
在要求獲得本指標使用權之前以及在使用本指標之前,用戶認可已經完全了解和接受:本指標僅供學習交流目的, 它不構成任何交易建議或者投資建議。用戶如果將指標用於其他用途,應自行承擔所有風險和責任。
本指標的開發者並非專業投資顧問,因此不對用戶的任何行为負責。
最近的更新會覆蓋之前的說明。請參閱更新來查看指標的新特徵和功能

PpSignal Momentum TraderThis is a combination of the PERCENTAGE of PRICE OSCILLATOR (PPO) and Momentum.
When both oscillators are up in the same direction it is buying (green bottom and green oscillators), when both oscillators are down it is sell (red bottom and red oscillators. When they do not agree (silver bottom) it is to keep doing nothing .
You can also see the change in trend with the candles as well. same colors as the background and the oscillators.

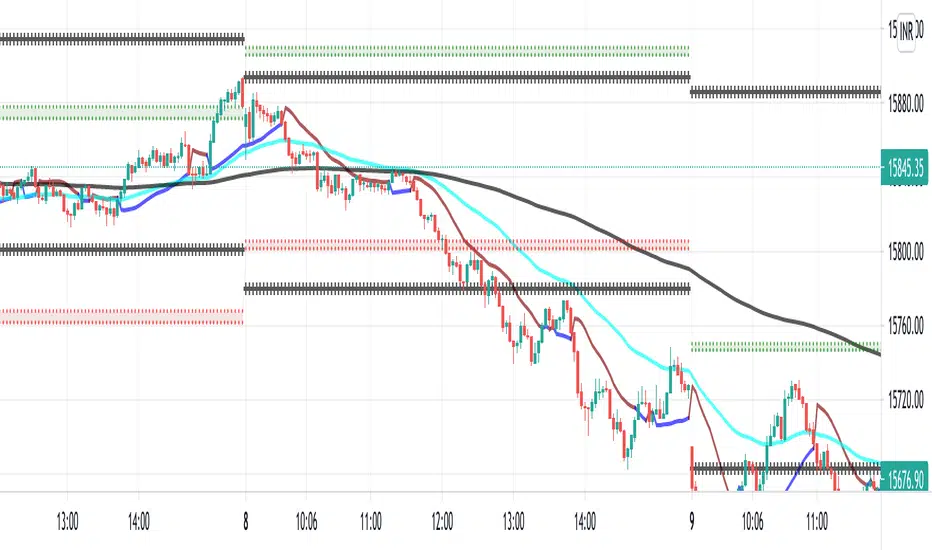
pSignal CFB and Slope Trend Folow This indicator shows the trend of an asset (nifty, crypto, forex, stock, etc., taking as a starting point the volatility and direction of the market.
When the moving average slope crosses up CFB (see CFB explanation below) it is BUY.
When the Moving Average Slope crosses CFB down it is sell.
The system also has a support and resistance (daily, weekly, or mouth) identifier.
The alarm of resistance or support signal: When price close and volume break daily support or resistance the general system is a visual signal.
Bull Wick= the high price broke the resistance.
Bear wick = the low price broke the support.
Break Out color blue color = the close price and the volume broke the resistance.
Break Out color maroon color = the close price and the volume broke the support.
The system also has the Bollinger bands that show us the volatility of the market and when it is up or down. Read more about the use of the Bollinger band
CFB
his indicator was designed to filter out lower price actions for a clearer view of trends. Inspired by QQE's volatility filter, this filter applies the process directly to price rather than a smoothed RSI . Range Filter and bands are now calculated in a singular function. There are now two different calculation methods for the filter. Select the type you want to use through the "Filter type" entry. Type 1 is the original formula. Multiple range size methods are now available.
You can choose between the following scales:
- Points
- Pips (Works best with currency pairs, obviously)
- Ticks -% of the price - ATR - Average change (default. This is the original sizing method). - Standard Deviation
- Absolute (absolute numerical value)
- Smoothing with the range elder is now optional, and you can specify its smoothing length.
Smoothing only affects dynamic scales (ATR, average change, and standard deviation).
- Filter movement can now be determined using highlights or closing price. This can be specified through the input.

Swing Reversal IndicatorSwing Reversal Indicator was meant to help identify pivot points on the chart which indicate momentum to buy and sell. The indicator uses 3 main questions to help plot the points:
Criteria
Did price take out yesterday's high or low?
Is today's range bigger than yesterday? (Indicates activity in price)
Is the close in the upper/lower portion of the candle? Thus, indicating momentum in that direction
This indicator was built to help me find pivot points for directional options trading however can be used for equities and forex swing trading and other strategies. Used in conjunction with a BB extreme can provide good setups.
Alerts are available for both the long and the short positions and the indicator will repaint as price moves.
The character Plotted can be changed in the settings
The size of the candle area can be changed as well if you want to tighten/loosen the trigger points based on the third question above.
