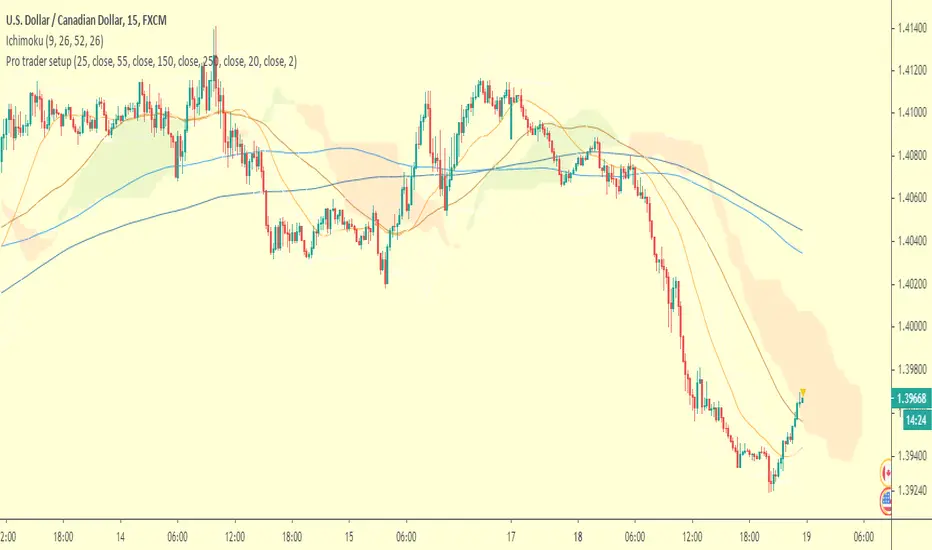
Pro Trader SETUPThe indicator comes with 4 Moving Averages
Default 25 55 150 250
Support/Resistance
ATR breakout signals (use on higher TFs)
Bollinger Bands
Forex
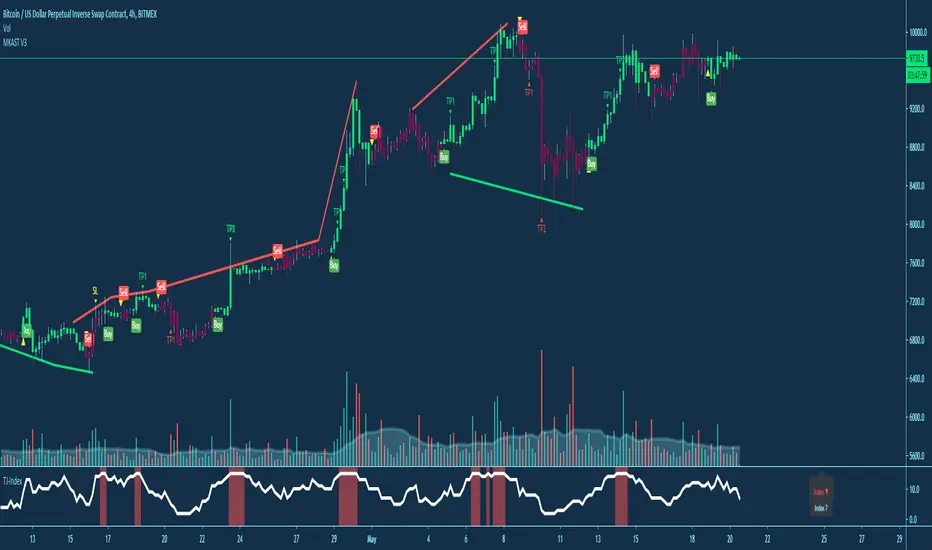
MyAlgoPLEASE READ THE ENTIRE POST BEFORE PURCHASING & USING THE MyAlgo Tool. Saves you and me some time in emails and messages. :)
This is the official version of MyAlgo
PLEASE UNDERSTAND THAT THIS IS A DIFFERENT AND SEPARATE PRODUCT AND SCRIPT FROM "MyAlgo SLIM" FROM THE MyAlgo TRADING TOOL SERIES
Description
Buy & Sell Alerts can be set on all Tickers. This includes, but is not limited to Crypto, Commodities , FOREX, Equities and Indices. Also all candle Types are compatible.
Recommended Time-frames - Due to the complexity of MyAlgo-SLIM the user has a choice between three algorithms and is like that able to trade on all timeframes with the highest returns.
MyAlgo combines many different aspects at the same time, scans multiple other Algorithms and comes to a conclusion based on over 1350 lines of code.
It is based on Divergences, Elliott Waves , Ichimoku , MACD , MACD Histogram, RSI , Stoch , CCI , Momentum, OBV, DIOSC, VWMACD, CMF and multiple EMAs.
Every single aspect is weighted into the decision before giving out an indication.
Most buy/sell Algorithms FAIL because they try to apply the same strategy to every single chart, which
are as individual as humans. To conquer this problem, MyAlgo has a wide range of settings and variables which can be easily
modified.
To make it a true strategy, MyAlgo has as well settings for Take Profit Points and Stop
Losses. Everything with an Alert Feature of course so that FULL AUTOMATION IS POSSIBLE.
I know from experience that many people take one Algorithm and are simply too LAZY to add multiple Algorithms to make a rational choice. The result of that is that they lose money, by following blatantly only one Algorithm.
MyAlgo has additional 15 Indicators, perfect for all markets, which can be turned on and off individually.
Side Notes
MyAlgo is being updated and upgraded very frequently to suit the requests of our customers.
This is not financial advice. Please read our disclaimer before using.
Anything below this sentence will be Updates regarding MyAlgo
Session.TrdrThis a script designed to find continuation patterns on a variety of instruments but ideally on futures over short periods of time. The script can be used to trade trend over weekly and even monthly time frames but is best used for day trading. The script uses price action only as its key inputs highlighting the points during the trading day when the dominant flow has resumed. The script is designed to be traded on the 15M time frame for intra-day signals. To get access to the script please see the contact details in our signature.

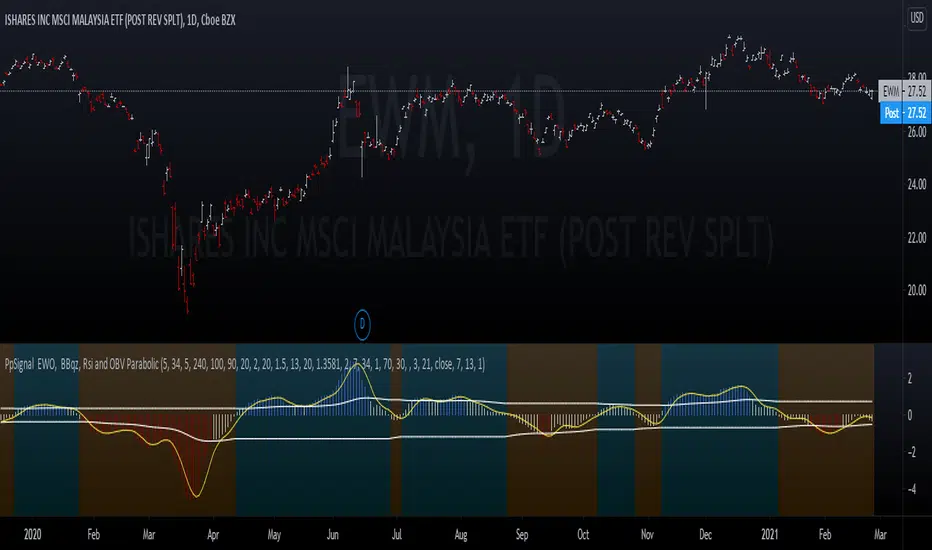
PpSignal EWO, macd, BBqz, Rsi, wodie cci & tigger trend V 2.0EWO break band, macd, bbsqeeze, trigger trend factory, rsi, and woodie cci all in one.
Buy when the price cross up ) line and sell when the price crosstown the )line...
Basic Forex TerminalHello,
This script is a simple Forex terminal.
It serves the same purpose as Heatmaps.
You can also set the period to look back manually in the menu.
Major indicators are taken into account.
In this way, an idea can be obtained about all major and minor currencies.
Best regards.

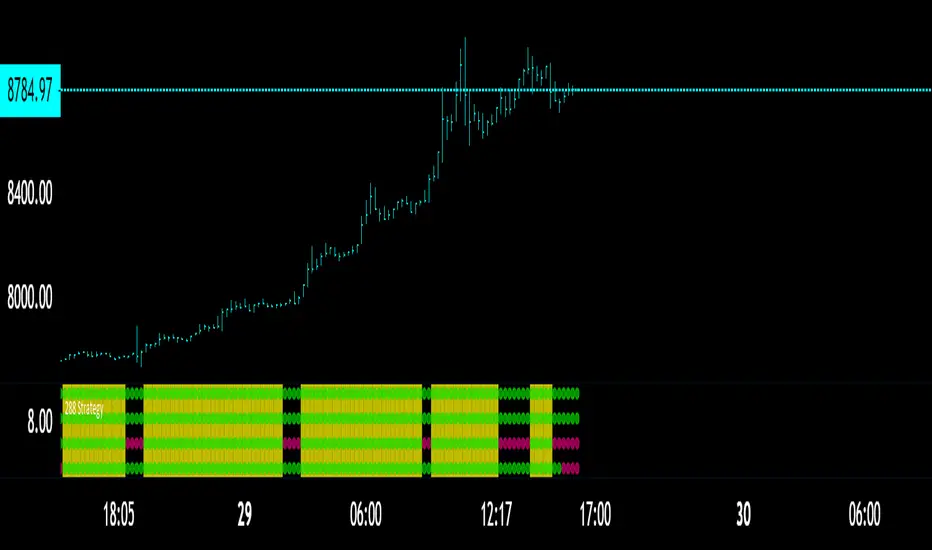
The 288 StrategyThe classic 13-55 crossover with the 220 being main trend
What I added here was two other variables
A fixed momentum for the time frame youre in, the momentum in the chart is the 30 minute while we are on the 13 minute.
A variable momentum for whatever TF you desire
Lower variable means more trades since momentum will flip more often
Higher means more of a trend playing algo
You may also mark the momentum algos OFF if you wish to use the STANDARD 13-55 / 220 Technique
In which you would just look for all 3 to hit to enter a trade AND just 2 to flip to exit/Take Profit
Back Ground will flash YELLOW for BULL
and
PINK for BEAR when all triggers are met.
To attain access DM me here or if you follow me on Twitter you can there as well!
CHEERS
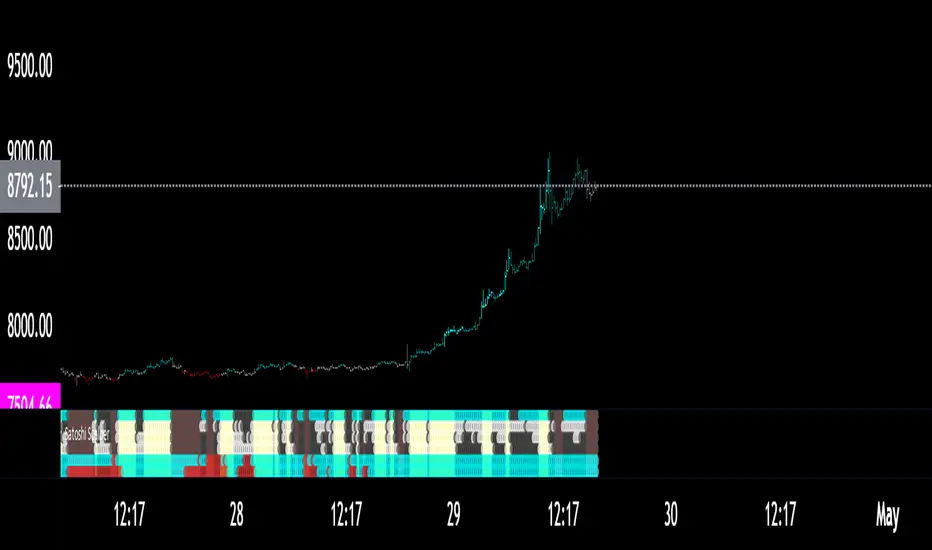
Satoshi Scalper ToolA little trigger key for an algorithm/system I have developed over the years to confirm wave patterns after a trade idea is made or entered
Can be used as a stand alone so i created this key that will fill in accordance to the signal.
The first 4 rows are the most important and those will be your entry criteria
Once all 4 trigger the space will become shaded
LONG = YELLOW BG
SHORT = RED BG
Cyan/White is BULLISH
Red/Gray is BEARISH
the bottom two rows are your main trend BULL or BEAR in regards to two variables i have chosen
NOW you dont need to listen to these to enter a trade HOWEVER you should treat a counter-trade to main trends as a short day trade or scalp
Added the famous SRSI candles to the script for a visual :)
I also made the settings FIXED
This was developed in Crypto but it works well in all other markets.
To attain access DM me here or on twitter if you follow me there!
CHEERS
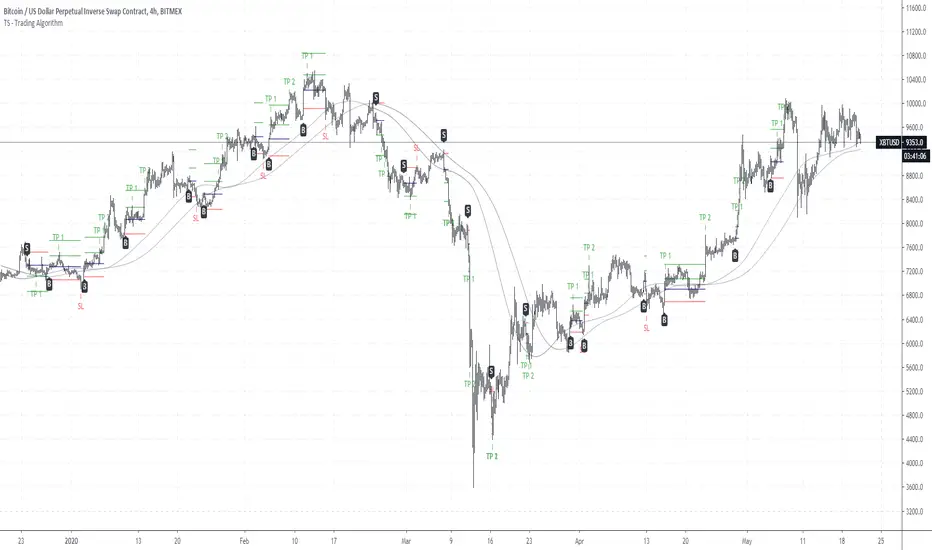
TS - Trading Algorithm - Crypto, Forex & StocksWhat does the TS - Algorithm do?
-- Plots trend following, high probability signals.
-- These signals do not repaint and can be used confidently to enter or exit a trade.
What markets can this indicator be used on?
-- Forex
-- Stocks
-- Commodities
-- Cryptocurrencies
What time-frames can this indicator be used on?
-- This indicator can be used on 1m, 3m , 5m, 10m, 15m, 30m, 1hr, 2hr, 3hr, 4hr, 6hr, 8hr, 12hr, Daily, Weekly, Bi-Weekly and Monthly time-frames.
-- This is a trend following algorithm, so low as there is good volume , volatility and price history of an asset, the model can perform.
Does this indicator repaint?
-- No
Premium Tradespot Script - Trial access and Information
-- Trial access offered
-- PM me directly to request trial access to the scripts or for more information.
Theft Indicator - BOOM Buy/Sell SignalsWhat is our indicator?
Theft Indicator - BOOM is a script that shows entry levels on a condition that is met with our special algo. The algo consists of crossovers, which are not visible but we take pride in the effort we have put to make this indicator have a high success rate as long as you have a scalping target price set.
Does it Repaint?
Our indicator does NOT re-paint. Although while setting an alert it may pop up the repaint alert, please take into consideration that once a signal is fired on a "CLOSED BAR", our signal will never disappear, they do not repaint.
What Markets is it usable with?
You can use it in any market, Forex, Stocks, Crypto, Indices. All time frames work, not all trades will be profitable (this is how trading is, you can take a loss sometimes). But the Majority is profitable if you use a stop loss and target price.
How to use:
Simple plug and play it to your chart, in addition to a few other indicators we will recommend to you (we still have not published them yet), and this will confirm your trades. You can also connect TV alerts with a bot and let it run. Please be aware that SLIPPAGE time is important, If you run a bot on this indicator you HAVE to know that the buy/sell price will be on the bar AFTER the Candle close (For example: the BUY/SELL alert is on a candle, the buy/sell your bot or you will execute WILL be in the following candle depending on your trading system. We advise you to not leave the bot to trade on its own, you have to monitor and have a specific syntax that we will help you with creating according to your trading style.
P.S: This is not financial advice, we are just sharing our indicator that we know has good results, and it will take time for people in -ve profiles to recover losses and for the profiting to be more profitable. We use a specific trading method that only works with it
You can contact me for more information about the indicator, Goodluck :)

Theft Indicator - Pip GainerWhat is our indicator?
Theft Indicator - Pip Gainer is one of our recent published scripts that shows price action on a certain period of time (We Use a modified version of ATR). We take pride in enabling trading to become easier for the experienced and the non-experienced traders around the globe. Buy & Sell alerts will be fired once a condition in our algo is met.
Does it Repaint?
Our indicator does NOT re-paint. Although while setting an alert it may pop up the repaint alert, please take into consideration that once a signal is fired on a "CLOSED BAR", our signal will never disappear, they do not repaint.
What Markets is it usable with?
This version is dedicated to FOREX markets, we encourage using it for low timeframes starting the 3 minute to the 15 minute timeframe. WE RECOMMEND USING THIS IN THE FOREX MARKET, ESPECIALLY WITH CURRENCY PAIRS.
How to use:
Simple plug and play it to your chart, in addition to a few other indicators we will recommend to you (we still have not published them yet), and this will confirm your trades. You can also connect TV alerts with a bot and let it run. Please be aware that SLIPPAGE time is important, If you run a bot on this indicator you HAVE to know that the buy/sell price will be on the bar AFTER the Candle close (For example: the BUY/SELL alert is on a candle, the buy/sell your bot or you will execute WILL be in the following candle depending on your trading system. We advise you to not leave the bot to trade on its own, you have to monitor and have a specific syntax that we will help you with creating according to your trading style.
How are the Buy/Sell Alerts fired?
We use the simple ATR (Average True Range) indicator. However we have modified the indicator to serve our trading system. Check below for a definition of what ATR is:
What is Average True Range - ATR?
The average true range (ATR) is a technical analysis indicator that measures market volatility by decomposing the entire range of an asset price for that period. Specifically, ATR is a measure of volatility introduced by market technician J. Welles Wilder Jr. The true range indicator is taken as the greatest of the following: current high less the current low; the absolute value of the current high less the previous close; and the absolute value of the current low less the previous close. The average true range is then a moving average, generally using 14 days, of the true ranges.
Why is our indicator special and different from the normal ATR indicators?
We have modified the mathematical equation and changed it slightly to give more accurate signals, we do not promise all trades are profitable, the use of this indicator is up to your own judgement and liability. We believe that we have an indicator like no other ATR.
P.S: This is not financial advice, we are just sharing our indicator that we know has good results, and it will take time for people in -ve profiles to recover losses and for the profiting to be more profitable. We use a specific trading method that only works with it
You can contact me for more information about the indicator, Goodluck :)

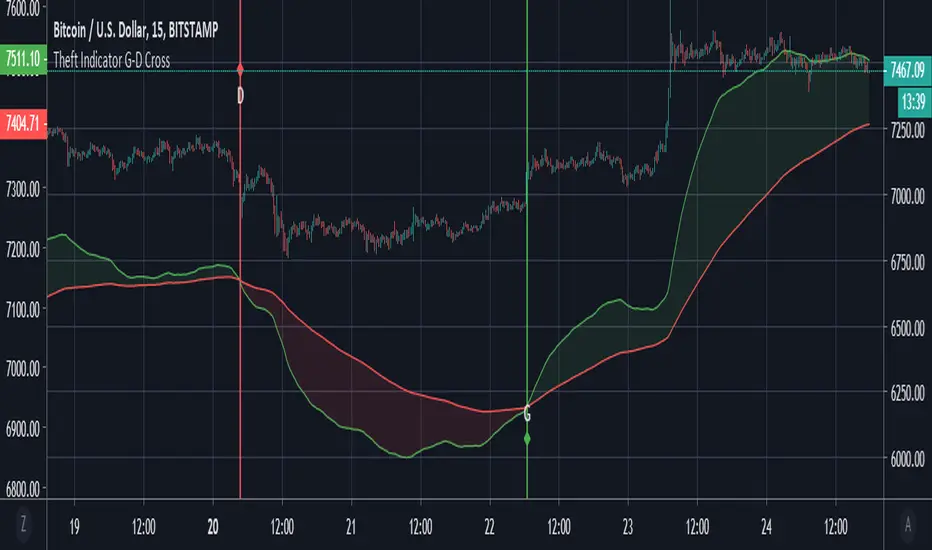
Theft Indicator - Golden/Death CrossThe golden cross and death cross used here is favorable for low time frames. We believe it is a good scalping option to use it. It works well with forex, stocks and crypto.
How is it used? - Just apply it to the chart, and take trades on the labels signaled. G = Golden cross || D = Death Cross.
The indicator is open for public use, but the source code is protected.
Enjoy it.
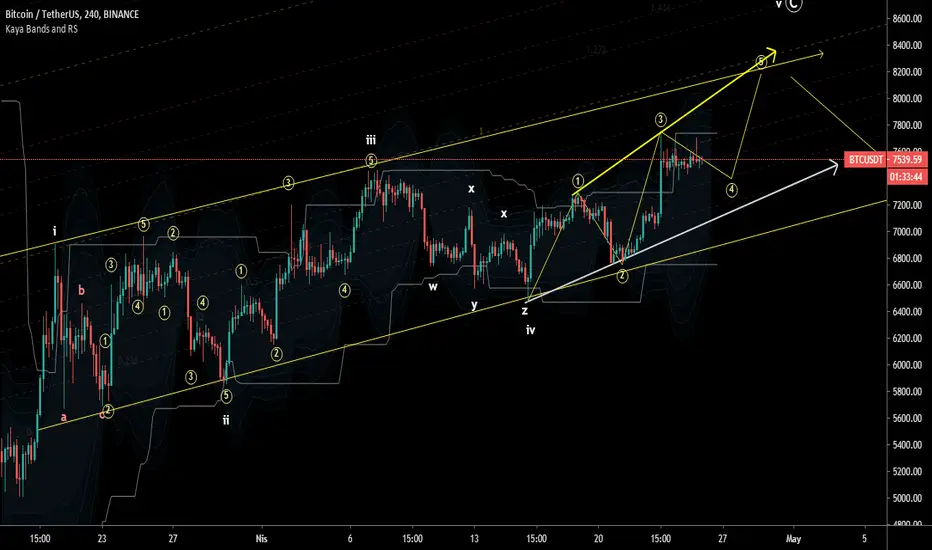
Kaya4938 BBBands with Moving Resistance/Support Lines v.2Take your own risk. It is combines 2 indicator in this Script. First Bollinger bands (BB) from 1.5 deviantion to 3.5 deviation (1.5, 2.5, 3.0, 3.5). You can see price interection with BB step by step. And how price acting up or down with this 5 degree of Bands.
The second is my own indicator Moving Resistance And Support Lines ( RS ). It is calculated for observing RS .
Also we have shifting options for both BB and RS .
As a result this script will be helper for seeing undersanding of changing trends, breaks of Resistances and Supoorts and etc.
BEST REGARS.
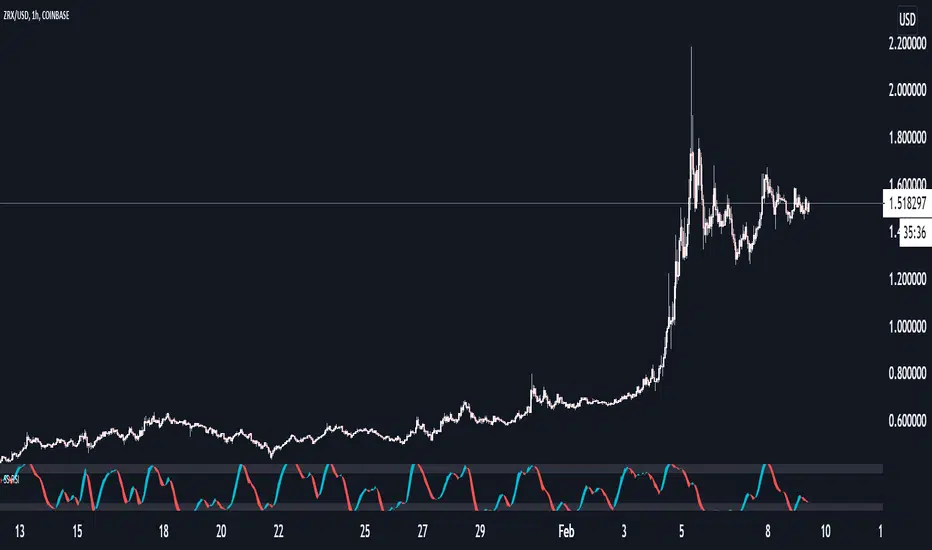
Satoshi Stochastic RSIA Tweaked version of the Stochastic RSI
I was a huge fan of the stochastic when i first started trading as it helped me understand exhaustion in trends and kept me out of entering too soon.
I decided to take the same variables i applied to SRSI and added them to this and i loved the results I see on the chart.
Still used for signs of exhaustion etc but now a simple cross of the K and D line will have a pretty good indication on where price will go .
PpSIgnal Double Murrey's Math StrategyMurrey Math es un conjunto complejo de niveles de soporte y resistencia que actúan más o menos de la misma manera que los puntos de pivote, pero también proporcionan algunas ideas sobre si la tendencia actual debe continuar o revertirse. El concepto matemático de Murrey fue desarrollado por T. Henning Murrey en 1995 y se describió con gran detalle en su libro "El sistema de comercio matemático de Murrey para todos los mercados negociados".
compre cuando ambos sociladores este verdes y venda cuando ambos esten en rojo
Murrey Math is a complex set of support and resistance levels that act more or less the same as pivot points but also they provide some insights on whether the current trend should continue or it should reverse. The Murrey math concept has been developed by T. Henning Murrey in 1995 and has been described in great detail in his book “The Murrey Math Trading System For All Traded Markets.”
buy when both murray oscillators are green and sell when they are red

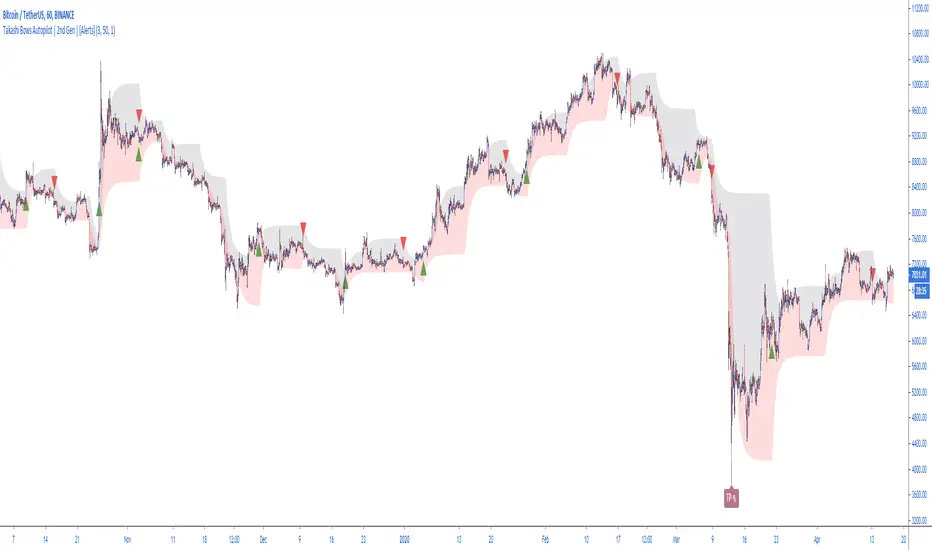
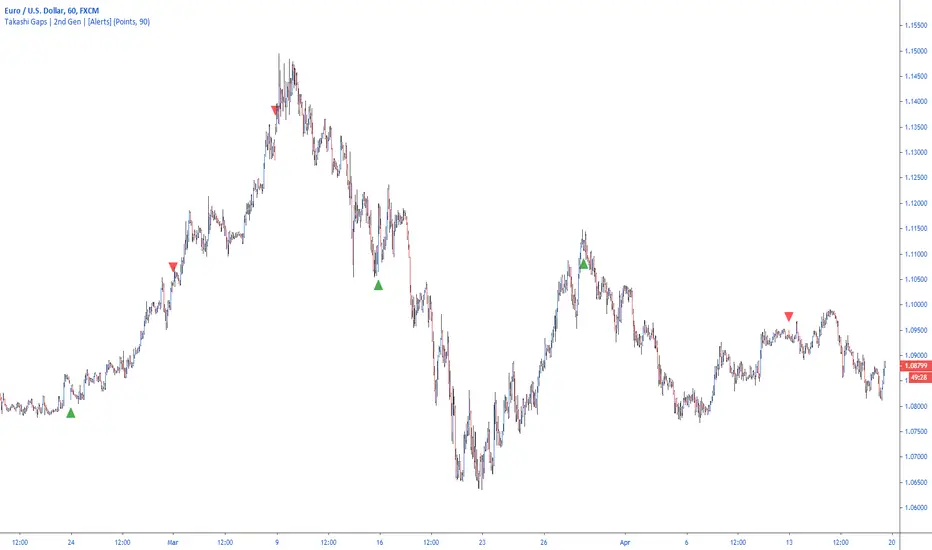
Takashi Bows Autopilot | 2nd Gen | [Alerts]Our state-of-the-art trend confirmation indicator is now combined with automatic threshold selection.
Takashi Bows Autopilot is the ultimate trading tool. Effortless, its signals put traders inside strong trends, locking big profits that cover all loss generated during sideways trends.
An upgrade version of Takashi Bows v1, this script is the result of some operations developed by us, it can easily adapt to different markets and time frames. Now ranging from level 1 to 20, traders can select the amount of signals to be displayed on the chart. Based on price movement, it signals entries after strong movement up or down.
Take Profit included. If a position is opened in one direction, it should be closed at take profit levels or when a position in the opposite direction is opened.
Inputs
Level
Integer input. Sets a level for signals generated up and down. The higher the level, more signals on chart, and vice-versa.
Take Profit %
Float input. Sets a percent of take profit for exiting previous open position.
Rule
Float input. Sets a ruler for more accuracy on less volatile markets. Standard value 1 for high volatile markets, higher values for low volatile markets.
See Bows
Bool input. If true, Bows lines can be seen on chart.
To get access to this and other scripts check links below.
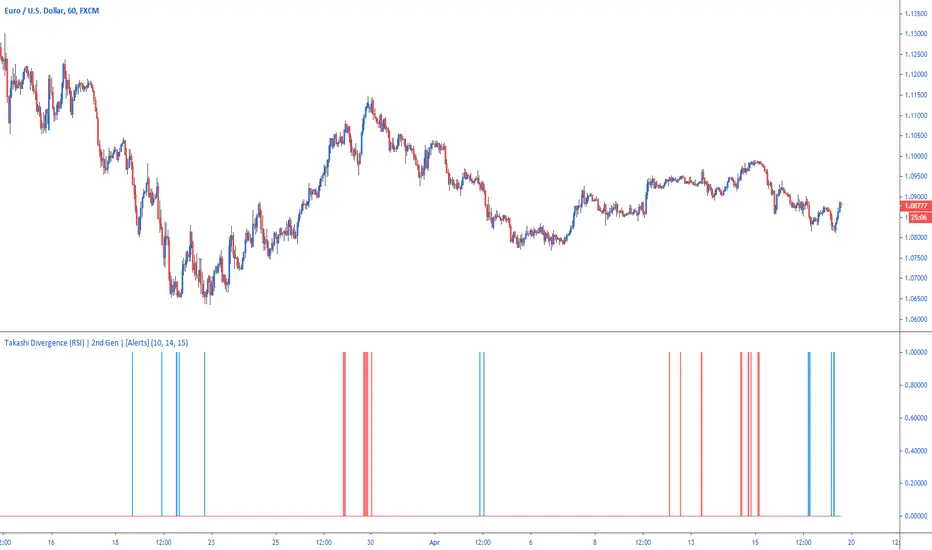
Takashi Divergence (RSI) | 2nd Gen | [Alerts]Easily highlight positive or negative divergence between price movement and RSI with Takashi-powered Divergence analysis.
Divergence strategy signals a potential reversal point because directional momentum does not confirm price. A bullish divergence occurs when the underlying market makes a lower low and RSI forms a higher low: RSI does not confirm the lower low and this shows strengthening momentum. A bearish divergence forms when the market records a higher high and RSI forms a lower high: RSI does not confirm the new high and this shows weakening momentum.
Inputs
Divergence Sensitivity
Float input. Sets a threshold after when the RSI divergence is triggered.
RSI Length
Integer input. The default setting used by most traders for the RSI is 14. That means that the indicator will go back 14 periods or time frames based on the chart being used (14 days on a Daily chart , 14 hours on an hourly chart and so forth) and make its calculation based on that.
Cross Distance
Integer input. Value from RSI that above or below 50 that classifies bullish or bearish levels. By default 15, that means the script will be checking for positive divergence when RSI is below 35 (50-15) and negative divergence when RSI is above 75 (50+15).
Use High & Low
Bool input. If true uses high and low values as RSI source.
To get access to this and other scripts check links below.
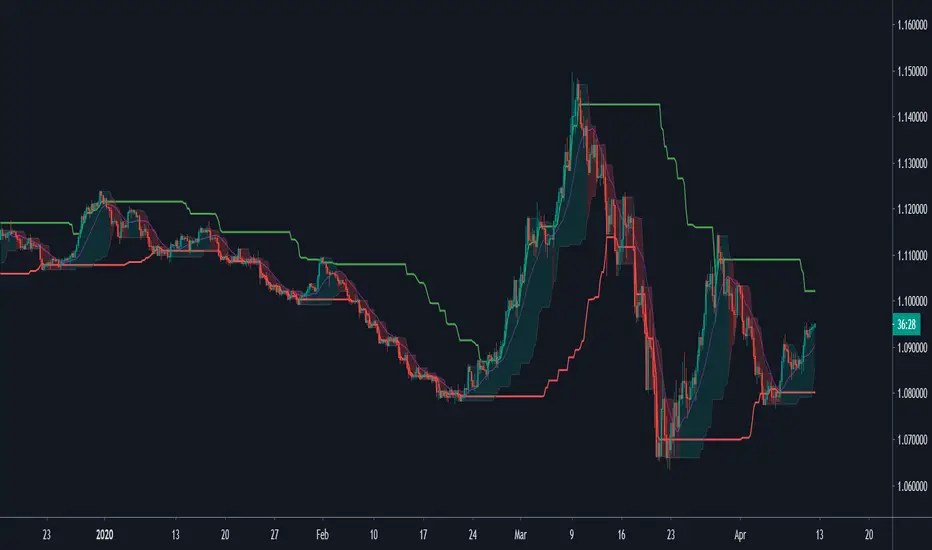
Takashi Trend | 2nd Gen |Discover trends instantly thanks to our new indicator.
A popular trading expression says: "the trend is your friend until it ends." This indicator makes it easier for any trader to see the market's major trend and trade accordingly.
Calculations are based on Average True Range.
This indicator does not provide signals or alerts. It is best used as a confirmation tool.
To get access to this and other scripts check links below.

Takashi Gaps | 2nd Gen | [Alerts]Spot gaps between bars and benefit from the correction of the market as the price restores its position.
Inputs
Value In
Options input. Defines if the gap between bars will be checked by Points or Percent.
Gap Size
Float input. Value to trigger a signal if the gap between bars is bigger than.
To get access to this and other scripts check links below.
PpSignal CFB Version 2 Composite Fractal Behavior
Este indicador fue diseñado para filtrar acciones de precios menores para una visión más clara de las tendencias.
Inspirado en el filtro de volatilidad de QQE, este filtro aplica el proceso directamente al precio en lugar de a un RSI suavizado.
Range Filter y las bandas ahora se calculan en una función singular.
Ahora hay dos métodos de cálculo diferentes para el filtro. Seleccione el tipo que desea usar a través de la entrada "Tipo de filtro". Tipo 1 es la fórmula original.
Múltiples métodos de tamaño de rango ahora están disponibles. Puede elegir entre las siguientes escalas:
- Puntos
- Pips (Funciona mejor con pares de divisas, obviamente)
- ticks
-% del precio
- ATR
- Cambio promedio (predeterminado. Este es el método de dimensionamiento original).
- Desviación Estándar
- Absoluto (valor numérico absoluto)
- El suavizado con eldher de rango ahora es opcional, y puede especificar su longitud de suavizado. El suavizado solo afecta a las escalas dinámicas (ATR, cambio promedio y desviación estándar).
- El movimiento del filtro ahora se puede determinar usando mechas o precio de cierre. Esto se puede especificar a través de la entrada .
Bollinger Band RSI Wilder
Las bandas de volatilidad se calcularon teniendo como base el rsi wilder.
Básicamente uno estaria comparado con tendencia y volatilidad
Compre cuando el el CFB da señal de Compra color verde y las bandas de volatilidad se pongan de color azul...venda cuando cfb se pone rojo y las bandas de volatilidad se ponen celestes.
This indicator was designed to filter out lower price actions for a clearer view of trends. Inspired by QQE's volatility filter, this filter applies the process directly to price rather than a smoothed RSI. Range Filter and bands are now calculated in a singular function. There are now two different calculation methods for the filter. Select the type you want to use through the "Filter type" entry. Type 1 is the original formula. Multiple range size methods are now available.
You can choose between the following scales:
- Points
- Pips (Works best with currency pairs, obviously)
- Ticks -% of the price - ATR - Average change (default. This is the original sizing method). - Standard Deviation
- Absolute (absolute numerical value)
- Smoothing with the range elder is now optional, and you can specify its smoothing length.
Smoothing only affects dynamic scales (ATR, average change, and standard deviation).
- Filter movement can now be determined using highlights or closing price. This can be specified through the input.
Bollinguer Bands
Volatility bands were calculated based on the rsi wilder. Basically one would be compared to trend and volatility Buy when CFB gives
Buy signal green color and volatility bands turn blue ... sell when cfb turns red and volatility bands turn light blue.

Rogue Profit Alert IndicatorThis is a complex script developed to measure specific volatility parameters and enter trades based on predetermined rules which are proprietary and will not be released, so don't ask for specific indicator settings.
This indicator accompanies the "Rogue Profit Strategy" and can be used for creating alerts based on the strategy's performance. Please read the more in depth description on the "Rogue Profit Strategy" page. Make sure the input parameters are the same for both the Strategy and Indicator to insure accurate signals.
This is a very powerful and profitable script that will simplify your trading and has been in development and tested for three years. Message for details on how to obtain access. Please allow up to 24 hours for a response.

Magnet Trend IndicatorUse: /--
-- When price is sticking to the upper green magnet, it indicates a stronger uptrend.
-- When price is sticking to the lower magnet, it indicates a stronger downtrend.
-- Inside the cloud you'll see a purple MA line, this is used to catch possible trend reversals, if price closes above this line the cloud will turn green, wait for price to move away from magnets to confirm trend reversals.
// -- Still testing and upgrading so it's not great at the minute!
enjoy :)
Tested using forex only, it may still work for crypto, stocks and others but i have not tested it on those.
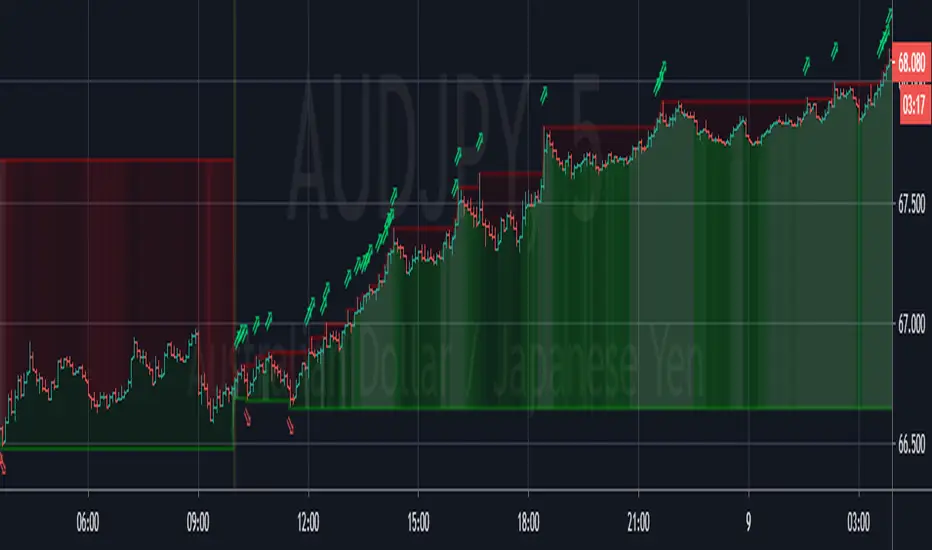
[Zekis]Opening Range Higher High Lower Low Forex SessionsOpening Range Higher High Lower Low Forex Sessions
Very useful for session trading, the opening range will reset when new session is start and will plot new higher highs and new lower lows until the end of the session.
Ability to change between 3 opening sessions:
* London - opens at 3:00 am EST
* New York - opens at 8:00 am EST
* Tokyo - opens at 7:00 pm EST
* New day - GMT +0
Green arrow - new higher high
Red arrow - new lower low
Green background - the strength of the bullish trend
Red background - the strength of the bearish trend
(the lighter the color, the stronger the trend)
Enjoy!
@zekis
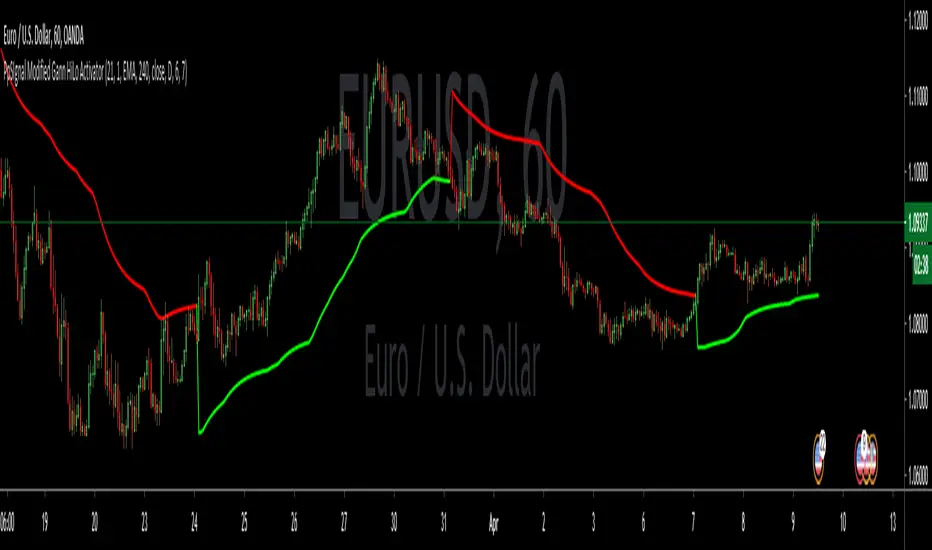
PpSIgnal Modified Gann HiLo ActivatorGann Hi Lo Activator Indicator fue desarrollado inicialmente por Robert Krausz.
El gann Hilo Original es simplemente un promedio móvil de los tres períodos anteriores, bajo o alto.
Yo lo he cambiado por precio de apertura y precio de cierre para evitar repintes .
Este indicador de seguimiento de tendencia, se utiliza para determinar la tendencia del mercado y también para identificar las señales de negociación.
Pero cuando el mercado está lateralizado, le resulta difícil generar señales comerciales precisas. Puede interpretar el indicador leyéndolo de la siguiente manera. En un mercado de tendencia alcista, el indicador pe [pintara de verde en tendecia bajista de rojo.
también le hemos agregado un media movil Tilson para hacer scaplin dentro de una tendencia definida.
Gann Hi Lo Activator Indicator was originally developed by Robert Krausz.
The Original Gann is simply a moving average of the previous three periods, low or high.
I have changed it for the opening price and the closing price to avoid repainting.
This trend monitoring indicator is used to determine the market trend and also to identify trading signals.
But when the market is lateralized, it is difficult for you to generate accurate trading signals. You can interpret the indicator by reading it as follows. In an uptrend market, the indicator pe [will paint green in a downtrend red.
We have also added a Tilson moving average to scaplin within a defined trend.