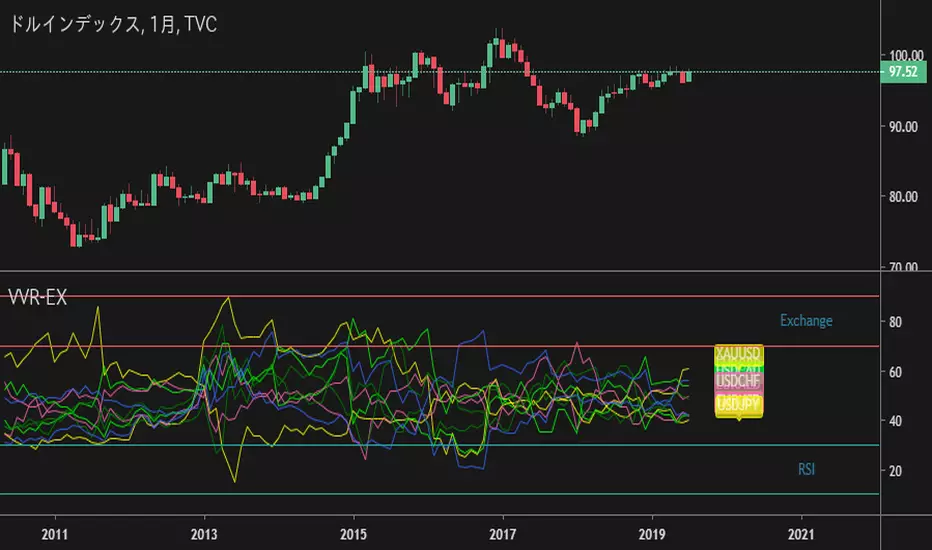
Various Volume RSI (UNLIMITED)RSI displaying multiple currencies together (arbitrary input version)
forex or cryptcurrencies...economic index or metal or energy...and more...
複数の通貨をまとめて表示するRSIです。(任意入力版)
外国為替や暗号通貨...経済指数・金属・エネルギー...その他を表示できます。
同時に多通貨を監視することで見えてくるものがあります。
詳細、購入などはこちらにて
note.mu
Forex

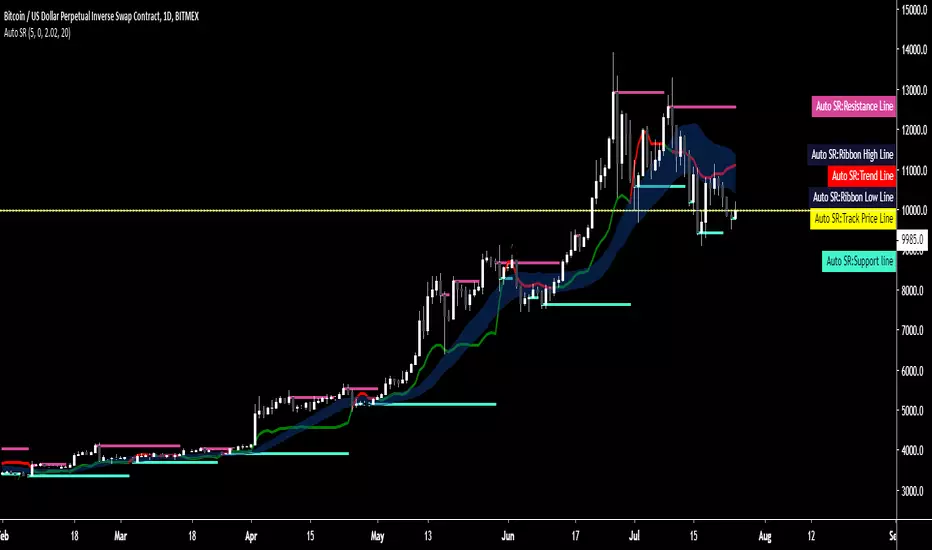
Auto SR - Automatic Support & ResistanceAuto SR is an indicator for TradingView™ which automatically searches and prints key support and resistance levels.
Its strength lies within its ability to provide visualization in real-time to aid in your trading.
It's a versatile indicator suitable for both short or long time frames and has a precision of 8 decimal points, therefore making it suitable for any market type.
A trend line shows a shift in major trends while a ribbon shows you shifts in smaller trends and indications are given for break and re-entry of both support and resistance levels.
All conditions are coupled with their own alerts, giving you the option to integrate it into your trading system or receive alerts on-the-fly.
Tried, true and tested for over one year, Auto SR has already become a trusted staple of those who've experienced it.
As a standalone system or an addition to your existing strategy, Auto SR has what it takes to elevate your trading to the next level.
Key Features:
- Automatic charting of support and resistance lines charted in real-time, no repainting.
- Major and minor trend detection
- Full alerts for support and resistance forming, price exiting or re-entering lines, trend shifts and more.
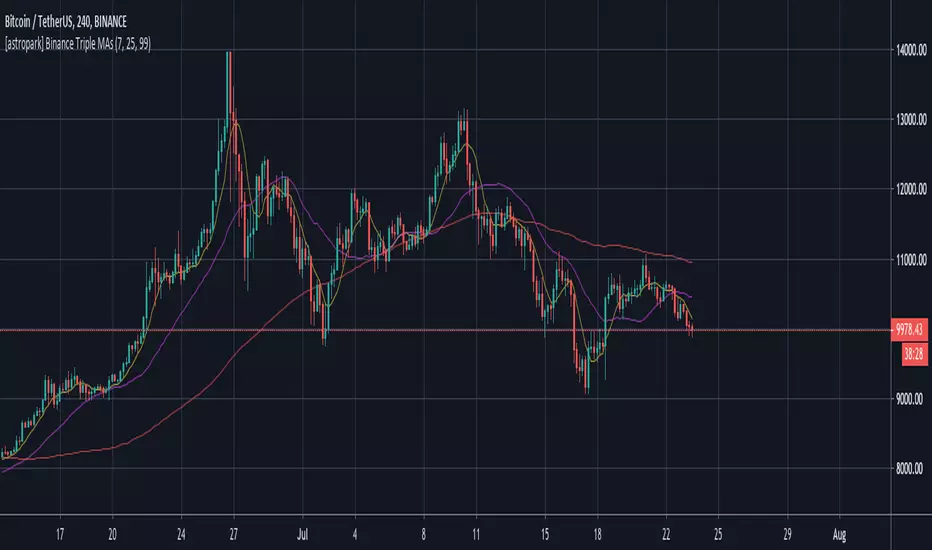
[astropark] Binance Triple MAsDo you miss Binance basic MAs series on your trading view chart?
Enjoy!
Oversold/Overbought RSI backgroundOften a background color is way better of an indicator.
Now you can directly see in your chart when price is in Oversold (red) or in Overbought (green), based on RSI analysis.
Enjoy!

[astropark] 21 days EMAAre you tired to edit you EMA indicator to fit the 21-day settings for your timeframe?
Now you have it for free!
Enjoy!

DBT MoMo v.4DBT MOMO
Introduction: The MoMo is a TradingView indicator designed to evaluate momentum and give the user signals according to momentum shifts, strength, extensions, traps, and divergence. It’s an all in one oscillator that will make reading price action near term and long term much easier.
Part One: Strength
The MoMo consist of two major parts. A 3-candle back formula and a 24-candle back formula. The 3-candle back is called the Price Line (the histogram on the MoMo). The 24-candle back is called the Trend Line (the line on the MoMo). Both lines are placed into a range from 20 to -20. It can go higher than 20 or lower than -20, but this is extremely rare and short lived.
A positive number indicates a bullish bias, a negative number indicates a bearish bias. When the Price or Trend line are ascending while below 0 this indicates that the bearish momentum is weakening. When the Price or Trend line are descending while above 0 this indicates that the bullish momentum is weakening.
In a strong trend the Trend Line will likely flatten out around 15 or -15. While the Trend Line is flat the Price Line will likely shift rapidly, this can lead to bull and bear traps, we will discuss this in the Trap section.
A rare, but powerful signal from the MoMo is when the Price and Trend Lines “pinch” and begin to move in the same direction. If this is happening the trader should be looking to follow the direction of these lines.
Part Two: Extensions
When both Price and Trend Lines are above 10 or below -10 this will begin to signal an extension.
Purple: Indicates the bears are extended to the downside and a pullback or trend reversal upward is likely.
Gold: Indicates the bulls are extended to the upside and a pullback or trend reversal downward is likely.
When only the Trend Line is above 10 the MoMo will shade the upper range red. This indicates the Trend is becoming bullish or entering an extension. If the Trend Line cannot maintain above 10 for long and breaks below 10 this indicates it’s an extension and trend will most likely continue downward.
When only the Trend Line is below -10 the MoMo will shade the upper range green. This indicates the Trend is becoming bearish or entering an extension. If the Trend Line cannot maintain below -10 for long and breaks above -10 this indicates it’s an extension and trend will most likely continue upward.
When the green or purple shading have turned off take the lowest point, this is considered a support level or a local bottom.
When the red or gold shading have turned off take the highest point, this is considered a resistance level or a local top.
The trader can preemptively trade the purple or gold warnings but be warned these warnings can go on for a long time if the trend is very strong. It is the same mentality of an overbought or oversold RSI, except the MoMo extensions have a much higher strike rate.
To avoid preemptively trading these extensions the trader should wait for confirmation on the Price Line and on price action. The Price Line (histogram) should be moving upward during a purple extension to begin showing a bottom. The Price Line (histogram) should be moving downward during the gold extension to begin showing a top.
Part Three: Traps
The relation between the Price Line and Trend Line can create trading signals for bull and bear traps. When the Trend Line is flattened out around 15 or -15, indicating a strong trend is in place, and the Price Line is rapidly moving towards the midline this may indicate a trap is forming.
When the Trend Line is flat around 15 and the Price Line begins moving towards 0, if the Price Line reaches 0 or close to 0 and the Trend Line is still flat, a trap has begone. Once the Price Line shifts from decreasing (red) to increasing (green) the trap is playing out. Therefore, the trader should look to exit short positions or enter long positions.
When the Trend Line is flat around -15 and the Price Line begins moving towards 0, if the Price Line reaches 0 or close to 0 and the Trend Line is still flat, a trap has begone. Once the Price Line shifts from increasing (green) to decreasing (red) the trap is playing out. Therefore, the trader should look to exit long positions or enter short positions.
Part Four: Divergences
The MoMo is exceptional at finding divergences with the Price Line and occasionally the Trend Line.
To find a divergence with the MoMo the trader must look for when the histogram is not following price action completely.
Bullish Divergence: Price makes a lower low, MoMo makes a higher low.
Bearish Divergence: Price makes a higher high, MoMo makes a lower high.
Hidden Bull Divergence: Price makes a higher low, MoMo makes a lower low.
Hidden Bear Divergence: Price makes a lower high, MoMo makes a higher high.
For Access or Questions: Private message us. Thank you.

Oasis Trading Suite LiteOasis Trading Suite Lite
Introduction: The Oasis Trading Suite is a TradingView indicator designed to make following trend and finding key pivot points very easy. It provides the trader with advanced trend coloring for candles, pivot points both high and low, and a trail that will follow price and give signals when a “buy the dip” or “sell the rally” opportunity is presented. This is a Lite version that only showcases the candle coloring.
Part One: Candle Coloring
The Oasis Trading Suite colors candles based on a trending bullish or bearish bias; this will override the default red/green coloring of candles which is based on closes.
Bullish Candles will be denoted with a green color by default.
Bearish Candles will be denoted with a red color by default.
Neutral Candles will be denoted with a gray candle by default. These are candles that do not have a trending bias.
For Access or Questions: Private message us. Thank you.
For the Full Version go here.

Oasis Trading SuiteOasis Trading Suite
Introduction: The Oasis Trading Suite is a TradingView indicator designed to make following trend and finding key pivot points very easy. It provides the trader with advanced trend coloring for candles, pivot points both high and low, and a trail that will follow price and give signals when a “buy the dip” or “sell the rally” opportunity is presented.
Part One: Candle Coloring
The Oasis Trading Suite colors candles based on a trending bullish or bearish bias; this will override the default red/green coloring of candles which is based on closes.
Bullish Candles will be denoted with a green color by default.
Bearish Candles will be denoted with a red color by default.
Neutral Candles will be denoted with a gray candle by default. These are candles that do not have a trending bias.
Part Two: Pivots
In addition to the normal red/green/gray candles there are also blue and orange candles. These candles are pivot bars.
Blue bars denote Bottom Pivots
Orange bars denote Top Pivots
These pivots are not exactly support and resistance, but more of a zone of influence. They can act as support and resistance, swing zones, and breakout points. These are not standard pivots, they do not repaint, they form live and once closed will not move candles.
Part Three: Trail
Finally, the Oasis Trading Suite gives the trader a trailing line that will turn green or red depending on trend. If price falls to the trail and the low (for green trail) is the only thing below the trail it will give a “buy the dip” signal. If the high (for red trail) is the only thing above the trail it will give a “sell the rally” signal. This trail is slightly lagging, so when trend is shifting there will sometimes be false signals at the final shifting point. I am experimenting with removing as many as possible using the “Strict Mode” found in the input settings for the Oasis Trading Suite.
Buy the Dip will be denoted by a Blue Arrow
Sell the Rally will be denoted by an Orange Arrow
For Access or Questions: Private message us. Thank you.

PpSIgnal Quantile Band 3.0We made a multi indicator using the Quantile Band, the Rsi qqe, bollinguer band 10.1 and a sma 34 price per half.
Quentile band: In statistics and the theory of probability, quantiles are cutpoints dividing the range of a probability distribution into contiguous intervals with equal probabilities, or dividing the observations in a sample in the same way.
Quantitative Qualitative Estimation, is based on a rather complex calculation of the smoothed RSI indicators.
The QQE indicator consists of a smoothed Relative Strength Index (RSI) indicator and two volatility-based trailing levels (fast and slow). The Fast Trailing Level (TL) and Slow TL are constructed by calculating the ATR of the smoothed RSI over n-periods and then further smoothing the ATR using an additional n-periods Wilders smoothing function. This smoothed ATR of RSI is then multiplied by the Fast and Slow ATR Multipliers to calculate the final Fast and Slow Trailing Levels.
Bollinger band 13. 1: is the bb with 13 period and deviation 1, we can find the volatile when the price is above or below of the bb band.
the best enter
Buy: price above of quintile band 50, sma 35 and bollinger band.
Sell: invest of the buy signal.

Oasis Trend StrategyThis is a simple script developed to give a quick visual of trend on any given time frame.
This is a script that gives signals of trend switches. Can be used to for buying and selling signals.
On larger time Frames we use the Aqua and Fuchsia Clouds to express the larger time frame trends.
This can be used for long term swing trades especially useful with the 4hr, 6 hr, and daily chart to cancel out all the noise within the larger trends. The smaller Blue/Red Clouds can be used within trend if you are a skillful trader.
On smaller time frames (Intraday), we used the Blue and Red intraday price action. Is meant to be used
alongside with the Aqua/Fuchsia to create short term trades decisions within the short term trends indicated by the Aqua and Fuchsia.
The 9 ema is used to keep a close eye on short term directional changes.
You would want to see if price stays above or below this level along with its price action.
This should give you initial signs of strength or weakness.
The 55 ema (Black) is used to determine larger trend directional changes and for confirmation of trend shifts.
If interested, you can learn a lot just by watching the price react to these levels and can really visualize the price action that encompasses these averages.
We recommend that all traders study Technical patterns, Price action, Financial risk management, and other pre-trade planning strategies to minimize drawdown risk.
Please give us a like and a follow if you like this indicator. Its simple and very easy to use.
We are not financial advisors. We do not give financial advise. Please use this indicator at your free will.
We are not responsible for any financial losses or claims.
If you find this indicator very useful as I have, we do appreciate any amount of tips.
This will fund us to create more indicators to be made for your use.
BTC - 3PmVmmsnuLedg7umzVkLnarKRo43g6P5Tp
ETH - 0x9a1Ba8809687D8d9A1D32Ed1602abEef48060aF1
LTC - MAgqbC6Kev1x3L2GvNwzhZacyBRxCKJ8Mi
ZCash - t1UYRLzQxeaHCNYfA9cLChfBX5mbcNqworA
0x - 0x2B07D8BFB20b6eDb9A498113764082211cdFA2cE
Many free Tradingview users can benefit from our indicators as we employ many many useful indicators that can be toggled in each script to surpass the indicator limits.


Ppsignal GSV V1Entry pattern GSV (Greatest Swing Value)
We return with another Larry Williams pattern, the Greatest Swing Value or GSV, in principle this pattern was developed for the S & P 500, but it could be extrapolated to other markets, as with the previous pattern we will only explain it for long positions. First of all we have calculated the difference between the maximum and the opening of the last 4 bars and its average, that is to say: /4. Being H the maximum of each bar and the O the opening price of each bar. From this average we will extract 180%, that is, we will multiply it by 1.8. The value of this result will be the GSV.
The logic of this GSV entry pattern is as follows: a widely used way to enter the markets is the breaking of highs, but many times false breakdowns occur or what Larry Williams calls "failure swings", to avoid these false ruptures Larry invented the GSV, which is like a moving average applied to the Swing Value (the difference between the maximum and the opening price).
Once we have the GSV we must add it to the opening price of the current bar and the entry will occur when the price exceeds this level.
to determine the entrance we use bollinguer band and atr. In this way we enter the pattern with volatility.
Patrón de entrada GSV (Greatest Swing Value)
Para esta tecnica usamos la volatilidad para determinar entradas, bollinguer band 13.1 y atr...
Volvemos con otro patrón de Larry Williams, el Greatest Swing Value o GSV, en principio estepatrón fue desarrollado para el S&P 500, pero se podría extrapolar a otros mercados, al igual que con el patrón anterior solamente lo explicaremos para posiciones largas. Primero de todo hemos calculado la diferencia entre el máximo y la apertura de las 4 últimas barras y hacersu media, es decir: /4. Siendo H el máximo de cada barra y la O el precio de apertura de cada barra. De esta media sacaremos el 180%, es decir, lo multiplicaremos por 1.8. El valor de este resultado será el GSV.
La lógica de este patrón de entrada GSV es la siguiente: una forma bastante usada para entraren los mercados es la ruptura de máximos, pero muchas veces se producen rupturas falsas o loque Larry Williams llama "failure swings", para evitar estas rupturas falsas Larry inventó el GSV,que es como una media móvil aplicada al Swing Value (la diferencia entre el máximo y el preciode apertura).
Una vez tenemos el GSV deberemos sumárselo al precio de apertura de la barra actual y la entrada se producirá cuando el precio supere este nivel.
para determinar la entrada usamos bollinguer band y atr. des esta manera entramos al patron con volatilidad.

BB - Study - CryptoFoudid.comHi everyone,
A new script transformed on a study from QuantNomad.
Based on the Bollinger Bands to catch the range market.
I filtered the consecutive signals to avoid a "funding" issue.
You can configure it as you want based on inputs.
The best way for crypto is to have about 45 to 55 length and 2 to 3.5 in multiplier but it's your choice :)
ENJOY !

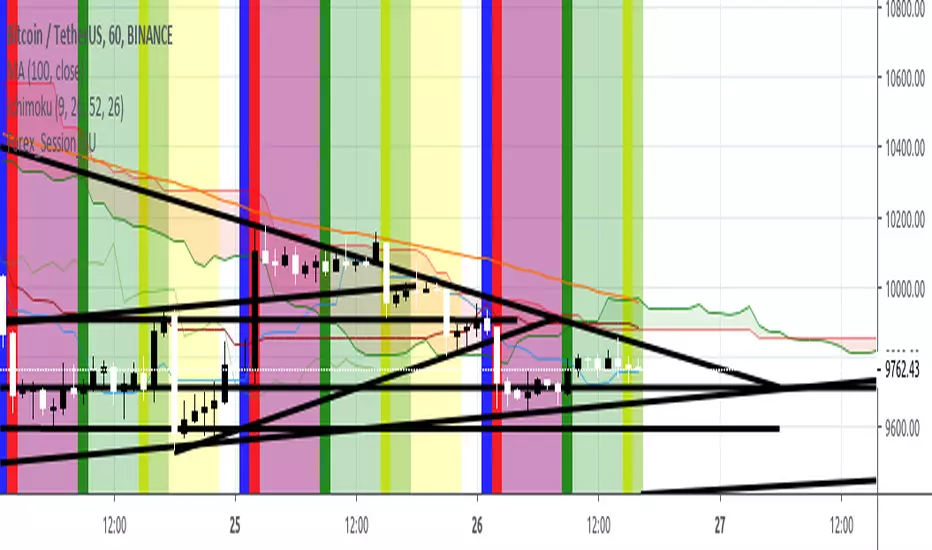
BOSS Automatic Trendlines and Support Zones IndicatorTHE BEST FOREX, BINARY OPTIONS, STOCK AND CRYPTO INDICATORS FOR TRADINGVIEW.COM
Our auto-trendlines indicator and our support and resistance zones indicator with Fast and Slow EMA's all combined in one!
TrendLines
Trendlines when drawn properly make an excellent tool for traders. Used improperly though, they become ineffective and even counterproductive, resulting in a belief that prices have made a reversal when they really haven't, or that a trend has strength when price action suggests it doesn't.
The Boss Auto Trendline Indicator draws the trendlines automatically, and now you can effectively use trendlines as part of your trading strategy.
Trendlines highlight a trend or range (sideways movement). A trendline connects swing lows, where the low is lower than the surrounding prices, and swing highs in price. When the price rises, the swing lows rise.
Red Lines & Dots.
Connecting these lows with a line results in an ascending trendline , showing you that the trend is up. A trendline can also be drawn along the swing highs. This shows the angle of ascent, and the strength of the price move, whether strongly higher or not.
Green Lines & Dots
When the price falls, the swing highs fall. Connecting these highs with a line results in a descending trendline , illustrating the downward trend. A trendline can also be drawn along the swing lows. This shows the angle of descent and the strength of the downward price movement.
Support & Resistance Zones
Green = Support Zones
Red = Resistance Zones
The basic trading method for using support and resistance is to buy/long near support in uptrends, and to sell/short near resistance in downtrends.
Fast & Slow EMA's
Trend Following - you essentially use the EMA to track the primary trend. If a trading pair does not close beyond the average - you stay in the trade.
Moving Average Crosses - by using two different exponential moving average crosses you can generate buy and/or sell signals. For example, you can have a fast average cross a slow average to trigger a trade signal.
Dynamic Support and Resistance - EMA periods like the 21 or 55 can act as support and resistance zones.

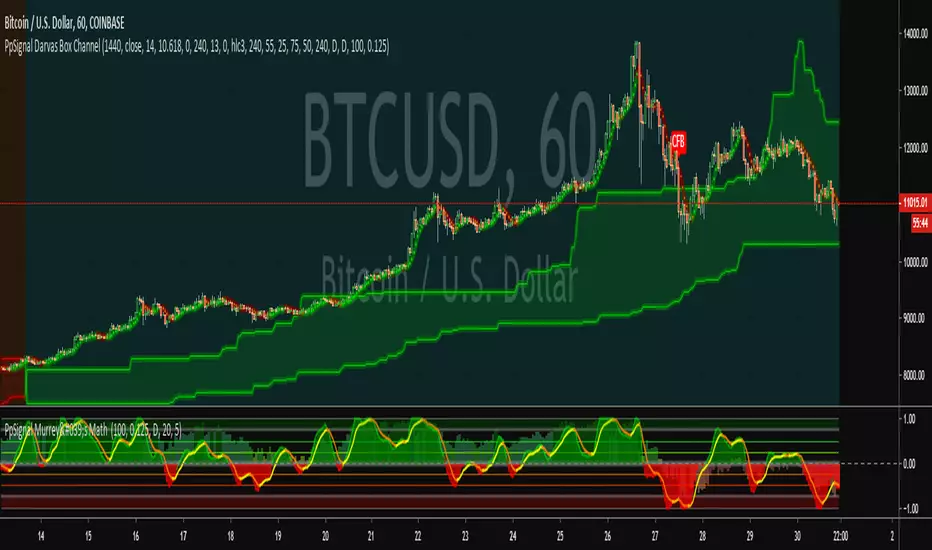
PpSignal Darvas Box ChannelDarvas Box is a great technical analysis indicator, with an interesting background and creator. Nicholas Darvas, a dancer by trade, made $2,000,000 in an 18-month period trading stocks using the Darvas Box method, while traveling the world on dance tours.
I made a darvas box dynamic, which I see more accurate than the darvas box of nicolas
AntiRekt Trend OscillatorWhen the indicator value is above the horizon line the trend is up, below the trend is down. Watch out for ranging markets.

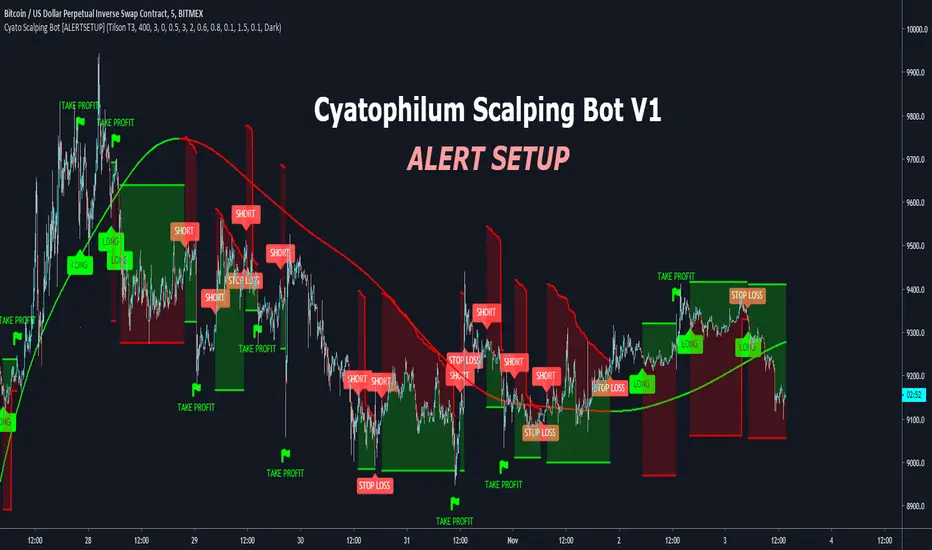
Cyatophilum Scalping Bot [ALERTSETUP]This indicator triggers Short or/and Long entries and exits.
Example with a Long trade:
The integrated stop loss will trigger an alert to exit the trade.
It is possible that a trend reverses during a trade.
In this case, the "LONG EXIT" alert will trigger at the same
time as the "SHORT ENTRY".
The Trend Detector feature, using EMA or Tilson T3 will filter trades that are against the main trend and thus increase profitability.
BONUS FEATURE
Trailing Take Profit with configurable % deviation.
SAMPLE USE CASES
ETH/BTC
ETH/USD
FOREX: GBP/USD
FOREX: XAU/USD
BTC/USDT
LTC/BTC
XRP/BTC
Read More
> Get access to the Cyatophilum Indicators <
Forex TradeSetup
khung thoi gian: 120 - 720
%tang: 0.01-0,1
%giam: 0.01-0,1
TF 15m 91%
TF 1h 83%
TF 2h 80%

PpSignal ADX/DI HistogramHere we have the ADX with DM histogram signal, and volatile Bollinger Band (period 13, Deviation 0.61).
the best signal is when adx is into volatility and dm histogram is going in the same directions.
For example if you detect a up channel...you will buy when DMI histogram is in buy signal (green) and Adx is abobe the bollinguer band. and in e green color.

PpSignal Vortex Indicatorthis indicator is ideal for use in price action technique.
ii you are detect en down or up channel, support resistance, triangle, etc...you can use the vortex indicator for find a good signal.
Look the example picture.
www.mql5.com
