Forex


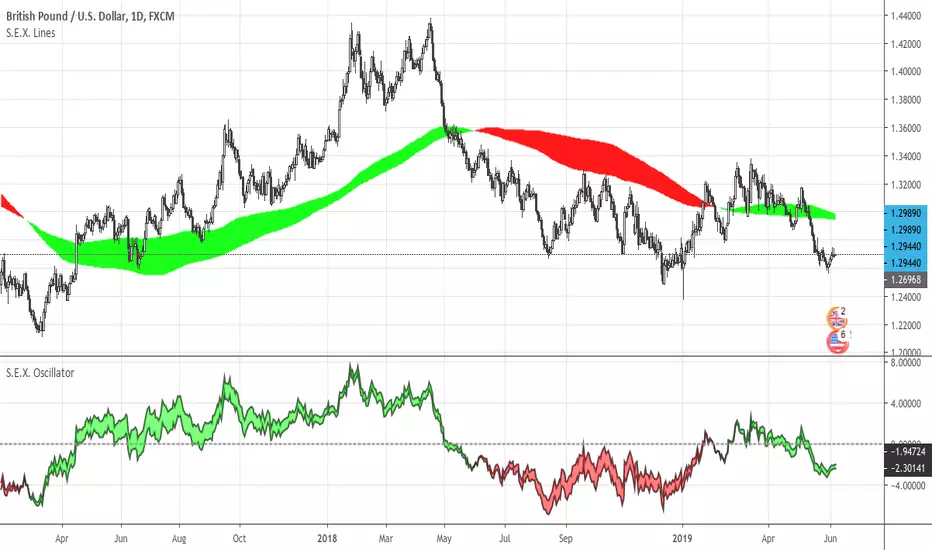
S.E.X. LinesImplementation of S.E.X. Lines as described by Robert Borowski in his book "Forex Sailing".
The indicator allows to plot up to 3 studies, and display them as a Cloud or as Lines.
The indicator allows plotting S.E.X. Lines from higher time frames.
PpSignal Spread Between Stock and Reference Index ALARM
this is the overlay PpSignal Spread Between Stock and Reference Index...

Concurrency Meter ProEvery good forex system has the following basic components:
Ability to recognize the trend direction.
Ability to identify the strength of the trend and answer the basic question
Is the market trending or is it in a range?
Ability to identify safe entry points that will give a perfect risk to reward (RR) ratio on every position.
How Advanced Currency Meter Helps you Achieve These Components
PpSignal Currency Meter Pro is a tool that measures the strength between individual currencies in a pair.

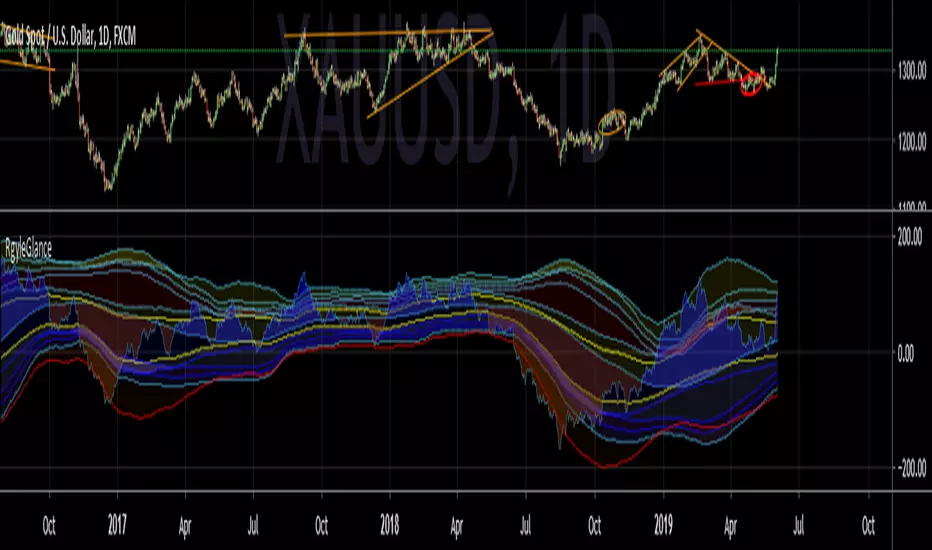
This Indicator Help you to Look at Chart at Glance THE BEST INDICATOR SO FOR CREATED ,
5 YEARS OF TRADING EXPERIENCE
EASILY CAN READ DIVERGENCE ,
TREND,
CAN PREDICT EXIT , ENTRY EARLIER .
I DIDN`T ARRANGED COLORS PROPERLY ,
SPEND SOME TIME USE THE INDICATOR AND READ CHART
IT REALLY HELPS
BestFollowTrendBest for beggining traders.. to follow TRENDS... and Remember.. TREND IS YOURE FRIEND !!!

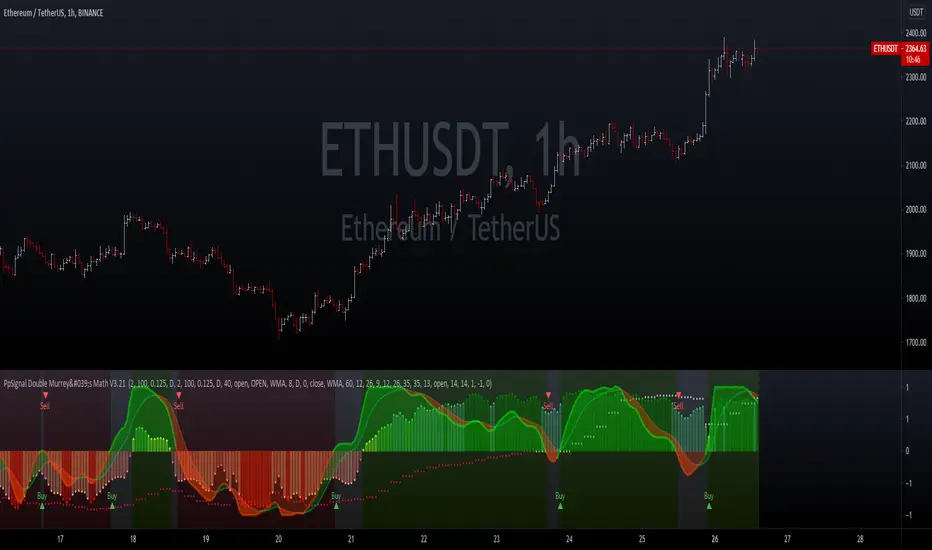
PpSIgnal Murrey's Maththan to @ucsgears, this is the Murray math oscillator, i changed internal atr configuration. the original code you can see in ucsgears profile.
tradingstrategyguides.com
PpSignal Stoch Jake Bernstein , Aroon, Ewo and T3 Velocityfour indicator in one, You can choice in option Stochastic Jake Bernstein Method, Aroon, Ewo or T3 Velocity

PpSignal Double CFBIndicator Version, with alert signal.
//1) Entrada de posicion el primer parametro es que SSMA sea mayor que el precio de apertura (Ema > so1) donde Ema=ssma y so1= al precio de apertura de candle converter
//2) Que el precio de cierre de la vela del time superior representado por candle converter sea mayor a la de apertura sc1>so1
//3) Que bbstop este dando compra Short BB aca le damos entrada a la volatilidad de la desviacion standart.
//4) que cfb este dando compra longCFB aca le damos entrada al la tendecia
// Conclusion, es esta si el precio de cierre de un time superios es > al de apertura (crossover(Ema , so1) y sc1>so1) , pero si y solo si si hay tendecia definida (CFB o longCFBA)
//y volatilidad va en sentido de esa tendecia y acompanando al precio de cierre que sea mayor que el apertura shortb BB nos dara entrada.

[HTI] Hiubris Trend Indicator 1.4Hiubris Trend Indicator is super easy to use.
The Indicator includes Long and Short signals on chart, based on the current Trend direction - These signals can be also set up as Alerts.
It also includes multiple partial Exit Points (Take Profits) that can be used to lock in the profit you have made - These signals can be also set up as Alerts.
The Take Profits have a custom input that can be adjusted by the user regarding the frequency of the take profits - (The risk involved in each trade)
The indicator has a special Stop Loss feature that activates after a certain custom number of Take Profit points passed, locking down your profits you have made so far - These signals can be also set up as Alerts.
Hiubris Trend Indicator is very profitable on higher timeframes (45min, 2h, 4h) - It can also be used on lower timeframes, together with another HigherTimeframe Trend indicator, acting as a filter for the alerts (Ex: Hiubris Long Term Trend)

PpSignal twiggs_money_flowTwiggs Money Flow is my own derivation, based on the popular Chaikin Money Flow indicator, which is in turn derived from the Accumulation Distribution line. We are all indebted to Marc Chaikin and Larry Williams for the contribution they have made to the field of technical analysis and price-volume oscillators.
for more information visite: www.incrediblecharts.com

PpSignal Variable Move Average V 3.0VMA V 3 www.prorealcode.com
Variable Moving Average (VMA) ... Longer-term moving averages are slow to react to reversals in trend when prices move up and down over a long period of time. A Variable Moving Average regulates its sensitivity and lets it function better in any market conditions by using automatic regulation of the smoothing constant.

Scalp TraderA nice strategie for the beginners traders..in order to help see better how to folllow the trend.. because trend is youre friend :)
For access ----> private message.

BOSS Bullish/Bearish Quantitative Qualitative Estimation (QQE)THE BEST FOREX, BINARY OPTIONS, AND CRYPTO INDICATORS FOR TRADINGVIEW.COM
This indicator is comprised by a smoothed Relative Strength Index and two trailing levels, based on volatility – Fast Trailing Level (Fast TL – the maroon line on the chart above) and Slow Trailing Level (Slow TL – the blue line on the chart above).
The two are determined by calculating the Average True Range (ATR) of the smoothed RSI during a specified number of periods, after which a further ATR smoothing is applied with the use of an additional n-periods Wilders smoothing function.
Ultimately, the RSI’s smoothed ATR is multiplied by the Fast and Slow ATR Multipliers in order to determine the final Fast and Slow Trailing Levels.
Trading the QQE buy and sell signals:
Buy Signal
Bullish crossover happens when Fast ATR TL crosses above Slow ATR TL. When this occurs a blue circle & blue candle will appear and a alert signal to buy is generated.
Sell Signal
Bearish crossover happens when Slow ATR TL crosses above Fast ATR TL. When this occurs a maroon circle & maroon candle will appear and a alert signal to sell is generated.
Bullish/Bearish Divergence Background
Green background indicates Bullish Divergence
Red background indicates Bearish Divergence
Overbought and Oversold Conditions
An overbought condition occurs, when the QQE is at or above its 0.10 level.
An oversold condition occurs, when the QQE is at or below its -.10 level.

PpSignal CFB Tren Follow V 1.0 Stock and Indicesthis strategy is based in strong signal of analysis trend (CFB and 2), volatility (ATR & STD Band) and volume.
when we have the first CFB 1 alarm ( green buy signal) we must wait until the price breaks out the upper band of the ATR MA, you have atr alarm ma option signal in the setup of indicator.
we can enter in the 3rd time when the cfb 2 give you the 3 signal blue buy color alarm.
The indicator also has an exit alarm option when the price goes into the ATR band.
It also has a smoothed W% alarm.
enjoy it

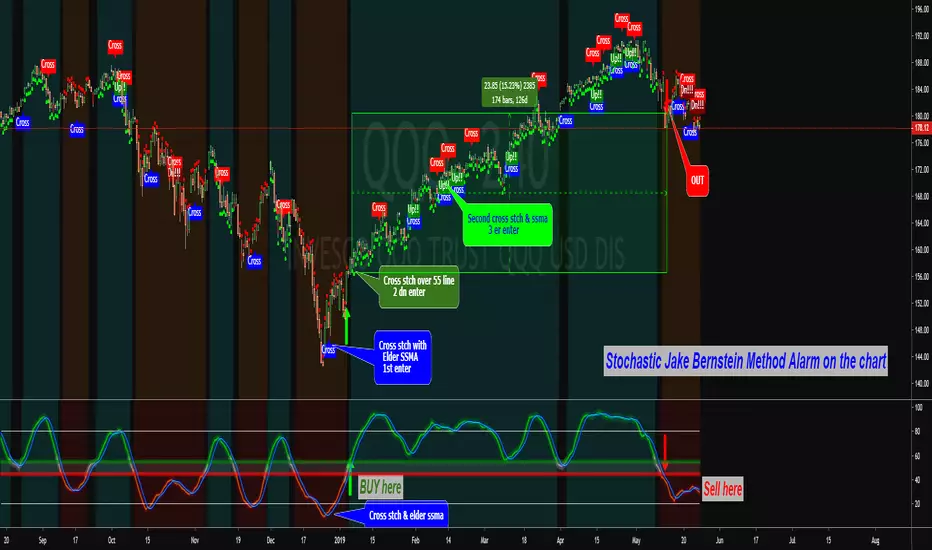
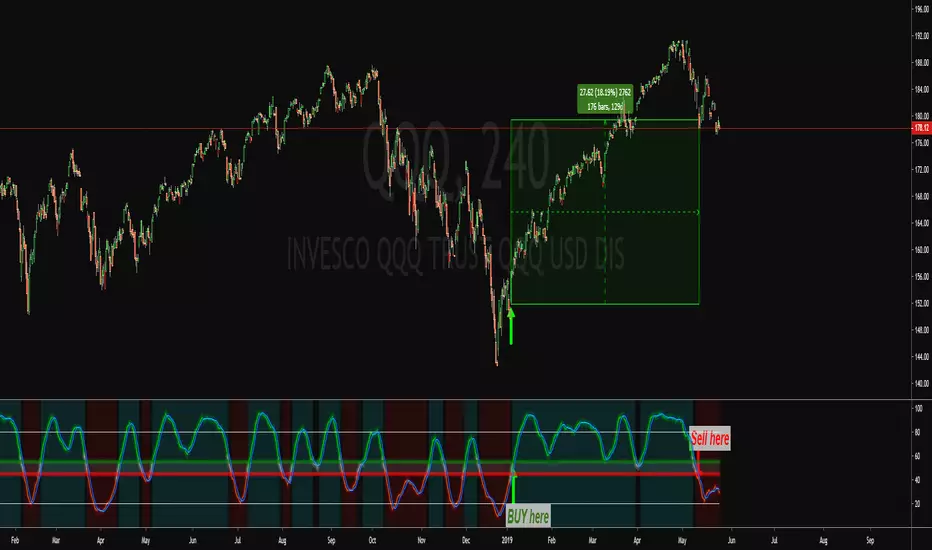
PpSignal Stochastic Jake Bernstein Method V 1.0 ALARM VERSIONAmazing Jake Bernstein Stochastic .
Buy when the price is above 55 and sell when the price is below 45.
Have MTF option.
For more information please visit stockcharts.com
PpSignal Stochastic Jake Bernstein Method V 1.0Amazing Jake Bernstein Stochastic.
Buy when the price is above 55 and sell when the price is below 45.
Have MTF option.
For more information please visit stockcharts.com
BOSS Smooth Stochastic RSI Histogram Oscillator With Alerts THE BEST FOREX, BINARY OPTIONS, AND CRYPTO INDICATORS FOR TRADINGVIEW.COM
Our smooth stochastic rsi in column form with buy and sell alerts.


PpSignal Random Walk Monte Carlo MethodRandom Walk Utility
The random walk generator allows users of the Monte Carlo to further understand how the Monte Carlo projection is generated by creating a visual representation of individual random walks. Trends that occur on the random walks may correlate to the historical price action of the underlying security.
Understanding the Random Walk Simulation
This indicator randomly generates alternative price outcomes derived from the price movements of the underlying security. Monte Carlo methods rely on repeated random sampling to create a data set that has the same characteristics as the sample source, representing examples of alternate outcomes. The data set created using random sampling is called a “random walk”.
First, every bar in the time stamp is measured logarithmically and put into a population.
Then, a sample is drawn at random from the population and is used to determine the next price movement of the random walk. This process is repeated fifteen times to visualize whether the alternative outcomes lie above or beneath the current market price of the security.

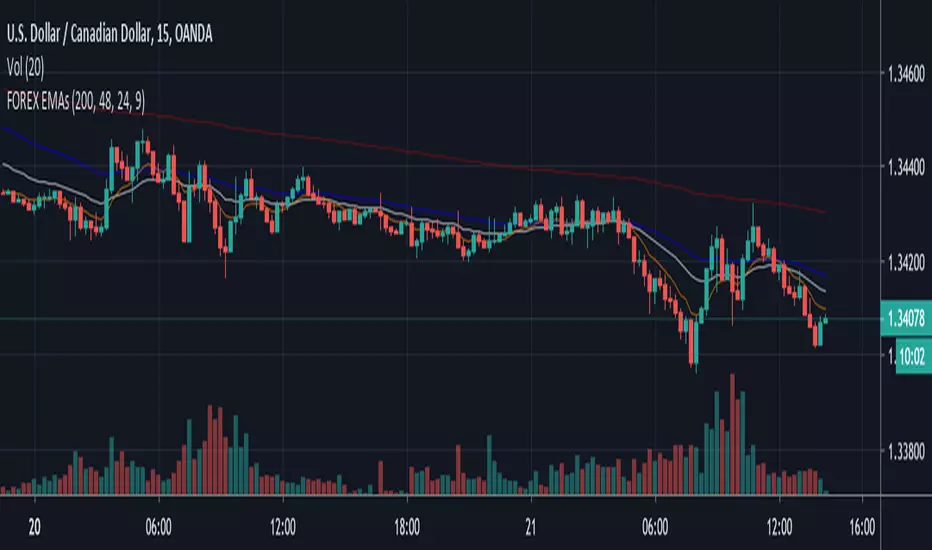
FOREX EMAsPretty simple here - this is the base EMAs I suggest most traders use in the FOREX market for swings and scalp trading. Works well on 5m, 15m, 1H, 4H, and daily trading if you design an edge to interpret the relationship these averages of price are telling you.
The 9EMA is not as valuable on the 1HR timeframe.