Scalping Sheriff Strategy TraderReceive alerts for Long and Short Scalp trades.
Inspired by the RSI Sheriff Strategy
Forex

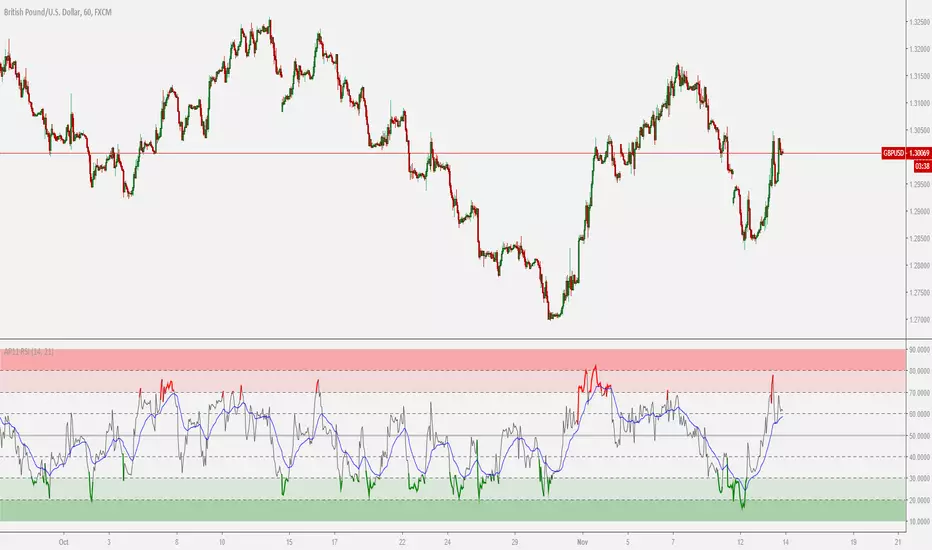
TTM Apollo 11 RSIColor coded RSI to give a better indication of when to buy or sell based on the RSI level along with an included EMA signal to help describe the trend.
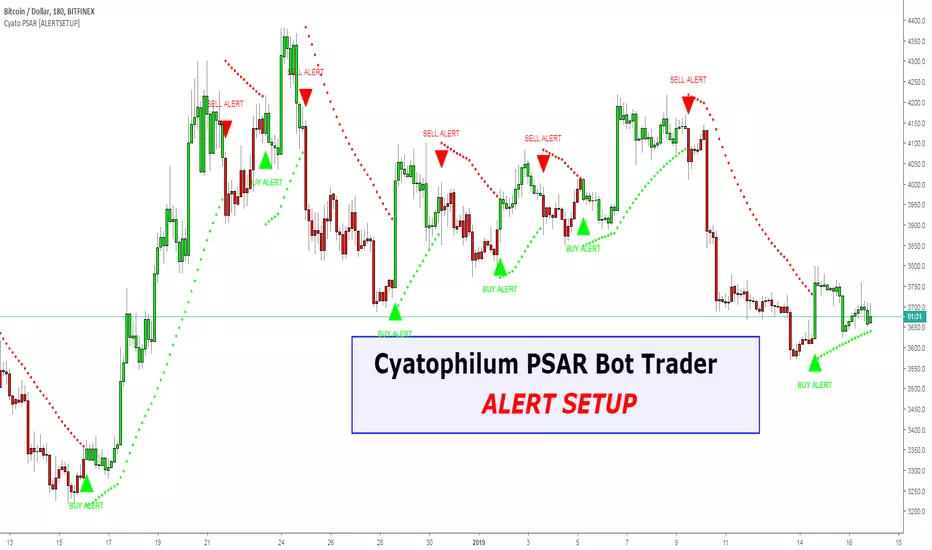
Cyatophilum Trend IndicatorHOW TO USE
Step 1 : Adjust the Trend Parameter to the most profitable number.
Step 2 : Create Automatic Alerts for Buy (L) and Sell (S) signals.
BONUS :
Trend horizontal Line: Use this line to avoid risky trades.
Get This Indicator Today!
Purchase at blockchainfiesta.com
SAMPLE USE CASES
BTCUSD 1 D
BTCUSD 4 h
ETHUSD 1 D
ETH/BTC 1 D
Get This Indicator Today!
Purchase at blockchainfiesta.com
View a video tutorial on how to use this indicator at the link above.
Have Fun !
Extreme Trend Amplifier (ETA)Introduction
This indicator was created in V3 Pinescript and all projections will be displayed in real-time for active trading use.
This indicator has been designed so that it can be used across a range of securities such as equities, bonds, FX and cryptocurrencies.
All time-stamps are supported.
Comment and Like to try it out!
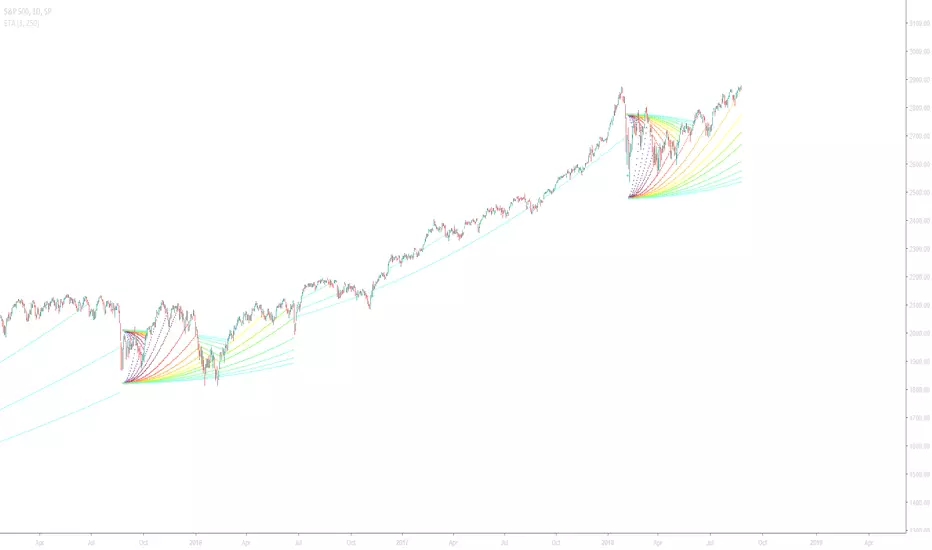
Understanding the Extreme Trend Amplifier
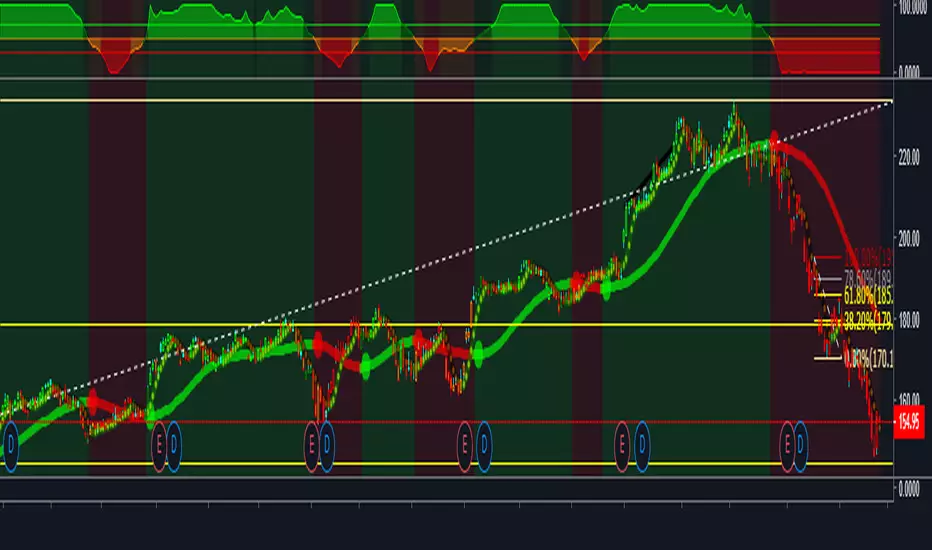
Extreme price changes are often result in a change of trend. This indicator not only allows you to identify the breakout, but to follow the direction of the change. Below is an example of the indicator using normal input values and the Dark TradingView Theme.
The Extreme Trend Amplifier is an indicator that measures the rate of change within a bar of the time stamp and plots a function when the user-defined threshold has been breached. The plot projects parabolic lines that squeeze towards the market price at an ever-increasing rate. The acceleration can also be defined in the indicator settings panel.
Indicator Utility
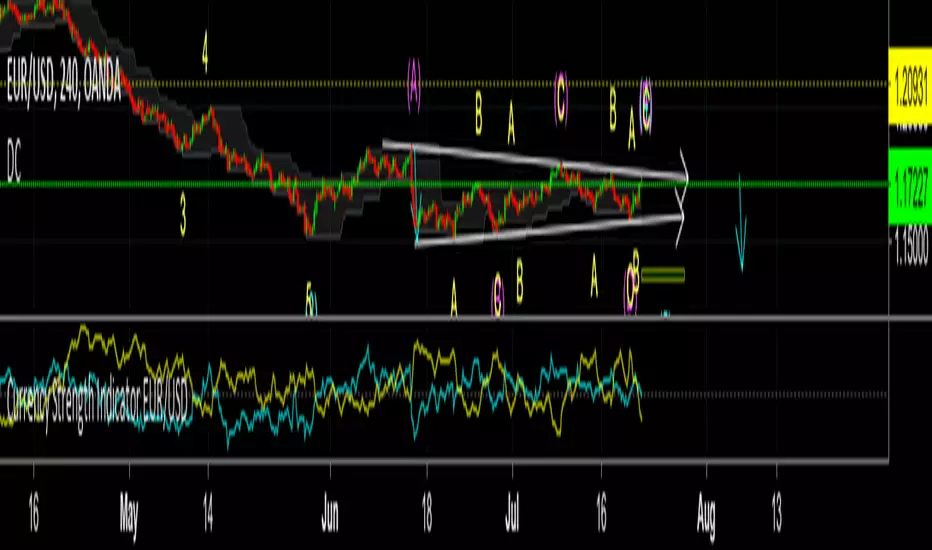
The first example below is the forex pair, AUD/USD using a rate threshold of 1% and an acceleration factor of three and the second using a rate threshold of 0.8% and an acceleration factor of nine.
We can observe that an increased rate threshold results in fewer instances and that a higher acceleration factor results in the instance projecting farther.
Notice that the acceleration factor is inversely related.
Input Values
Select the “ Format ”, button located next to the indicator label to adjust the input values and the style.
Rate of change (ROC) is the percentage rise/fall of the security within the time stamp. If ROC is set to 1, this is directly proportionate to 1%.
Securities such as cryptocurrencies are very volatile and will require an increased threshold.
Forex pairs will require a reduced threshold in order to produce an output as volatility is far less.
The line color, thickness and style can also be personalised to customise the strategy even further.
In this example, I have adjusted the projected instance that appears below the bars blue and above the bars red, indicating an uptrend or downtrend.
It is also possible to change specific bars in order to identify the extent to which a trend has continued as seen below.
If you would to find out more about this indicator, visit www.kenzing.com
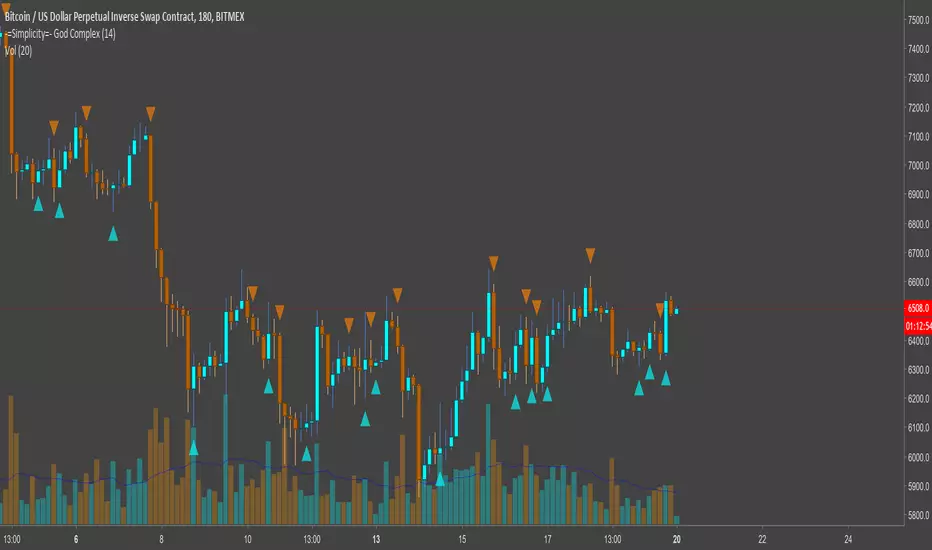
-=Simplicity=- God ComplexMaking money is simple when you wield untold power
-=Simplicity=- God Complex is a non-repaint, set-and-forget indicator for identifying optimum times to enter and exit the market, with both longs and shorts.
Applicable to any asset-type, market, candle type and timeframe, God Complex is a quintessential tool for both new and veteran traders.
With only one variable to change it will take a minimal amount of time to find a value that suits you. As a rule of thumb, the higher the value the less it will fire signals, but the safer those signals will be.
You can also opt to only enable 'Long' or 'Short' signals on the chart. This is meaningful when trading leverage or margin along trend that you are able to identify.
This can be used as a guide for manual trading, but is best utilized as a tool for automating trades so that you don't miss out on any market activity.
This is a link to a document elucidating a little more on the script: docs.google.com
---------------------
Here are a few charts showing how the script performs against them. Enjoy.
Below is a chart depicting XBTUSD (BitMEX) on a 30M timeframe. Both longs and shorts are enabled and the variable is set to a value of 144.
Below here we have a chart for BNBBTC (Binance) on a 1HR timeframe with variable set to a value of 14 on Heikin Ashi candles. Large orange arrows are shorts and smaller blue arrows are closing shorts. There's a clear downtrend, hence we're only shorting.
This is EOSBTC (Bitfinex) on a 2HR timeframe with a variable set to 7 on Renko charts. Small orange arrows are exiting a long position and large blue arrows are entering a long position. The uptrend is obvious to see, so that's why we're mainly displaying longs here.
Not that I reccommend anyone to trade such a small timeframe, but this is for all you scalpers out there. XBTUSD (BitMEX) on a 1M timeframe with a variable value of 233. Both longs and shorts are enabled for this chart. Normal bar candles apply.
Finally, this is ARKBTC (BitTrex) on a 2HR timeframe against a 500R chart with a variable of 377. Only shorts are enabled, as we're in a downtrend.
---------------------
Please contact @overttherainbow on Telegram if you'd like to discuss anything, alternatively reach out to me here (although Telegram is better for a quick response; I'll be around 9AM-11PM GMT)
Forex Scalping Pro [PlungerMen]Hello!
This free community edition is very good for all time frame , for all the crypto
This Script recognized overbought area and over-selling area extremely accurate
This Script is very well used as it works by itself and very well used in conjunction with the "Forex scalping " script, both compliment for each other. the "Forex Scalping" script is Free, you can find it
If you want to be more accurate and more efficient, more comfortable when you do not want to see too many other indicators, you can register for our Professional edition.
- The Professional Edition supports Level 1 and Level 2 commands, which are very effective in allocating funds and optimizing your profits
Besides that,You will be supported by personal preferences, profit maximization
- Register for a Professional version will be used 2 Script,Bimex Scalping Pro and Bitmex Long Short Pro
- We will invite you to the signal channel with the announcement of the bottom and the peak of the BTC 0.33% ,the big variable variable has exists
We hope you enjoy this script. Your support will help us develop more good quality scripts in the future to serve the community
**Remember, Like this script and posivite feedback if you are satisfied**
if you have any questions Plz 0.00% post a comment ... below here

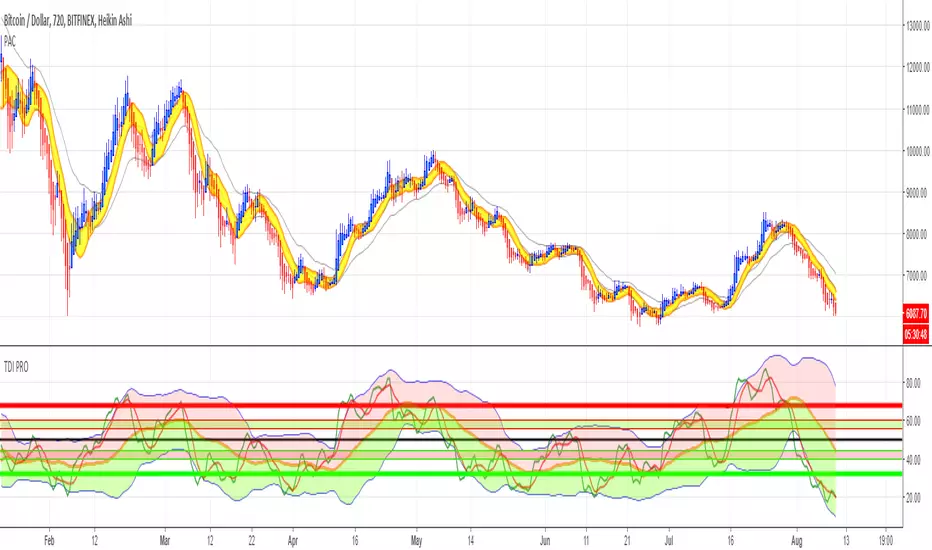
Price Action Channel ( PAC ) - Restoration by YardleyRosetteOriginal script PACMASTER by JustUncleL.
I (YardleyRosette) have republished this indicator with the fixed and optimal settings nearest to MetaTrader4 Traders Dynamic Index ("SYNERGY") Price Action Channel.
Therefore I feel I have to accredit myself for selecting the optimal settings as best intended by CompassFX .
Basic Rules:
Solid filled Heikin Ashi above (golden) yellow PAC indicates strong upmove, trend trade ( Buy ). Solid filled Heikin Ashi under (golden) yellow PAC indicates strong downmove, trend trade ( Sell ).
Weak Heikin Ashi bars signal weakness as if of ranging/consolidating market conditions, especially when price is within PAC . This is an alert zone in which not to trade or to close trade for possible reversed direction.
2nd Channel made for assistance due to the unfixable precision settings when compared to MetaTrader4's Price Action Channel. MT4 displaces PAC in a certain manner TradingView has no script for programming.

SignalToSignal.com - Logical Volume Trading SystemOur Logical Volume Trading System is a vast improvement on ‘standard’ volume spread analysis. Based on 15+ year combined experience with our Smart Volume Spread Analysis software, we have refined our analysis and algorithms to provide the most powerful VSA indicator on TradingView.
Combining fundamental analysis, technical analysis, and volume analysis into a powerful methodology that enables you to trade the markets in a way that is uniquely accurate.
The Signal to Signal Logical Volume Trading System quickly handles time-consuming manual background analysis, volume analysis, and signal analysis leaving you free to make considered and knowledgeable trading decisions instantly.
We have refined our price action and volume analysis algorithms to focus on the core trading signals, which often precede large moves, providing you with clear insight and a roadmap to trading successfully.
Due to unique characteristics of the Pine programming language that TradingView indicators utilize, we have also made adjustments to the signal validation and advisor systems. The result is a clean, easy to read chart which allows you to recognize strong setups as soon as they form.
Lastly, our Logical Volume Trading System is customizable. You can choose which signals and advisor warnings are enabled, allowing you test any number of ideas and analysis combinations. Of course the system is optimized for most charts by default so you can get started right away.
To gain access to the Logical Volume Trading System, please visit our website .
If you have any questions, please contact us through the Contact link on our website - signaltosignal.com

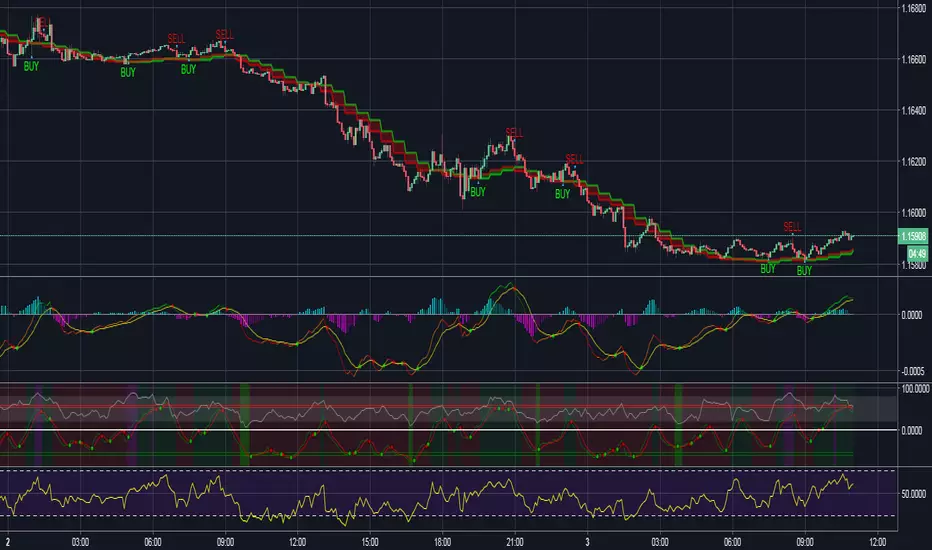
Forex Signal buy sell Pro [PlungerMen]Forex Signal buy sell Pro , mix 2 indicaror in it for exactly Signal
This Script is perfectly functional and works well by me and the best way to use this script is to use it with “Long Short" script, both compliment for each other. the "Long Short" script is Free, you can find it by searching
If you want to be more accurate and more efficient, more comfortable when you do not want to see too many other indicators, you can register for our Professional edition.
- The Professional Edition supports Level 1 and Level 2 commands ( display at chart : LONG+, long-, SHORT,+,short- ), which are very effective in allocating funds and optimizing your profits
Besides that,You will be supported by personal preferences, profit maximization -2.64% -1.30% -3.21% -3.33% -3.27% Scalping Pro and B Long Short Pro
- We will invite you to the signal channel Telgram with the announcement of the bottom and the peak of the BTC -2.64% -1.30% -3.21% -3.33% -3.27% 0.60% -0.13% ,the big variable variable has exists
**We hope you enjoy this script. Your support will help us develop more good quality scripts in the future to serve the community **
**Remember, Like this script and posivite feedback if you are satisfied**
if you have any questions, post a comment ... below here
*********** Guide:
+ option for all frames : Click setting and input high and low for time inteval
+ hide wave trend : Click setting -> click Style --> Up trend Fill or Down trend fill
******
New features: this time we add two lines that can help traders trader safer. When the red line cross above the green line means we are in the downtrend and when the green line cross above the red line, which means we are in a uptrend. This new features will help traders do a safer trade at small time frame.
We have the Script free for the user pass, search keyword " Bitmex Scalping PlungerMen"
-->> 0.2 eth/1 month will be used Script: BForex Signal buy sell Pro an Super Bot alert telegram <--
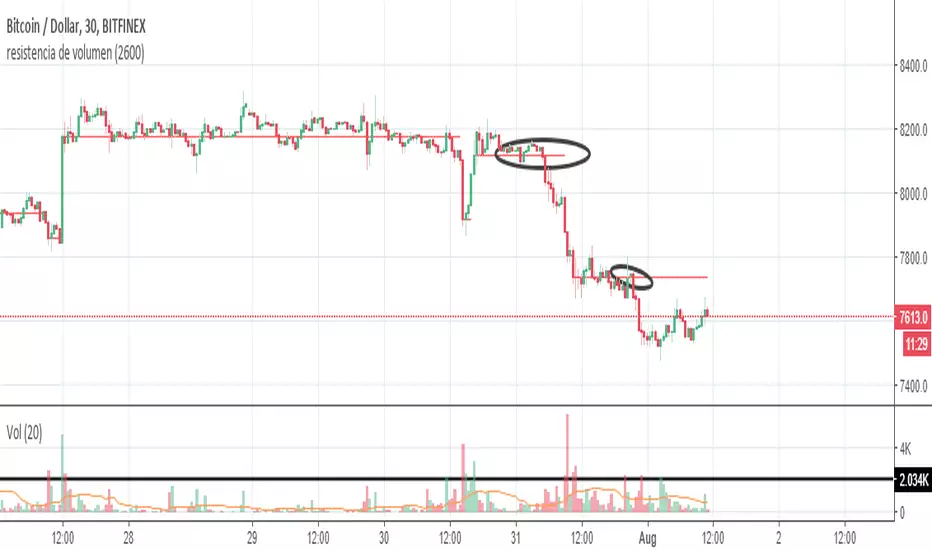
Resistance of VolumeIt is used to detect volume resistors in a personalized way, since it allows the user to enter the volume in which he wishes the resistance to jump automatically.
It does not mark the black line and the graphic that's just to help understand how it works
in the above image can see the indicator works on 30 minutes chart
in the above image can see the indicator works on 5 minutes chart
therefore, it can be configured to go through several temporalities.
Forex Trade Sessions / Zones + Next Session VisibleAllows User To See Next Session.
Contains all 5 Forex Sessions: New York, London, Frankfurt, Asia (Tokyo), Sydney
Warning! A little buggy on smaller time frames like the 5 minute. 15 minute seems to work fine!

Ppsignal Laguerre RSIThis id ppsignal laguerre indicator, buy when the price crosse abaove 50%, lime color, and sell when the price cross down 50% rec color signal.


Trendster v1.0The Trend Is Your Friend
Trendster v1.0 will give you simple areas of possible entries (both long and short) in order to jump on board new trends early and stay in the trade for maximum profit. Can be used with most assets including equities, FOREX and cryptocurrencies. Alerts can be created from this indicator allowing for better manual trade timing or autotrading. Happy trading!

Signal StreamSIGNAL STREAM
Want a TL;DR?
Signal Stream gives you actionable trading signals. It’s as simple as that.
LONG ANSWER
Signal Stream is the culmination of years and years of research, testing, and analysis of The Big Three data points of market information.
• Major Data Point One – PRICE. The one everyone cares about most.
• Major Data Point Two – TIME. We’re all bound by it. We can’t escape it.
• Major Data Point Three – VOLUME. With this third point, the market takes on an entirely new dynamic.
Signal Stream takes these points into account, runs them all through tested (ridiculously so) algorithms based of our knowledge and experience trading.
The result? Clean, actionable signals you can trade.
Primarily used on and around the 1 hour time frame. That’s the power of TradingView! So many custom time frames to look at!
Blue arrow pointing up? Go long!
Red arrow pointing down? Go short!
SIMPLY PRESENTED – COMPLEXITY HIDING UNDER THE HOOD
To be perfectly clear, this isn’t some script that does a couple MA crossovers and checks RSI against the Elliot Wave Fib Zig Zag on a Bollinger Band.
Signal Stream is 2000+ lines of tested, rigorous logic built in Pine for TradingView.
It’s based on a method of price action and volume analysis that has been proven profitable over and over for the past 10 years.
What method exactly? Weeeeell…. That’s our secret sauce. :)
But it’s a secret sauce developed over the past ten years by traders with a combined 25+ years in trading and trading system development.
We’ve refined our analysis of PRICE and TIME and VOLUME.
It’s a little bit like if pattern analysis and VSA had a kid and then taught that kid a lot of other really important market confluence ideas.
Okay, maybe that analogy got away from me….
Signal Stream is hours and and days and weeks and months and years spent in front of charts, writing code, staring at spreadsheets, testing, refining, and trading.
All distilled into a simple, power signal system.
SIGNAL STREAM GUARANTEE - NOT GONNA GIVE YOU THE RUN AROUND
Look, I can’t guarantee you will make money. That’s not only illegal, it’s also a ridiculous promise and absolutely a red flag. Anyone guaranteeing that you will make money is probably selling you snake oil and you should steer clear of them.
What I can guarantee is that there is no other indicator on TradingView right now that looks as deeply into PRICE, TIME, and VOLUME as Signal Stream does.
I guarantee you that Signal Stream provides clear, actionable signals based on 25+ years of experience and 10+ years of hardcore testing and live trading.
PM US TO GET PAYMENT INSTRUCTIONS AND ACCESS.

Ppsignal Average True Range IndicatorPpsignal atr measures candle true ranges when there are a breakdown o breakout of range, we have a buy or sell signals


Ppsignal Smoothed Heiken Ashi CandlesPpsignal smotthed double haiken ashi candles, buy when price is over to Ppsignal smoothed 8 17, and sell when the price is down haiken ashi smoothed 8 17.
BTCU

Alejandro Tilson MTFWe have the tilson moving average, buy when the price is on of Tilson 39 y sell when the preci move down to Tilson 39.
You van do it swimg trading with the tilson 17/3.
