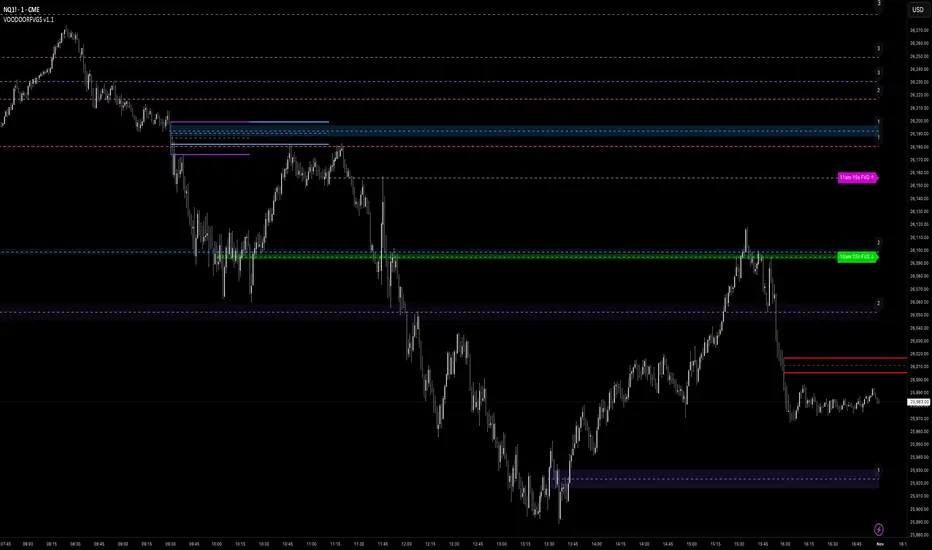
Supply/Demand HTF (RBD/DBR) – FIX + DebugOverview:
This indicator automatically detects and plots institutional supply and demand zones on any timeframe.
It analyzes price action to identify Drop-Base-Rally (DBR) and Rally-Base-Drop (RBD) structures — the core formations of supply and demand trading.
How It Works
1. The script scans price candles to detect “base” formations — small consolidation candles between impulsive moves.
2. When it finds a valid base followed by a strong move, it marks that area as:
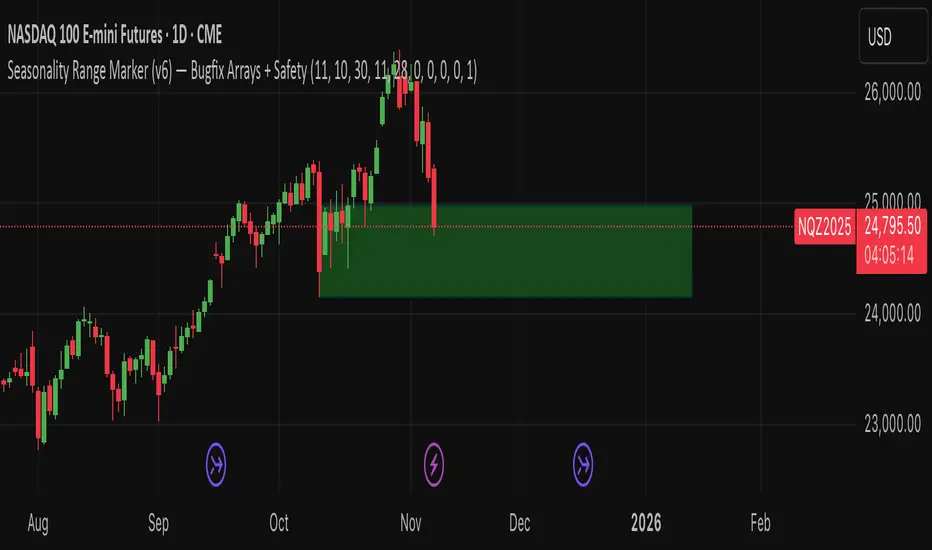
• 🟩 Demand Zone (DBR): price dropped → consolidated → rallied upward
• 🟥 Supply Zone (RBD): price rallied → consolidated → dropped downward
3. Each detected zone is extended to the right so you can see if price returns to it later.
Color
Meaning
Description:
🟩 Green Zone
Demand
Institutional buy area (potential bullish reversal)
🟥 Red Zone
Supply
Institutional sell area (potential bearish reversal)
🟦 Blue Box
(Debug) HTF candle box used for internal analysis — can be hidden
🟡 Yellow Fill
Zone has been touched by price (reactivated)
Usage
• Works best when detecting zones from H4 or H1 and trading confirmations on M5 or M15.
• Ideal for institutional-style or “Smart Money Concepts” traders.
• Zones are auto-updated as new structures appear.
Indicatore Pine Script®