FX OSINT - Institutional Midnight Intelligence For ForexFX OSINT — Institutional Midnight Intelligence For Forex
See Your FX Charts Like an Intelligence Briefing, Not a Guess
If you’ve ever stared at EURUSD or GBPJPY and thought:
Where is the real liquidity?
Is this move sponsored by smart money or just noise?
Am I buying into premium or discount?
…then FX OSINT is designed for you.
FX OSINT (Forex Open Source Intelligence) treats the FX market the way an analyst treats an investigation:
Collect open‑source signals from price, time, and volatility.
Map out liquidity, structure, and sessions in a repeatable way.
Present them in a clean, non‑cluttered dashboard so you can read context quickly.
No rainbow spaghetti. No 12 indicators stacked on top of each other. Just structured information, midnight visuals, and a clear read on what the market is doing right now.
Why FX OSINT Exists
Many FX traders run into the same problems:
Overloaded charts – multiple indicators fighting for space, none talking to each other.
Signals with no context – arrows that ignore structure, sessions, and liquidity.
Tools not tuned for FX – generic indicators that don’t care what pair you are on.
FX OSINT brings this together into one FX‑focused framework that:
Understands structure : BOS/CHOCH, swings, and trend across multiple timeframes.
Respects liquidity : sweeps, order blocks, and FVGs with controlled visibility.
Reads volatility & ADR : how far today’s range has developed.
Knows the clock : London, New York, and key killzones.
Scores confluence : a 0–100 engine that summarizes how much is lining up.
FX OSINT is built for traders who want structured, institutional‑style logic with a disciplined, midnight‑themed UI —not flashing buy/sell buttons.
1. Midnight Dashboard — Top‑Right Intelligence Panel
This panel acts as your compact “situation room”:
CONFLUENCE — 0–100 score blending trend alignment, volatility regime, sessions, liquidity events, order blocks, FVGs, and ADR context.
REGIME — Low / Building / Normal / Expansion / Extreme, driven by ATR relationships, so you know if you’re in chop, trend, or expansion.
HTF / MTF / LTF TREND — Higher‑, medium‑, and current‑timeframe bias in one place, so you see if you are trading with or against the larger flow.
ADR USED — How much of today’s typical range has already been consumed in percentage terms.
PIP VALUE — Approximate pip size per pair, including JPY‑style pairs.
Everything is bold, legible, and color‑coded, but the layout stays minimal so you can:
Look once → understand the context.
2. Structure, BOS, CHOCH — Smart‑Money‑Style Skeleton
FX OSINT tracks swing highs and lows, then shows how structure evolves:
Trend logic based on evolving swings, not just a moving average cross.
BOS (Break of Structure) when price expands in the direction of trend.
CHOCH (Change of Character) when behavior flips and the market structure changes.
Labels are selective, not spammy . You don’t get a tag on every minor wiggle—only when structure meaningfully shifts, so it’s easier to answer:
"Are we continuing the current leg, or did something actually change here?"
3. Liquidity Sweeps, Order Blocks & FVGs — The OSINT Layer
FX OSINT treats liquidity as a key information layer:
Liquidity sweeps — Detects when price spikes through recent highs/lows and then snaps back, flagging potential stop runs.
Order blocks — The last opposite candle before a displacement move, drawn as controlled boxes with limited lifespan to avoid clutter.
Fair Value Gaps (FVGs) — Three‑candle imbalances rendered as precise zones with a cap on how many can exist at once.
Under the hood, boxes are managed so your chart does not become a wall of old zones:
// Draw Order Blocks with overlap prevention
if isBullishOB and showOrderBlocks
if array.size(obBoxes) >= maxBoxes
oldBox = array.shift(obBoxes)
box.delete(oldBox)
newBox = box.new(bar_index , low , bar_index + obvLength, high ,
border_color = bullColor, bgcolor = bullColorTransp,
border_width = 2, extend = extend.none)
array.push(obBoxes, newBox)
Box limits keep the number of zones under control.
Borders and transparency are tuned so you still see price clearly.
You end up with a curated liquidity map , rather than a chart buried under every level price has ever touched.
4. Volatility, ADR & Sessions — Time and Range Intelligence
FX OSINT runs a Volatility Regime Analyzer and an ADR engine in the background:
Volatility regime — Five states (Low → Extreme) derived from fast vs. slow ATR.
ADR bands — Daily high/mid/low projected from the current daily open.
ADR used % — How far today’s move has traveled relative to its typical range.
On the time side:
Asia, London, New York sessions are softly highlighted with a single active background to avoid overlapping colors.
Killzones (e.g., London and New York opens) can be emphasized when you want to focus on where significant moves often begin.
Together, this helps you answer:
"What time is it in the trading day?"
"How stretched are we?"
"Is expansion just starting, or are we late to the move?"
5. ICT‑Style Add‑Ons — BOS/CHOCH, Premium/Discount, and Confluence
For modern FX / ICT‑inspired workflows, FX OSINT includes:
BOS / CHOCH labels — Clear structural shifts based on swings.
Premium / Discount zones — 25%, 50%, 75% levels of the daily range, so you know if you are buying discount in an uptrend or selling premium in a downtrend.
Confluence score — A single number summarizing how many conditions line up in the current context.
Instead of replacing your plan, FX OSINT compresses your checklist into the chart:
Structure
Liquidity
Session / Time
Volatility / ADR
Higher‑timeframe alignment
When these agree, the dashboard reflects it. When they don’t, it stays neutral and lets you see the conflict.
How To Use FX OSINT
FX OSINT is not a signal bot. It is an information engine that organizes context so you can apply your own plan.
A typical workflow might look like:
Start on higher timeframes (e.g., H4/D1) to form directional bias from structure, volatility regime, and ADR context.
Move to intraday timeframes (e.g., M15/H1) around your chosen sessions (London and/or New York).
Look for confluence :
HTF / MTF / LTF trends aligned.
Price in discount for longs or premium for shorts.
Recent liquidity sweep into a meaningful OB or FVG.
Confluence score at or above a level you consider significant.
Then refine entries using BOS/CHOCH on lower timeframes according to your own risk and execution rules.
FX OSINT aims to make sure you do not enter a trade without seeing:
Where you are in the day (ADR and sessions).
Where you are in the volatility cycle (regime).
Who currently appears in control (structure and trend).
Which liquidity was just targeted (sweeps and zones).
Design Choices and Scope
FX OSINT was designed around a few clear constraints:
FX‑focused — Logic and filters tuned for FX majors, minors, exotics, and metals. It is intended for FX markets, not for every possible asset class.
Open‑source — The full Pine Script code is available so you can read it, learn from it, and adapt it to your own workflow if needed.
Clear themes — Two main visual styles (e.g., dark institutional “midnight” and a lighter accent variant) with a focus on readability, not visual noise.
Chart‑friendly — Panels use fixed areas, session highlights avoid overlapping, and boxes are capped/pruned so the chart remains usable.
FX OSINT is for only Forex pairs, not anything else!
Hope you enjoyed and remember your Open Source Intelligence Matters 😉!
-officialjackofalltrades
Fxtrading

Lot Size Calculator for FX(JPY Base)-By Jason v1.1 ロッド自動計算ツール🧭概要
このインジケーターは、日本円口座で取引するFXトレーダー専用に設計されたロットサイズ自動計算ツールです。
クロス円だけでなく、ドルストレート通貨ペア(EURUSD・GBPUSD・など)も自動換算に対応。
リアルなJPY換算ベースで、リスクとロットを正確に可視化します。
🎯 主な特徴
✅ JPY自動換算対応
ドルストレート・クロス円ペアを問わず、リアルタイムでJPYベースに換算。
✅ リスク/リワード自動計算
口座残高・ストップロス・リスク割合・固定損失額からロットサイズを即時算出。
✅ 証拠金維持率 / 実効レバレッジ表示
過剰エントリーを防ぎ、リスクを数値で管理。
✅ パネル表示を自由カスタマイズ
* 表示項目を個別にON/OFF可能
* 項目名(ラベル)を自分の言葉に変更可能
* パネル位置・文字サイズ・色・背景も自由設定
✅ 日本口座仕様に最適化
DMM、GMO、外為どっとコムなどJPY建て口座での取引計算に完全対応。
💡 推奨リスク管理ルール(プロトレーダー実践例)
プロ仕様のトレードは、「勝つこと」より「失わないこと」を最優先に行われます。
安定して利益を積み上げるトレーダーは、常に明確なリスク基準をもって行動します。
以下は、その代表的なリスク管理ルールです。
📉 連敗時のリスクコントロール(防御モード)
* 1トレードあたり口座残高の1%以下に抑える
* 連続2~3敗でリスクを半分(例:1%→0.5%)に下げる
* 1日の最大損失率を 3〜5%以内に制限(到達したらその日は終了)
* 「メンタルドローダウン」を避けるために連敗日翌日は休むことも多い
📘 目的:生き残ること。資金を守ることが最大の攻撃。
📈 連勝時のリスクコントロール(拡張モード)
* 2連勝以上の場合、**リスクを段階的に拡大(例:1%→1.5%)**
* ただし、最大でも3%以内
* リワードが積み上がっている時にのみ増加させる(利益分をリスクに再投資)
📘 目的:勝っている時にリスクを“複利的”に活かすが、ルール内にとどめる。
🧠 デイリーマネジメントルール(プロ基準)
1トレードリスク : 1〜2%以内
1日最大損失 :3〜5%以内
1週間最大損失 : 10%以内
リスクリワード比 :最低 1 : 2(理想は 1 : 3 以上)
勝率の目安 : 40〜50%でもRR管理で黒字維持可能
⚙️ このツールを使う理由
このロット計算機を使えば、
「感覚的なロット設定」から「数値的なリスク管理」へ進化できます。
✅ 過剰ロット防止
✅ 損失率の明確化
✅ 勝ち負けのバランス最適化
✅ 冷静なトレード継続が可能に
🧩 使い方
1️⃣ チャートにインジケーターを追加
2️⃣ 「口座残高」「リスク割合」「ストップロス(pips)」を設定
3️⃣ 「ロットサイズ」欄の数値が、**最適ロットサイズ**
4️⃣ リスク指標(証拠金維持率・実効レバレッジ)をチェック
⚠️ 免責事項
このインジケーターは教育目的の補助ツールです。
最終的な売買判断はご自身の責任で行ってください。
---
🧾 クレジット
Developed for Japanese Traders 🇯🇵
Optimized for FX Based Risk Control
Created by
💬 まとめ
資金を守ることは「守り」ではなく、次のチャンスに立ち続けるための最強の戦略です。
リスクを管理できる者だけが、長期的に勝ち続けることができます。
🧩 今後について
このインジケーターは、今後も使いやすさと精度を追求しながら改善を続けていきます。
もちろんです。以下は、あなたの日本語説明文を**自然でプロフェッショナルな英語**に翻訳したものです。
TradingViewのインジケーター説明欄にそのまま使えるトーン(ややフォーマル+分かりやすい)で整えています👇
---
🧭 Overview
This indicator is a **lot size auto-calculator** designed specifically for **FX traders using Japanese Yen (JPY) accounts**.
It automatically converts values not only for JPY crosses but also for **USD-based pairs (e.g., EURUSD, GBPUSD, etc.)**,
providing precise **risk and lot visualization in real JPY terms**.
🎯 Key Features
✅ **Automatic JPY Conversion**
Real-time JPY-based conversion for both USD and JPY pairs.
✅ **Risk / Reward Auto Calculation**
Instantly calculates the optimal lot size based on account balance, stop loss, and defined risk percentage or fixed loss.
✅ **Margin Maintenance Rate / Effective Leverage Display**
Prevents over-leveraging and allows you to monitor your risk numerically.
✅ **Fully Customizable Panel Display**
* Enable or disable each display item individually
* Rename labels freely to your preferred wording
* Adjust panel position, font size, colors, and background
✅ **Optimized for Japanese Brokerage Accounts**
Fully compatible with major JPY-based brokers such as **DMM, GMO, and Gaitame.com**.
💡 Recommended Risk Management Rules (Professional Trader Practices)
Professional trading prioritizes **“not losing” over “winning.”**
Consistent traders operate with a clear and disciplined risk framework.
Here are the most common examples of professional risk management rules:
📉 Loss Streak Risk Control (Defensive Mode)
* Keep risk per trade below **1% of account balance**
* After **2–3 consecutive losses**, reduce risk by half (e.g., 1% → 0.5%)
* Limit daily loss to **3–5%** — stop trading once reached
* Take a break after a losing streak to avoid **mental drawdown**
📘 **Objective:** Survival first. Protecting capital is the strongest form of offense.
📈 Win Streak Risk Control (Expansion Mode)
* After 2 consecutive wins, **gradually increase risk (e.g., 1% → 1.5%)**
* Never exceed **3% total risk per trade**
* Only scale up when trading with accumulated profit — reinvest from gains, not from capital
📘 **Objective:** Use profits to grow risk *compoundedly*, but always within defined limits.
🧠 Daily Risk Management (Professional Standards)
Risk per trade : 1–2% of account balance
Max daily loss : 3–5%
Max weekly loss :10%
Minimum R:R ratio : 1 : 2 (Ideal: 1 : 3 or higher)
Profitability baseline : 40–50% win rate can still stay profitable with proper R:R control
⚙️ Why Use This Tool?
This calculator helps you shift from **“emotional lot sizing” to “numerical risk control.”**
✅ Prevents over-lotting
✅ Clarifies risk exposure
✅ Balances wins and losses
✅ Enables calm, consistent execution
🧩 How to Use
1️⃣ Add the indicator to your chart
2️⃣ Set your **account balance**, **risk percentage**, and **stop loss (pips)**
3️⃣ The **“Lot Size”** value automatically displays the optimal lot size
4️⃣ Check risk indicators such as **Margin Maintenance** and **Effective Leverage**
⚠️ Disclaimer
This indicator is a **support tool for educational purposes only**.
All final trading decisions are the sole responsibility of the user.
🧾 Credits
Developed for **Japanese Traders 🇯🇵**
Optimized for **FX-Based Risk Control**
Created by ** **
💬 Summary
Protecting your capital isn’t a defensive move —
it’s the **strongest strategy to stay in the game and seize the next opportunity**.
Only those who manage risk properly can sustain consistent long-term success.
🧩 Future Updates
This indicator will continue to evolve with improvements in usability and accuracy.
Stay tuned for upcoming updates and refinements.

Forex Currency Strength What this indicator does
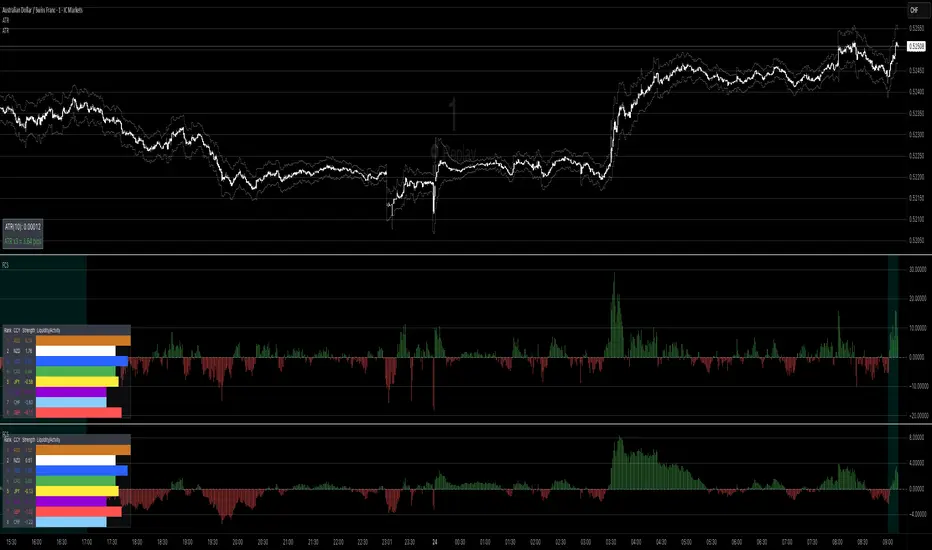
It compares the relative strength of the 8 major currencies (USD, EUR, GBP, JPY, AUD, CAD, NZD, CHF) by looking at all 28 currency pairs. Each currency is smoothed (averaged) with a moving average to reduce noise.
From this it shows:
• Currency strength lines → how each major currency is performing over time (optional view).
• Pair divergence histogram → the difference in strength between the two currencies of the chart pair (e.g. EUR vs USD on an EURUSD chart). Green means the base currency is stronger, red means the quote currency is stronger.
• Ranking table → shows the strongest to weakest currency at the current moment. The strongest is highlighted green, the weakest red.
• Session highlighting → shows your chosen trading session on the chart (background shading, optional vertical line at the session start).
• Alerts → you can set TradingView alerts when:
• the pair divergence crosses above or below zero
• the divergence strength gets big enough (above your threshold)
• the difference between the strongest and weakest currency becomes large
⸻
👉 In plain words:
This indicator helps you quickly see which currencies are strong, which are weak, and whether the pair you are trading has a clear directional bias. It also highlights trading sessions and can notify you when strong moves or imbalances appear.
// ─────────────────────────────────────────────────────────────
// Forex Currency Strength (8 Majors, %R) + Divergence + Ranking
// ─────────────────────────────────────────────────────────────
//
// === Inputs ===
//
// exchPrefix → Broker/feed prefix (e.g. "OANDA:", "FX:", or "" for ICMarkets)
// tf → Data timeframe (empty = chart timeframe)
// smoothLen → Smoothing length (MA) for currency strength (default = 14)
// smoothMethod → MA method (SMA, EMA, WMA, DEMA)
// viewMode → Display mode: "Strength Lines", "Pair Divergence", "Both"
// (Tip: set to "Pair Divergence" to hide lines by default)
// barsLimit → Number of bars to display
//
// sessionStr → Trading session time (e.g. "0800-1700"); session is highlighted on chart
//
// alertDivAbs → Threshold for alerts on |divergence|
// alertGapTF → Threshold for alerts on Top–Flop ranking gap
//
// scaleK → Scaling factor (here ×1000)
//
// rankPos → Position of the ranking table (top/bottom left/right)
// rankTextSize → Font size for the ranking table (tiny, small, normal, large, huge)
//
// === Outputs ===
//
// • 8 currency strength lines (optionally visible)
// • Divergence (current pair) as histogram
// • Ranking table (top & flop highlighted)
// • Session highlighting (background color + optional vertical line)
// • Alerts on divergence crosses, |divergence| thresholds & top–flop gaps
//
// === Alert Conditions ===
//
// longDivCross → Divergence (current pair) crosses above 0
// shortDivCross → Divergence (current pair) crosses below 0
// divAbsUp → |Divergence| exceeds alertDivAbs threshold
// gapUp → Top–Flop ranking gap exceeds alertGapTF threshold
//
// ─────────────────────────────────────────────────────────────
DT_Sessions TOPDT_Sessions TOP - Powerful Trading Sessions and Key Levels Indicator
Description
DT_Sessions is a versatile TradingView indicator that displays major trading sessions and important price levels on your chart. It's ideal for traders working in forex, cryptocurrency, and stock markets, helping to visualize critical market information directly on the chart.
Key Features:
Visualization of major trading sessions: Asian, Frankfurt, London, New York (AM and PM)
Previous day high and low (PDH/PDL) tracking
Display of key psychological levels for major trading instruments
Customizable colors and styles for all indicator elements
Flexible timezone management for accurate session synchronization
Benefits of Use
Enhanced market analysis: Understanding the activity of different trading sessions helps better interpret price movements
Trading time optimization: Visual display of the most volatile market periods
Key resistance and support levels: Automatic display of psychologically significant price levels
Daily extreme monitoring: PDH/PDL help in determining the trading range
Supported Instruments
The indicator automatically recognizes popular instruments, including:
Forex pairs (EUR/USD, GBP/USD, USD/JPY)
Cryptocurrencies (Bitcoin, Ethereum)
Stock indices (DAX, NASDAQ, S&P 500, EuroStoxx50)
Precious metals (XAU/USD)
How to Use
Add the indicator to your favorite asset's chart
Observe the trading session ranges highlighted in different colors
Use PDH/PDL lines to identify significant daily levels
Pay attention to key psychological levels for your instrument
Advanced Settings
The indicator offers numerous settings for each session:
Enable/disable individual sessions
Adjust start and end times for each session
Change colors and transparency
Configure PDH/PDL display
Manage timezones and UTC offset
Effective For
Scalpers and day traders
Long-term investors tracking key levels
Algorithmic traders needing session data visualization
Beginners studying the impact of trading sessions on market activity
DT_Sessions is an essential tool for traders of all levels, providing valuable information about market dynamics and key levels directly on your TradingView chart.

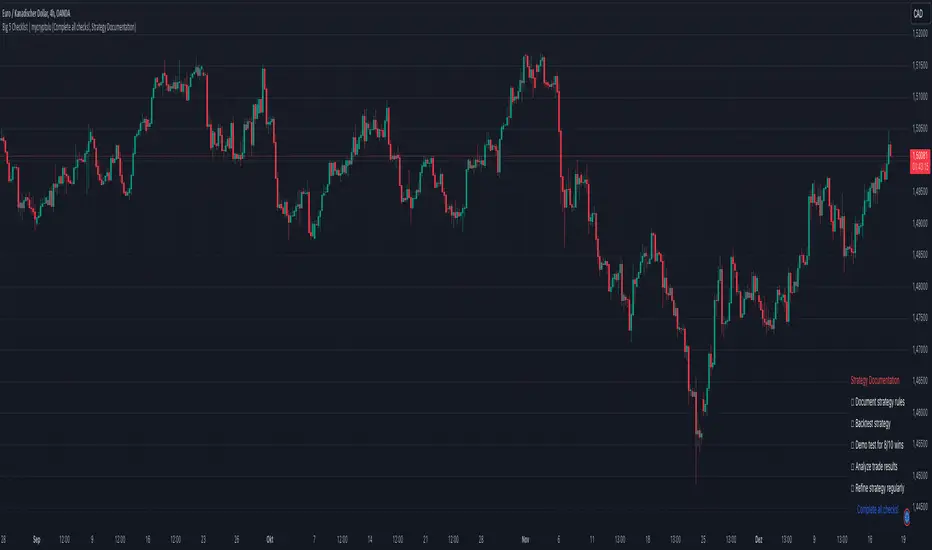
Big 5 Checklist | XEONEDIAThe Big 5 Checklist | XEONEDIA indicator is a powerful trading tool designed to help traders prepare their trading decisions in a structured and effective manner. The indicator encompasses five key areas:
Strategy Documentation :
✅ Ensure that the trading strategy is clearly defined and documented.
✅ Conduct backtesting.
✅ Perform demo testing with an 80% success rate.
✅ Analyze trading results.
✅ Regularly refine the strategy.
Risk Management :
✅ Minimize financial losses and ensure responsible trading.
✅ Set a risk limit of 1-2%.
✅ Use stop-loss orders.
✅ Ensure a risk-reward ratio of at least 2:1.
✅ Adjust position sizes.
Technical Analysis :
✅ Evaluate charts and indicators to identify trading opportunities.
✅ Identify support and resistance levels.
✅ Use technical indicators (e.g., RSI).
✅ Set entry and exit points.
✅ Establish alerts for specific market conditions.
Market Conditions :
✅ Consider external factors that may influence trading.
✅ Monitor the economic calendar.
✅ Apply fundamental analysis.
✅ Observe market volatility.
✅ Analyze global trends.
Psychological Management :
✅ Control emotions and mindset during trading.
✅ Adhere to the trading plan.
✅ Manage emotions while trading.
✅ Set realistic expectations.
✅ Take regular mental breaks.
Mastercheck
The Mastercheck provides a digital checklist where traders can track their progress live. Users can make their own notes and view their checklist on any TradingView device, ensuring they stay informed about their trading readiness and can make adjustments in real-time. ✅
Overall, the Big 5 Checklist | XEONEDIA indicator helps minimize risks and maximize the chances of successful trades by promoting systematic and comprehensive trading preparation.
Forex Midpoint Stratejisi For Nasdaq English Knowledge:
Midpoint Strategy;
The general calculation method is a strategy that helps determine direction by the intersection of a MA line and the value obtained by dividing the lowest and highest price in the specified length range.
Başlangıç Periyodu: The data length of the Midpoint Line.
Kaydırma Seviyesi: The number of steps forward or backward of the Midpoint Line.
Yüzde Seviyesi: the amount of vertical scrolling.
Uzunluk: The length of the MA line
represents.
This strategy is prepared for the Nasdaq 5-minute period. It needs to be optimized for use on other instruments.
There are take profit and stop loss levels within the codes. Friends who want to use it can remove the invisibility from the relevant sections. Also, I removed the midpoint and the MA line so that it does not crowd the image, you can add it if you want.
Thank you.
Turkish Knowledge:
Midpoint Stratejisi;
Genel hesaplama yöntemi, belirlenen uzunluk aralığındaki en düşük ve en yüksek fiyatın ikiye bölümü ile elde edilen değer ve bir ortalama çizgisinin kesişimleriyle yön belirlemeye yardımcı bir stratejidir.
Başlangıç Period: Midpoint Çizgisinin veri uzunluğunu.
Kaydırma Seviyesi: Midpoint Çizgisinin ileri veya geri adım sayısını.
Yüzde Seviyesi: dikey kaydırma miktarını.
Uzunluk: Ortalama çizgisinin uzunluğunu
temsil etmektedir.
Bu strateji Nasdaq 5 dakikalık periot için hazırlanmıştır. Diğer enstrümanlarda kullanılması için optimize edilmesi gerekir.
Kodların içinde Kar alma , zarar durdurma seviyeleri mevcuttur. Kullanmak isteyen arkadaşlar ilgili bölümlerden görünmezliği kaldırabilirler. ayrıca midpoint ve ortalama çizgisinide görüntü kalabalığı yapmaması için ben kaldırdım isterseniz siz ekleyebilirsiniz.
Teşekkürler.
