Technimentals NDX Weighted FlowThis script runs a proprietary money flow algorithm three times with different user defined inputs on the top 20 components of the NDX, weights their outputs directly according to their weighting in the NDX and then plots the cumulative total of the 60 outputs as a single line which overlays the chart.
The algorithm works by measuring relative volatility on each candlestick compared to the previous candlestick and compares that with it's smoothed recent volatility . This produces a binary (signum) output which is then weighted and accumulated.
The script is designed for use on shorter term timeframes. I do not recommend using this indicator on the daily timeframe or higher unless you lower the timeframe setting inside the script itself. The reason for this is that the signals it provides are often very slow and require zooming the chart out to get enough context to interpret the signals. For example, using this indicator on the one minute timeframe may produce signals several days out.
G-money

EMP PEG / TWAP 1.01 Crypto DefiThis script is for my EMP friends. This addon is based upon Etherium price. It will take the Etherium price and divide by 4,000 to get the PEG price. From there, it will multiply by 1.01 to get the TWAP 1.01. Since it takes 1.01 for the boardroom to print, the yellow line is the important line. TWAP will be showed by default. You can switch between or have both indicators on. You can drag the indicator screen up to get a bigger chart. You can also use this for looking back to see where PEG or TWAP 1.01 was during certain EMP prices. Understand this will get you close to seeing when Boardroom will print. Nothing is exact. How I use it: I place a green and yellow horizontal line on an EMP chart from Dexscreener dexscreener.com You can check this chart to find out what to move your horizontal lines to. Come join the fun at emp.money

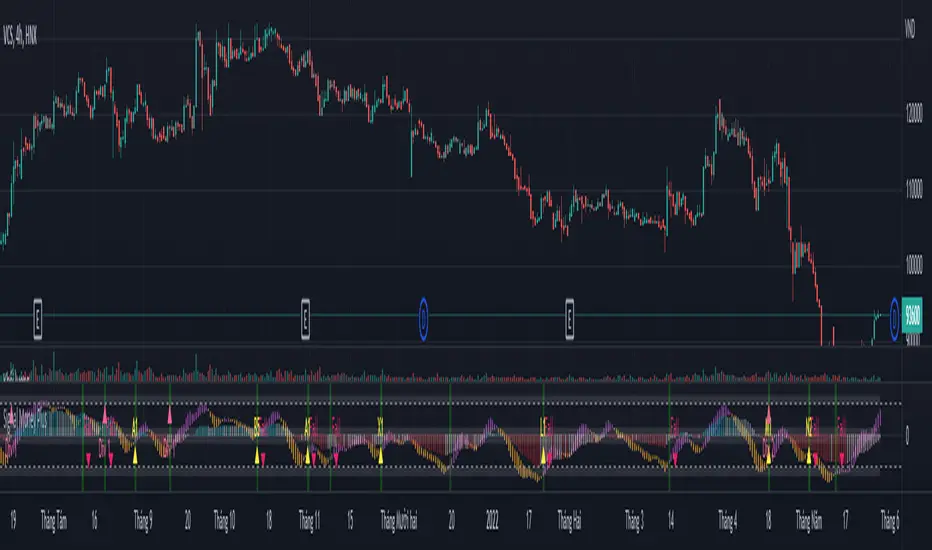
Signal Money PlusSignal Money Plus is a trend analysis indicator including Signal Money and Signal Money Plus.
Signal Money:
- Signal Money enters the overbought or oversold area and the price fluctuates around the strong support or resistance area, giving a reliable signal.
- Signal Money creates a divergence, and the price fluctuates around a strong support or resistance area, giving a reliable signal.
- The price fluctuates in a narrow range but the Signal Money correcting according to the elliott wave pattern gives a reliable signal.
Signal Money Plus:
- Money Plus > 0 for positive cash flow trend. Money Plus < 0 for negative cash flow trend. Money Plus fluctuates around -20 to 20, showing an accumulation trend waiting for a confirmation signal.
- Money Plus creates divergence for reliable signal
Use combination Signal Money Plus:

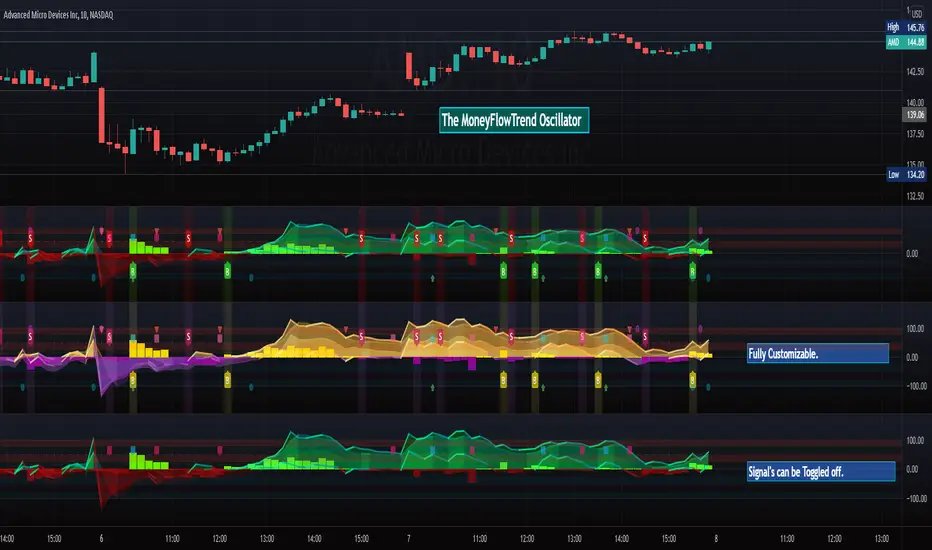
MoneyFlowTrend Oscillator (cc) [M.Right]Hey Traders,
Tonight I present to you a brand new indicator.
I call it the MoneyFlowTrend Oscillator . This is another one that I've been piecing together for years and learning how to code pine has allowed me to bring it to life.
Built on the idea of Supply & Demand Zones , this utilizes money flow and numerous calculations to create a picture of what is happening underneath the surface of the price action.
Richard Wykoff was one of the first market analysts to explain how the economic cycle can be applied to explain market price action; thus, technical analysis. He described two zones among the total of 4 phases; the two zones are Distribution and Accumulation zones, also known as Supply & Demand zones.
______________________________
Since most of you already know the economic cycle, I will try to be concise.
The basic ideas:
When supply is greater than demand, the price goes up down.
When demand is greater than supply, price goes up.
When demand is equal to supply, the price stays about the same (going sideways).
Price action has --Uptrends, downtrends, and price ranges (consolidation).
Wykoff's 4 phases to explain this price action :
1) Accumulation ( Demand zone)
2) Markup (Uptrend)
3) Distribution ( Supply zone)
4) Markdown (Downtrend)
______________________________
With all that said, usually you will either see a sharp jump from a supply or demand zone or it will consolidate within it. Until a new one is formed on the chart.
This indicator attempts to put all of that into a lower indicator. I tried to separate the retailers and the banks and then put them back together to get a full picture.
The MoneyFlowTrend Oscillator Signals are super accurate.
((accuracy can't always be this close to perfect.))
These are the signals + highlight that I have activated, you can toggle on and off between them.
Fully customizable and includes alerts.
Good luck traders.
Cheers,
Mike
Fed Balance Sheet Growth Rate p.a.Plots the rate of change in the Fed Balance sheet.
Defaults to annual rate of change.
Option to plot the raw balance sheet data.

money managementthis indicator has been designed to make your calculations easier and faster.
you can use this indicator to set tp and sl prices based on your entry price, balance,risk and leverage.
it has been designed only for cryptocurrency market and it is not recommended to use it in other markets!
1- enter your balance in the setting of the indicator.
2- enter risk percentage of your balance.
3- enter your sl percentage.
4- enter your tp percentage.
5- set your leverage if you are trading in futures market.
6- and at last set your entry price.
your position size both in spot market and futures market and the exact price of tp and sl , will be shown top right of the screen.
caution: before using this indicator in real market, please make sure that you understand this indicator's behavior and test it.
--------------------------------------------------------------------
این اندیکاتور برای تسریع محاسبات مدیریت سرمایه و سهولت رعایت آن طراحی شده است.
شما میتوانید با وارد کردن پارامترهاقیمت ورودی، سرمایه کل، ریسک و اهرم، قیمت حد سود و ضرر خود را محاسبه کنید.
همچنین اندازه حجم معاملات شما توسط این اندیکاتور محاسبه خواهد شد.
این اندیکاتور برای بازار کریپتوکارنسی طراحی شده است و استفاده از آن در سایر بازارها پیشنهاد نمیشود.
از بخش تنظیمات اندیکاتورمراحل زیر را انجام دهید:
1- میزان سرمایه خود را در قسمت بالانس وارد کنید
2- میزان ریسک سرمایه در هر معامله را مشخص کنید (به درصد)
3- میزان حد ضرر خود را مشخص کنید (به درصد)
4- میزان حد سود خود را مشخص کنید (به درصد)
5- عدد اهرم خود را وارد کنید
6- قیمت ورود به معامله را وارد کنید
توجه: قبل از استفاده این اندیکاتور در بازار لایو لطفا آن را تست کنید و از کارکرد صحیح آن با مدیریت سرمایه خود اطمینان حاصل فرمایید.


Dziwne MFI Overlay (with highlight)It is simply your traditional MFI , except that your 50 line became the actual price.
Why and how could it be useful? This indicator helps to spot more easily and efficiently divergences .
You could also use it for trend reversals as you usually do with your 50 line, but I would suggest to set a higher length for the MFI, like 155 or something like that.

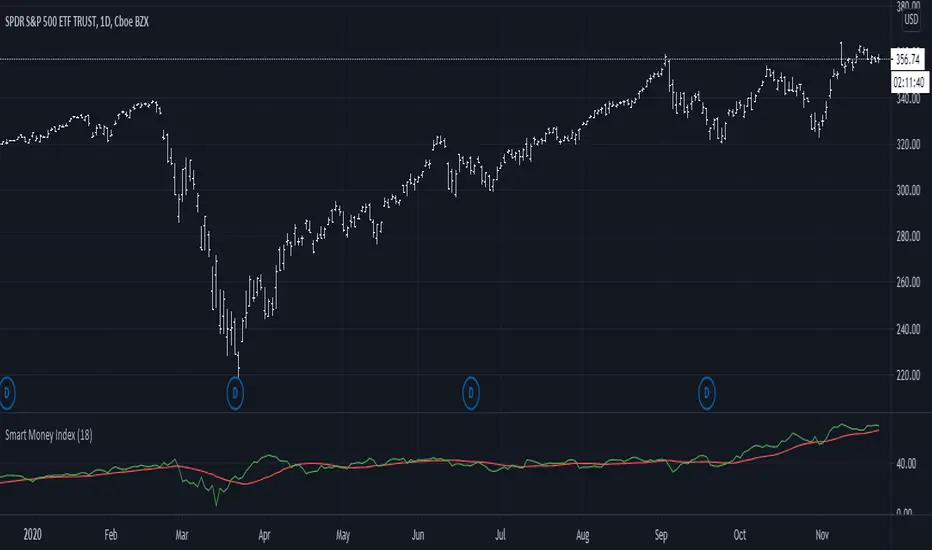
Smart Money Index (SMI)It came to my attention that one very common implementation of SMI was incorrect; rather than subtracting the first hour delta and adding the last hour delta it subtracts the whole day delta and adds the last 30m delta. While this indicator might have had some use, it is not what I understand to be the actual Smart Money Index and so I post this as a correction for use in other scripts.
Total Inflation ModelMeasure of the total economy wide inflation of the US Dollar.
Total Inflation = growth rate of money supply / economic output


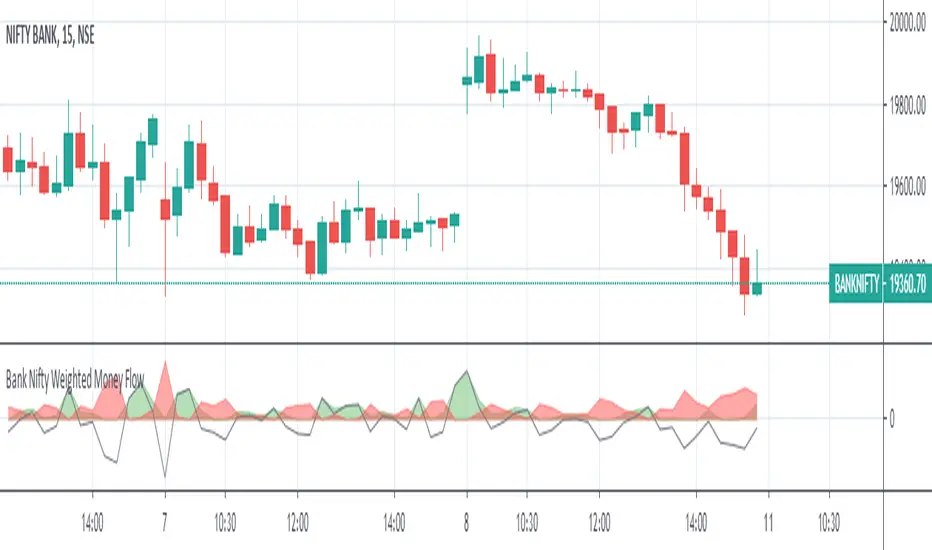
Bank Nifty Weighted Money FlowThe indicator comprises of 2 areas ( one in green and another in red ) that depict the money flowing in and out the underlying 12 banks under BANK NIFTY index
The money flowing in and flowing out is calculated by identifying the buying pressure and selling pressure of each of 12 underlying banks within a 15 minute period ( which is internally further broken down by 15 one minute candles ), there by identifying the buy volume and sell volume multiplied by the price of the stock for the given minute aggregated for 15 minutes
The derived value for each bank is further weighted as per their weight in the index ( as of May 2nd 2020 ) and then summed up separately for both money flowing in and flowing out and plotted which shall help traders take decision based on the magnitude of money flowing in and out ( the weights shall be updated as and when the same changes in the index calculations )
The green color area represents the money flown in and the red color area represents the money that has flown out
A gradually increasing green area along with the decrease in the red area can be considered as the market is more into buying and less into selling and vice versa ( this can be observed in the chart before the rally begins , there should be an increasing green area which could potentially signifies money has started to flow in )
An equal or almost equal areas could signify a sideways market and the black line moving across shows the difference of money flowing and flowing out
Comments and feedback are welcome
Should you have any doubts or wish to access the script then please feel free to DM me.
***** The indicator works only in 15 minutes time frame *****
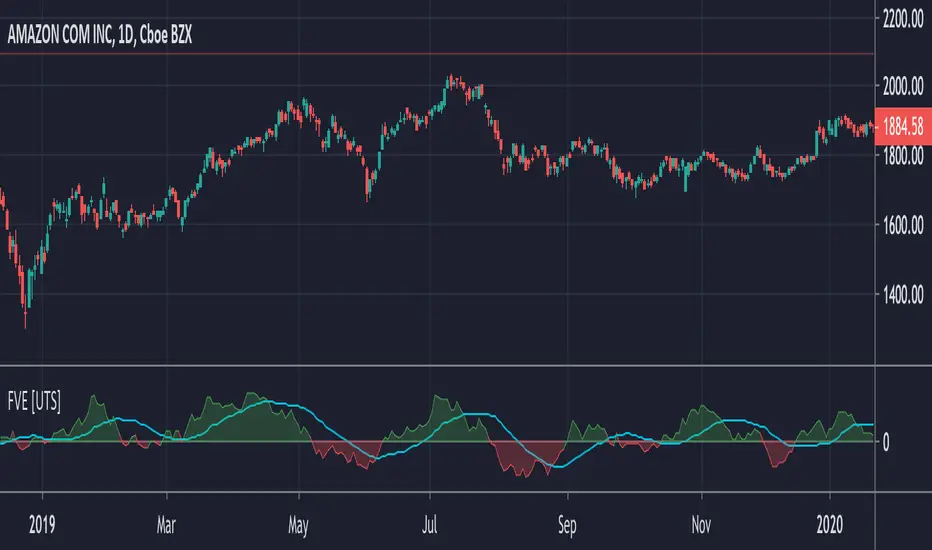
FVE - Finite Volume Elements [UTS]FVE is a money flow indicator but with two important differences from existing money flow indicators:
It resolves contradictions between intraday money flow indicators (such as Chaikin’s money flow) and interday money flow indicators (like On Balance Volume) by taking into account both intra- and interday price action.
Unlike other money flow indicators which add or subtract all volume even if the security closed just 1 cent higher than the previous close, FVE uses a volatility threshold to take into account minimal price changes.
General Usage
The FVE provides 3 types of signals:
The strongest signal is divergence between price and the indicator. Divergence can provide leading signals of breakouts or warnings of impending corrections. The classic method for detecting divergence is for FVE to make lower highs while price makes higher highs (negative divergence). An alternative method is to draw the linear regression line on both charts, and compare the slopes. A logical buy signal would be for FVE, diverging from price, to rise sharply and make a series higher highs and/or higher lows.
The most obvious and coincident signal is the slope of the FVE line. An upward slope indicates that the bulls are in control and the opposite for downward.
This is a unique and very important property of this indicator. Values above zero are bullish and indicate accumulation while values below zero indicate distribution. FVE crossing the zero line indicates that the short to intermediate balance of power is changing from the bulls to the bears or vice versa. The best scenario is when a stock is in the process of building a base, and FVE diverges from price and rises to cross the zero line from below, at a sharp angle. Conversely the crossing of the zero line from above is a bearish signal to liquidate positions or initiate a short trade.
Trend Visualisation
Optional: If the trend direction is DOWN the moving average is painted red. If the trend direction is UP the moving average is painted in green.
If the movement is FLAT then the color is grey.
Moving Averages
Five different types of Moving Averages are available for both FVE and the optional moving average of the FVE.
ALMA (Arnaud Legoux Moving Average)
Average Value
EMA (Exponential Moving Average)
SMA (Simple Moving Average)
WMA (Weighted Moving Average)
Calculation Methods
Since Markos Katsanos presented the first version of the FVE in April 2003.
Since then there have been various adaptions and improvements on this indicator.
The following are choosable for calculating the FVE:
Thinkscript usethinkscript.com
Linnsoft www.linnsoft.com
Volatility Adapted traders.com
CMF Osc - Chaikin Money Flow Oscillator [UTS]The well known Chaikin Money Flow Indicator as oscillator version.
General Usage
The indicator runs both above and below zero, made to denote whether an asset is in a bullish (above zero) or bearish (below zero) trend.
It can be used to confirm trends, as well as spot possible trading signals due to divergences.
A benefit of the oscillator version is that it can produce LONG or SHORT signals on zero line cross.
Moving Averages
4 different Moving Averages are available:
EMA (Exponential Moving Average)
SMA (Simple Moving Average)
VWMA (Volume Weighted Moving Average)
WMA (Weighted Moving Average)

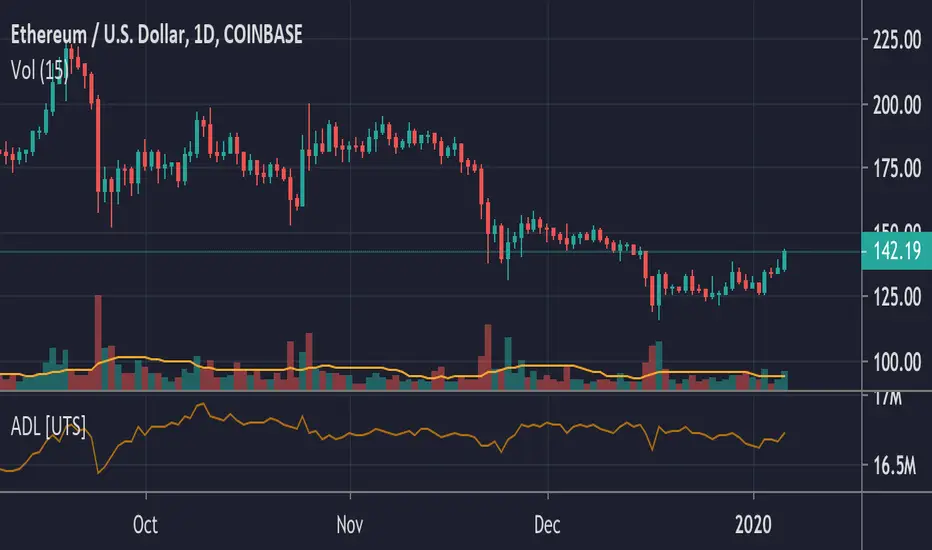
ADL - Accumulation Distribution Line [UTS]an underlying asset.
It is determined by the changes in price and volume. The volume acts as a weighting coefficient at the change of price — the higher the coefficient (the volume) is the greater the contribution of the price change (for this period of time) will be in the value of the indicator. The indicator is also known as Accumulation / Distribution Index.
Common known variants of this type of indicator are the On Balance Volume, Chaikin Oscillator or Chaikin Money Flow.
Based on www.metatrader5.com
MS MONEY CCI SQUEEZEAbout
I have used this indicator to find many lucrative opportunities. This indicator takes the moving average of CCI in custom, volatility-specific conditions. CCI measures "overbought" in the red-shaded region and "Oversold" in the green-shaded region. The shaded regions do not constitute a buy/sell signal alone, the MS CCI Squeeze is best used when market conditions agree and is best used when the user has fundamental reasoning for "reversal-like" situations to align. The MS CCI Squeeze will soon have a synergistic partner called "MS RSI Squeeze" indicator that will look similar to help better measure volatility and strength trend.
About the Commodity Channel Index (CCI)
The commodity channel index (CCI) is an oscillator originally introduced by Donald Lambert in 1980. Since its introduction, the indicator has grown in popularity and is now a very common tool for traders in identifying cyclical trends not only in commodities, but also equities (stocks) and currency trading.
How to set an Alert
If the user wants to set an alert , click on one of the support/ resistance lines (black-dashed) near the zero mark. Clicking on the horizontal line above or below the zero line will populate a yellow arrow which will allow you to set alerts when wanted.
Please Read For Better Efficiency
When using this indicator, keep an eye out for harmonic patterns, both bullish and bearish head and shoulders patterns for "HIDDEN" breakout opportunities.
Please like, follow and share and I will continue building better indicators.

MPI‴ | Money Pressure IndexThe MPI‴ or Money Pressure Index is a great indicator to measure the buy/sell money pressure over the asset once it allows you to have a better understanding and interpretation of its behavior once you are able to see it through an histrogram. Using its histogram, will allow you to have a gradual view of its force over the asset and the end of the line oscilation will allow you to see the most up to date indicator behaviour.
What is the best is that you can use it with any kind of graphic that it will always considere the real open, close, high and low trading values.
To have access to this indicator, please contact me at: contato @ moneywise . com . br
Believe me, this indicator will make your life much easier!

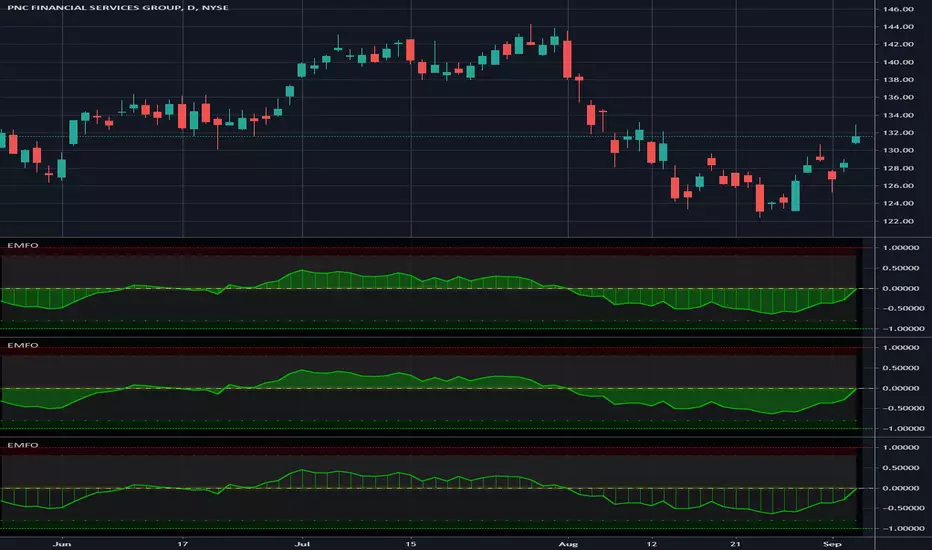
Enhanced Money Flow Oscillator - Vitali ApirineThis is my "Enhanced Money Flow Oscillator" indicator using Pine Script version 4.0, freely available to ALL! This originates from an October 2015 TASC magazine article written by Vitali Apirine. While the original was simplistically designed, I enhanced it by adding a multitude of features listed below.
Note: This script has volume detection built-in. When no volume is available, the background color will be overwhelmingly red AND the indicator will cease to function. At a minimal, this script can used to detect when volume is available in an asset or when it is not.
Features List Includes:
I.P.O.C.S.(Initial Public Offering Clean Start) Technology
Enable/disable dark background for enhanced visibility
"Period" adjustment
"Line Width" adjustment
"Display Area" selection for visual mutations displayed above
Ranges and thresholds are enable/disable capable
Upper threshold adjustment
Red/green secondary range that adjusts +/- from the upper/lower thresholds
Lower threshold adjustment
Adjustable centered medial zone
The comments section below is solely just for commenting and other remarks, ideas, compliments, etc... regarding only this indicator, not others. If you do have any questions or comments regarding this indicator, I will consider your inquiries, thoughts, and ideas presented below in the comments section, when time provides it. When my indicators achieve more prevalent use by TV members, I will implement more ideas when they present themselves as worthy additions. As always, "Like" it if you simply just like it with a proper thumbs up, and also return to my scripts list occasionally for additional postings. Have a profitable future everyone!
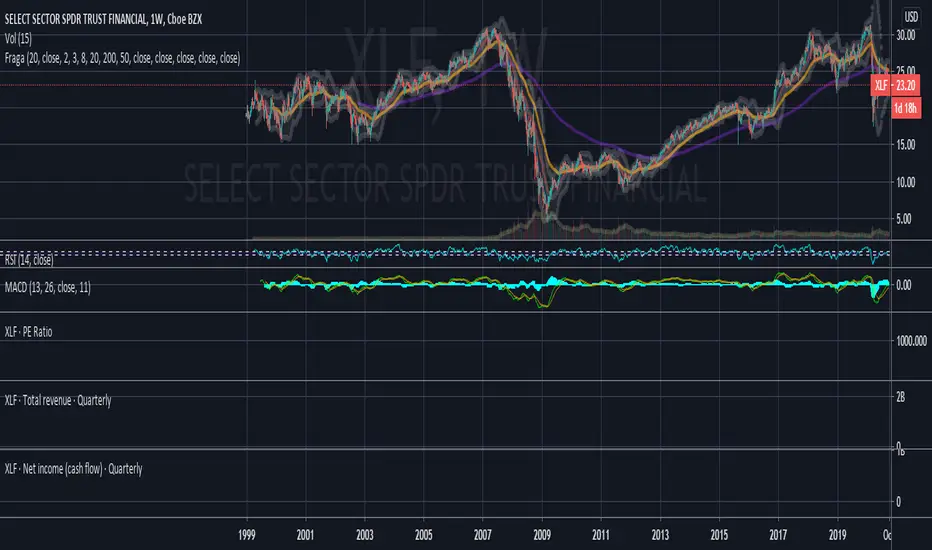
Didi+EMA200+Bollinger Bands-FRAGAHelps those are using Basic Account / limited indicators
by Will Fraga
@traderzonebr
Smart Money Index (50)Added MA50 to help interpret Smart Money Flow Index. Original SMI script by HPotter, idea of MA50 gotten from Troy Bombardia.

Boring Indicator [ALERTS] [Pretty cool tho]Umm, it's pretty boring indicator, you just buy/long when you see buy and you sell/short when you see sell.
Kinda it's like Market God indicator except that it's better and it took me like 10 minutes to figure it out.
Does it repaints?
I mean... kinda yes and kinda not, signal may start blinking but usually it stays in same place, so even if it disappers for few seconds it should come back.
If you want to be 100% sure, wait for close of candle where it appears.
* Works best on Heikin Ashi candles, so try them.
* Alerts are fine, just set them, probably you will figure out how.
* Should work on crypto mostly, probably stocks too (though remember that they are slower so try on 1day? up to you)
* Should work on any timeframe but 45m BITMEX:ETHUSD is nice for me and I trade there, consider that market doesn't moves 1435236 dollars every candle so well, its better if you wait on longer candle than try to trade on 1m.
Enjoy.
If you want to give me some more money for energy drinks and pizza:
BTC address: 3BMEXhXUAFj39D799zzfU1UAhx4NYSqCog
Oh and share it to friends and family.

Chaikin Money FlowThis script plots the original Chaikin Money Flow in addition of highlighting positive/negative pressure areas.
