Gann Bosameer This indicator identifies dynamic support and resistance levels using Gann angles from highs and lows.
It helps traders visualize the “price ladder” for potential upward or downward moves, with both manual and automatic pivot options and multiple angle selections.
⚠️ For analytical purposes only – not a financial advice or trading recommendation.
Gann

Mikula's Master 360° Square of 12Mikula’s Master 360° Square of 12
An educational W. D. Gann study indicator for price and time. Anchor a compact Square of 12 table to a start point you choose. Begin from a bar’s High or Low (or set a manual start price). From that anchor you can progress or regress the table to study how price steps through cycles in either direction.
What you’re looking at :
Zodiac rail (far left): the twelve signs.
Degree rail: 24 rows in 15° steps from 15° up to 360°/0°.
Transit rail and Natal rail: track one planet per rail. Each planet is placed at its current row (℞ shown when retrograde). As longitude advances, the planet climbs bottom → top, then wraps to the bottom at the next sign; during retrograde it steps downward.
Hover a planet’s cell to see a tooltip with its exact longitude and sign (e.g., 152.4° ♌︎). The linked price cell in the grid moves with the planet’s row so you can follow a planet’s path through the zodiac as a path through price.
Price grid (right): the 12×24 Square of 12. Each column is a cycle; cells are stepped price levels from your start price using your increment.
Bottom rail: shows the current square number and labels the twelve columns in that square.
How the square is read
The square always begins at the bottom left. Read each column bottom → top. At the top, return to the bottom of the next column and read up again. One square contains twelve cycles. Because the anchor can be a High or a Low, you can progress the table upward from the anchor or regress it downward while keeping the same bottom-to-top reading order.
Iterate Square (shifting)
Iterate Square shifts the entire 12×24 grid to the next set of twelve cycles.
Square 1 shows cycles 1–12; Square 2 shows 13–24; Square 3 shows 25–36, etc.
Visibility rules
Pivot cells are table-bound. If you shift the square beyond those prices, their highlights won’t appear in the table.
A/B levels and Transit/Natal planetary lines are chart overlays and can remain visible on the table as you shift the square.
Quick use
Choose an anchor (date/time + High/Low) or enable a manual start price .
Set the increment. If you anchored with a Low and want the table to step downward from there, use a negative value.
Optional: pick Transit and Natal planets (one per rail), toggle their plots, and hover their cells for longitude/sign.
Optional: turn on A/B levels to display repeating bands from the start price.
Optional: enable swing pivots to tint matching cells after the anchor.
Use Iterate Square to shift to later squares of twelve cycles.
Examples
These are exploratory examples to spark ideas:
Overview layout (zodiac & degree rails, Transit/Natal rails, price grid)
A-levels plotted, pivots tinted on the table, real-time price highlighted
Drawing angles from the anchor using price & time read from the table
Using a TradingView Gann box along the A-levels to study reactions
Attribution & originality
This script is an original implementation (no external code copied). Conceptual credit to Patrick Mikula, whose discussion of the Master 360° Square of 12 inspired this study’s presentation.
Further reading (neutral pointers)
Patrick Mikula, Gann’s Scientific Methods Unveiled, Vol. 2, “W. D. Gann’s Use of the Circle Chart.”
W. D. Gann’s Original Commodity Course (as provided by WDGAN.com).
No affiliation implied.
License CC BY-NC-SA 4.0 (non-commercial; please attribute @Javonnii and link the original).
Dependency AstroLib by @BarefootJoey
Disclaimer Educational use only; not financial advice.

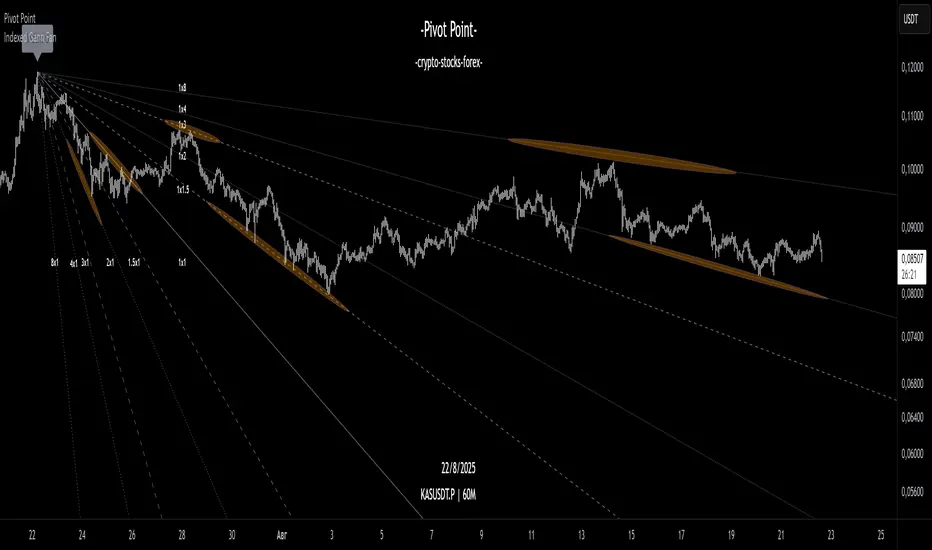
Indexed Gann Fan“This indicator automatically builds an unique trend-based Gann fan by selecting swing high/swing low ubased on price fluctuation index over time for each segment of the chart.
It helps traders identify the true market trend and pinpoint key support and resistance levels at precise angles.
Designed for traders familiar with Gann’s methodology who want a clearer understanding of market structure and greater confidence in their trading decisions.”
__________________________________________________________________________________
Индикатор автоматически по выбору экстремума строит уникальный трендовый веер Ганна, используя индекс колебаний цены во времени для каждого участка графика.
Помогает видеть направление тренда и определять ключевые углы поддержки и сопротивления.
Инструмент создан для трейдеров знакомых с методологией Ганна, которые хотят получать более ясное понимание рыночной структуры и принимать решения с максимальной уверенностью.
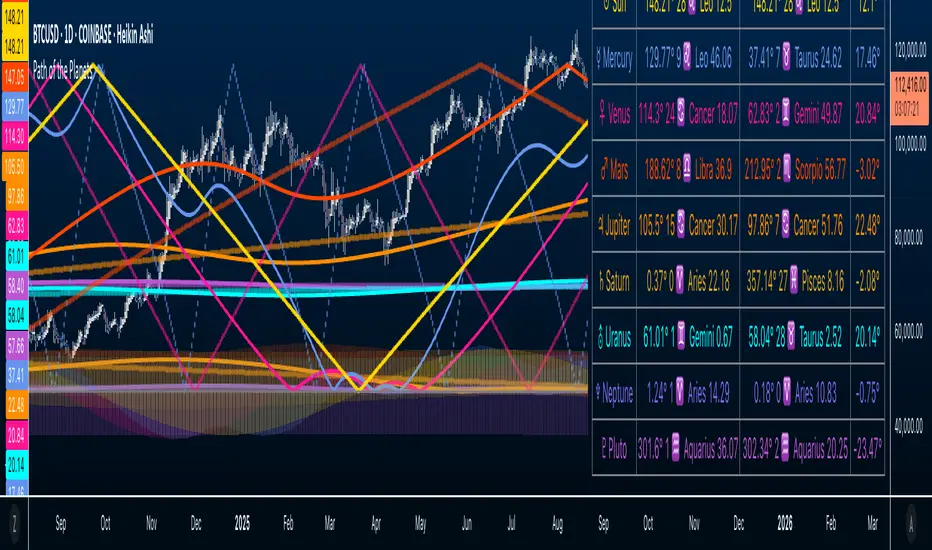
Path of the Planets🪐 Path of the Planets
Path of the Planets is an open-source Pine Script™ v6 indicator. It is inspired by W.D. Gann’s Path of Planets chart, specifically the Chart 5-9 artistic replica by Patrick Mikula "shown below". The script visualizes planetary positions so you can explore possible correlations with price. It overlays geocentric and heliocentric longitudes and declinations using the AstroLib library and includes an optional positions table that shows, at a glance, each body’s geocentric longitude, heliocentric longitude, and declination. This is an educational tool only and not trading advice.
Key Features
Start point: Choose a date and time to begin plotting so studies can align with market events.
Adjustments: Mirror longitudes and shift by 360° multiples to re-frame cycles.
Planets: Toggle geocentric and heliocentric longitudes and declinations for Sun, Mercury, Venus, Earth, Mars, Jupiter, Saturn, Uranus, Neptune, and Pluto. Moon declination is available.
Positions table: Optional color-coded table (bottom-right) with three columns labeled Geo, Helio, and Dec. Values show degrees with the zodiac sign for the longitudes and degrees for declinations.
Visualization: Solid lines for geocentric longitudes, circles for heliocentric longitudes, and columns for declinations. Includes a zero-declination reference line.
How It Works
Converts bar timestamps to Julian days via AstroLib.
Fetches positions with AstroLib types: geocentric (0), heliocentric (1), and declination (3).
Normalizes longitudes to the −180° to +180° range, applies optional mirroring and 360° shifts, and converts longitudes to zodiac sign labels for the table.
Plots and the table update only on and after the selected start time.
Usage Tips
Apply on daily or higher timeframes when studying broader cycles. For degrees, use the left scale.
Limitations at the moment: default latitude, longitude, and timezone are set to 0; aspects and retrogrades are not included; the focus is on raw paths.
License and Credits
Dependency: @BarefootJoey Astrolib
Contributions and observations are welcome.
Concentric Geometry – Invariant MetricsConcentric Geometry – Invariant Metrics
This indicator demonstrates the invariant concept of a concentric circle around a selected price range. By anchoring two points (A & B), it calculates a set of ratios and slopes that remain consistent under concentric scaling of price and time. These invariants include the raw slope (ΔP/N), concentric slope, π-adjusted ratios, and √2 offsets — all of which can be used to explore deeper geometric relationships in the market.
What has been demonstrated here is not an “out-of-the-box” trading system. Instead, the outputs provide the raw invariant metrics from which the trader must derive their own ratios and extensions. For example, price-to-bar ratio inputs are not fixed — they need to be derived from the invariants themselves, and experimenting with them is the key to uncovering harmonic alignments and scaling behaviors.
Key features include:
• Range & Bars Analysis – Price range (ΔP) and bar count (N) between anchors.
• Core Invariants – Midpoint, radius (price and bar units), upper/lower bounds.
• Linear Slope Metrics – ΔP/N and √2 concentric slope.
• π-Adjusted Price/Bar – Harmonic arc-length ratio.
• Circumference & Offsets – Circle circumference, √2 and 1/√2 offsets in price and bar units.
This tool is best suited for traders studying market geometry, W.D. Gann principles, harmonic ratios, or the geometric methods of Michael Jenkins. It does not generate buy/sell signals — instead, it equips the trader with building blocks for geometric exploration.
Key point: The trader must experiment with the ratios derived from these metrics. Playing with different price-to-bar relationships unlocks the true potential of concentric market geometry, whether applied to dynamic anchored VWAPs, concentric overlays, or Vesica Piscis structures.
Use it to:
• Compare slopes across swings
• Derive new ratios from invariant metrics
• Anchor dynamic anchored VWAPs to concentric nodes
• Explore concentric or Vesica Piscis overlays
• Support advanced geometric trading strategies

Advanced Gann S/R LevelsThis powerful Pine Script indicator brings the legendary forecasting methods of W.D. Gann directly onto your TradingView chart. It's designed to provide traders with a complete, automated framework for identifying high-probability intraday support and resistance levels.
By combining the principles of Gann Pivot Points with the harmonic relationships of the Gann Square of 9, this tool calculates and plots the most critical price levels for the current trading day, helping you anticipate market turning points with greater clarity.
Key Features
Dynamic Gann Pivots: Automatically calculates and displays the central Pivot Point along with three levels of support (S1, S2, S3) and resistance (R1, R2, R3) based on the previous day's data.
Gann Square of 9 Levels: Implements Gann's esoteric mathematical formula to find natural harmonic price levels, plotting the most significant static support and resistance zones for the day.
Fully Customizable Display: You have complete control over the indicator's appearance. From the settings menu, you can:
Toggle each set of levels on or off (e.g., show only the Pivot and S1/R1).
Change the line style (Solid, Dashed, Dotted).
Adjust the position of the price labels (Left or Right).
Set the line extension length.
On-Chart Information Table: A clean, non-intrusive table on the top-right of your chart displays the exact values of all key levels for quick reference.
Built-in Alerts: Set alerts for when the price crosses the main Pivot, R1, or S1 levels, so you never miss a potential trading opportunity.
Core Concepts Explained
Gann Pivot Point: Calculated as (High + Low + Close) / 3 from the previous day, this level represents the intraday "balance point." Trading above the pivot is generally considered bullish for the session, while trading below it is bearish.
Gann Square of 9: This is a more advanced Gann method based on the principle that prices move in a predictable way related to their square roots. This indicator calculates the most powerful "cardinal cross" levels, which often act as major reversal points.
How to Use This Indicator
Identify the Intraday Trend: Use the main Pivot Point as your guide. If the price is consistently holding above the pivot, look for buying opportunities. If it's holding below, look for shorting opportunities.
Look for Confluence: The most powerful signals occur when a Gann Pivot level lines up closely with a Square of 9 level. This "confluence" creates an extremely strong support or resistance zone.
Breakout Trading: When the price breaks decisively through a key level (e.g., R1), the next level above it (R2) becomes the logical price target.
Range Trading: In a sideways market, you can use the support and resistance levels as boundaries to trade between. Consider entering a long trade near a strong support level and taking profit near resistance.
Disclaimer: This indicator is for educational and informational purposes only. It does not constitute financial advice. Trading involves significant risk, and you should always conduct your own research and risk management before entering any trade.

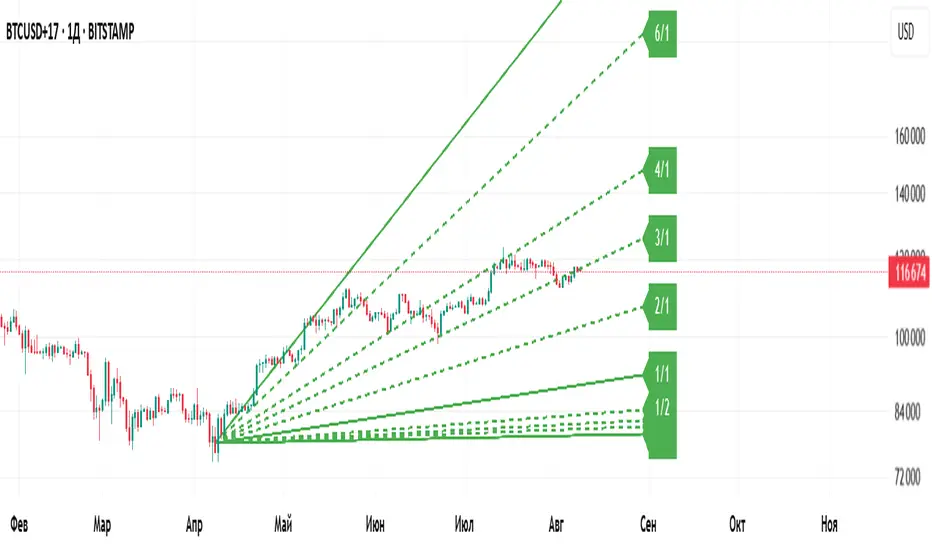
Gann Fan Master – Selectable Base Angle & Fibonacci AnglesGann Fan Master – Selectable Base Angle & Fibonacci Angles
This indicator plots a Gann Fan from point A1 through point B1, with full customization over:
Base angle selection (8/1, 1/1, 1/8)
Main angle set
Fibonacci-based angles
Up to 10 custom user-defined angles
Logarithmic or linear slope calculation
Custom fan color and extended line length
Perfect for manual chart analysis — you select A1 and B1, the script calculates and draws the fan with labeled angles.
How It Works
-Select A1 (time & price) and B1 (time & price).
-The script calculates the base slope depending on the selected base angle:
Linear scale: slope = (B1 − A1) / Δt / base_angle_value
Logarithmic scale: slope = (ln(B1) − ln(A1)) / Δt / base_angle_value
-Each enabled angle is drawn from A1, extended by the chosen number of bars, and labeled with its value.
-Fan color is determined automatically by direction (green for upward, red for downward) or can be overridden.
Quick Start
-Add the indicator to your chart.
-In settings:
A1 Time/Price — starting point.
B1 Time/Price — second point (defines slope).
Base Angle — choose 8/1, 1/1, or 1/8.
Extend Fan (Bars) — number of bars to extend lines into the future.
Logarithmic Fan Calculation — toggle for log-scale mode.
Enable desired angle sets: Main, Fibonacci, or Custom.
-Optionally, enable Use Custom Fan Color and set your own color.
Settings
Enable Fan — master switch.
A1 Time/A1 Price, B1 Time/B1 Price — anchor points.
Base Angle — 8/1, 1/1, 1/8.
Extend Fan (Bars) — extension length.
Use Custom Fan Color / Fan Color — manual color override.
Main Angles — 1/8, 1/4, 1/3, 1/2, 1/1, 2/1, 3/1, 4/1, 6/1, 8/1.
Fibonacci Angles — 0.214, 0.35, 0.382, 0.618, 0.786, 0.886, 0.9335, 1.118, 1.236, 1.382, 1.618.
Custom Angles — up to 10 values (dotted lines), labels from the exact value.
Usage Tips
-Choosing A1 and B1:
A1 — significant starting swing high or low.
B1 — next key swing to define slope.
-Logarithmic scale:
Ideal for long-term exponential trends (crypto, growth stocks).
Prices must be > 0.
-Watch how price reacts to different angles:
1/1 as median trend, fractional for support/resistance, multiples for acceleration/slowdown.
Disclaimer
This is a technical analysis tool. It is not financial advice. Trading decisions are made at your own risk.
Gann Fan Master – Selectable Base Angle & Fibonacci Angles
Индикатор строит веер Ганна от точки A1 через точку B1 с полной кастомизацией:
Выбор базового угла (8/1, 1/1, 1/8)
Набор основных углов
Углы Фибоначчи
До 10 пользовательских углов
Расчёт в логарифмической или линейной шкале
Цвет веера по направлению или заданный вручную
Настройка длины продления линий
Идеально подходит для ручного анализа графика — вы задаёте A1 и B1, а скрипт рассчитывает и строит веер с подписями углов.
Как это работает
-Задайте A1 (время и цена) и B1 (время и цена).
-Скрипт рассчитывает базовый наклон в зависимости от выбранного базового угла:
Линейная шкала: наклон = (B1 − A1) / Δt / base_angle_value
Логарифмическая шкала: наклон = (ln(B1) − ln(A1)) / Δt / base_angle_value
-Каждый включённый угол рисуется из точки A1, продлевается на заданное число баров и подписывается.
-Цвет линий определяется автоматически по направлению (зелёный — вверх, красный — вниз) или задаётся вручную.
Быстрый старт
1)Добавьте индикатор на график.
2)В настройках:
A1 Time/Price — начальная точка.
B1 Time/Price — вторая точка (задаёт наклон).
Base Angle — выберите 8/1, 1/1 или 1/8.
Extend Fan (Bars) — длина продления линий в барах.
Logarithmic Fan Calculation — переключатель логарифмического режима.
Включите нужные блоки углов: Main, Fibonacci, Custom.
3)При желании активируйте Use Custom Fan Color и задайте цвет веера.
Настройки
Enable Fan — общий выключатель.
A1 Time/A1 Price, B1 Time/B1 Price — опорные точки.
Base Angle — 8/1, 1/1, 1/8.
Extend Fan (Bars) — продление линий.
Use Custom Fan Color / Fan Color — цвет вручную.
Main Angles — 1/8, 1/4, 1/3, 1/2, 1/1, 2/1, 3/1, 4/1, 6/1, 8/1.
Fibonacci Angles — 0.214, 0.35, 0.382, 0.618, 0.786, 0.886, 0.9335, 1.118, 1.236, 1.382, 1.618.
Custom Angles — до 10 значений (точечные линии) с подписями.
Советы по применению
Выбор A1 и B1:
A1 — значимый экстремум начала движения.
B1 — следующий важный экстремум для задания наклона.
Логарифмическая шкала:
Подходит для долгосрочных экспоненциальных трендов (крипто, акции роста).
Цена должна быть > 0.
Следите, как цена реагирует на разные углы:
1/1 — медианный тренд.
Дробные углы — потенциальная поддержка/сопротивление.
Кратные — ускорение/замедление движения.
Дисклеймер
Это инструмент технического анализа и не является инвестиционной рекомендацией. Торговые решения вы принимаете на свой страх и риск.
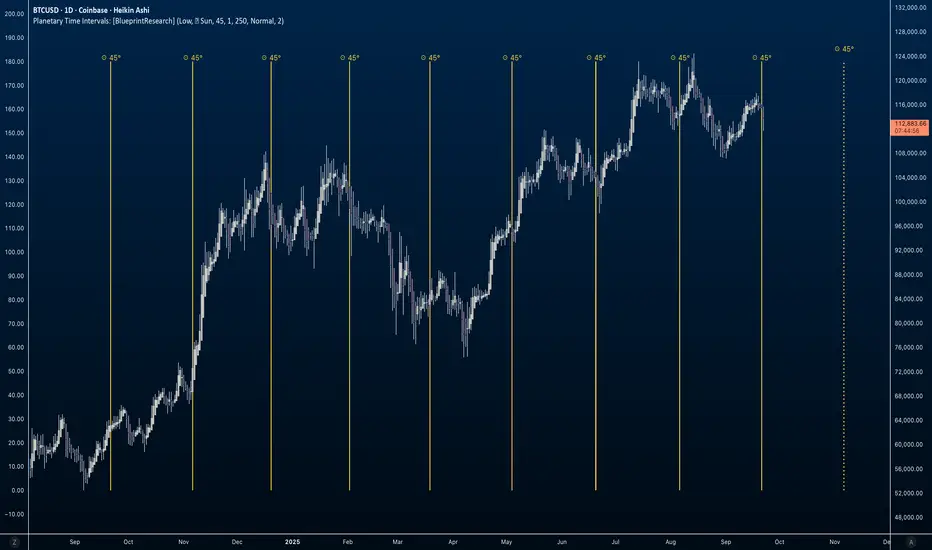
Planetary Time Intervals [Javonnii]🪐 Planetary Time Intervals Indicator 🪐
This innovative planetary time-based market timing indicator enables traders to analyze and project planetary degree intervals directly onto any chart with exceptional accuracy. Built on a custom planetary framework, it calculates planetary positions down to the arc-second across all timeframes, accommodating up to 500 future bars. This capability allows for both clean intraday analysis and long-term market timing.
The framework operates autonomously and requires no external data or updates. It reliably computes planetary positions across centuries and supports seamless analysis across all markets—whether 24/7 assets like crypto or session-based instruments like stocks—with smooth, gap-free planetary data on any ticker or timeframe. Perfect for time-based market studies on deep historical datasets such as the Dow Jones.
🔶 FEATURES
Key planetary timing tools include:
- Standard Degree Interval Plotting (Fixed Increments)
- Price-to-Planetary Degree Conversions (360 Units Reduction & 1/10 Price Method) for Direct Price-to-Time Harmonics
- Geocentric & Heliocentric Models (Including Moon for Lunar Cycles)
- Absolute Degree Handling for Retrogrades
- Visual Projections: Background Highlights, Vertical Lines, and Degree Labels
- Math Display for Calculation Transparency
- Scaling Adjustments for Volatile Assets (e.g., Crypto, Indices)
- Multi-Timeframe Support Up to 500 Bars
- Alert Conditions for Interval Projections
- Customizable Interval Logic and Styling
- + More (Check changelog for updates)
🔶 BASIC DEMONSTRATION
On a daily stock chart, select a key low as your reference point (datetime and price). Choose a 30° interval for Mercury, and the indicator projects vertical lines forward at each degree milestone, with shaded backgrounds indicating potential cycle zones. Labels display traversed degrees, highlighting alignments in real-time.
For the 360 Conversion, input a price like $5,000—it reduces to 320° via modular arithmetic (5000 mod 360 = 320°), converting the price directly into a planetary time interval that may sync with numerological patterns or past turns.
🔶 USAGE & EXAMPLES
In the image below, the indicator is applied to a long-term weekly BTCUSD chart from 2015 to 2026. Selecting a historical low point (price = 198.02) as the reference, the 360 Conversion method derives the interval directly from the price. Since 198.02 is already under 360, the interval is simply 198.02° (no further reduction needed). Vertical yellow lines project these Sun-based intervals forward, aligning with a few key market turns, bull runs, and corrections. The math is displayed in the label "198.02° Low = 198.02° 360 Conversion 198.02°", illustrating the price-to-planetary time conversion process. Numerology enthusiasts might reduce 198.02° further (1+9+8+0+2=20, then 2+0=2) for symbolic insights into market balance or duality.
Supported planets: Sun, Moon, Mercury, Venus, Mars, Jupiter, Saturn, Uranus, Neptune, Pluto.
🔶 SETTINGS
- Timing Method: Select Standard Interval, 360 Conversion, or 1/10 Price.
- Planetary View: Geocentric/Heliocentric; Toggle Moon Inclusion.
- Interval Setup: Enter degrees (e.g., 45°); Enable Absolute for Retrogrades.
- Base Reference: Input datetime and price from high/low.
- Visuals: Toggle highlights, lines, math labels; Set colors/styles.
- Scaling: Adjust for asset ranges (e.g., multipliers for high or low prices).
- Limits: Bar count (up to 500)
- Styling: Label formats, projection options.
🔶 CONCLUSION
Planetary and numerological timing offers a unique lens on market rhythms, blending celestial mechanics with number-based insights for deeper analysis. This indicator is an original creation providing precise, flexible tools to explore these concepts, with a strong focus on converting price data into actionable planetary time intervals. As with all trading, past patterns aren't guarantees—pair with sound risk management and your overall approach.
🔶 HOW TO GET ACCESS
This public invite-only script is for planetary traders, market analysts, numerology enthusiasts, and anyone interested in harmonic degree-based timing. Reach out to the author for access details to this indicator and related resources.
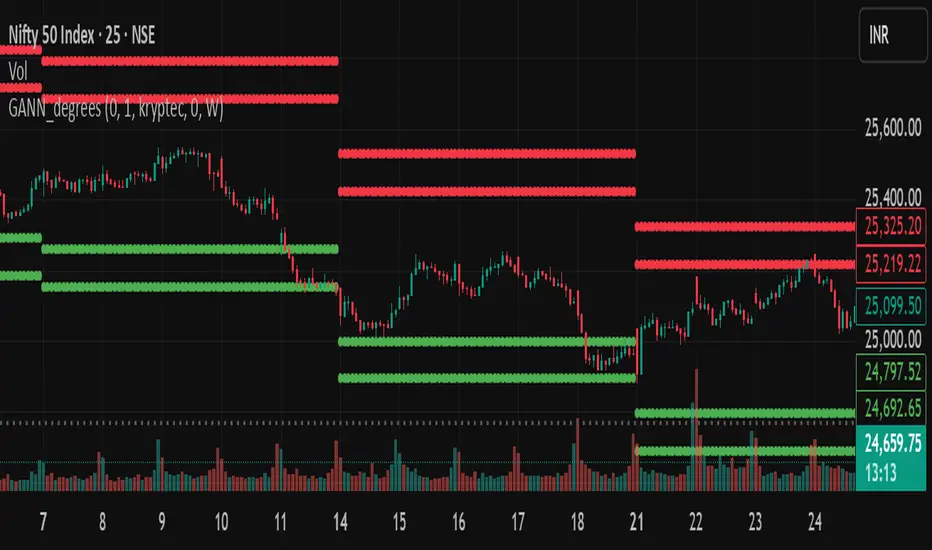
Gann Square of 9 cardinal cross and trinesGann Square of 9
This indicator is a powerful tool for traders who use W.D. Gann's methodologies to forecast potential support and resistance levels. It visualizes key price levels derived from the Gann Square of 9, a classic tool in technical analysis that relates price and time through geometric angles and rotations.
How It Works
The Gann Square of 9 is a spiral number chart where price moves in a clockwise spiral. Key angles on this square (such as 90°, 180°, 270°, and 360°) are used to identify price levels that act as magnets for future price action. This indicator automates that process by calculating these levels dynamically from a chosen pivot point.
Key Features
This script provides comprehensive and customizable functionality, including several unique enhancements:
Customizable Pivot Point: Choose your pivot price source from various options, including open, high, low, close, hl2, hlc3, ohlc4, and kryptec.
Dynamic Pivot Updates: The indicator can automatically reset its pivot price at the beginning of a new period (e.g., a new day, week, or month), allowing the levels to adapt to recent market changes.
Fixed Pivot Option: To prevent the indicator from changing when you scroll through historical data, you can choose to use a fixed pivot price. This anchors the levels to a specific value, ensuring they remain constant regardless of the visible chart range.
Extended Gann Angles: In addition to the traditional 90°, 180°, and 270° levels, this script also includes the 120° and 240° angles for more granular analysis of potential turning points.
Multiplier and Rotations: Fine-tune the distance between the Gann levels with the multiplier input. The rotations parameter allows you to raise or lower the entire set of levels by one or more 360° rotations, adapting the indicator to different price ranges.
How to Use
Choose Your Pivot: The indicator's levels are all based on a single pivot price.
For a static analysis, enable "Use Fixed Pivot Price?" and enter a specific price you want to anchor your analysis to.
For a dynamic analysis, select your desired "Resolution" (e.g., 'W' for weekly) and the pivot price will be set based on the previous period's data.
Adjust Rotations: Use the rotations input to shift the entire set of levels up or down until they align with a significant support or resistance area on your chart.
Analyze Levels: The plotted lines represent potential support and resistance zones. A price move through one level may target the next one in the sequence.
Disclaimer: This indicator is a tool for technical analysis and should not be considered financial advice. Past performance of these levels does not guarantee future results. Always use proper risk management and conduct your own research before making any trading decisions.
THOT_GANNThis indicator is based on wd Gann square of 9 levels
i added 3 ema 50 100 and 200 to follow a right trend
also i added VWAP to understand buyer is aggressive or seller.
now study all together we can trade on breakout and reversal.

Vibration IMP LevelsIts IMP levels to trade on the bases of Vibration date of each stock and it will plot levels on the bases of stocks.
It will work on F&O stocks only.

Gann Single Square Swing Trading System with Gann AnglesGann Single Square Swing Trading System
This script automatically detects "squares" - geometric patterns where price movement equals time movement. When price moves the same distance as the number of bars (time), it creates powerful support/resistance levels based on Gann theory.
Key Visual Elements
• Box: The detected square pattern
• Dark Blue Line (50%): Most important trading level
• Green Lines: Profit target levels (125%, 150%)
• Red Lines: Stop loss levels (-25%, -50%)
• Colored Angle Lines: Gann angles for trend direction
• Quality Score: Blue label showing setup strength (aim for 70%+)
Simple Trading Rules
LONG Trades (Green 🟢 Square)
1. Entry: Buy when price touches the dark blue 50% line from above
2. Stop Loss: Place below the red -25% line
3. Take Profit: Exit at green 125% line (first target) or 150% line (second target)
SHORT Trades (Red 🔴 Square)
1. Entry: Sell when price touches the dark blue 50% line from below
2. Stop Loss: Place above the red -25% line
3. Take Profit: Exit at green 125% line (first target) or 150% line (second target)
Entry Checklist
✅ Square quality score > 70%
✅ Price touches 50% level (dark blue line)
✅ Volume above average (if volume filter enabled)
✅ Clear square formation visible
Alerts
The script generates automatic alerts when price reaches the 50% trading level. Enable alerts in TradingView to get notified of setups.
Bottom Line: Wait for the alert → Check quality score → Enter at 50% level → Set stop at red line → Take profit at green line.

Angled Gann Time-Price Squares with S/RThis is a Pine Script indicator that implements Angled Gann Time-Price Squares based on W.D. Gann's trading theory. Here's what it does:
Core Functionality
Detects pivot highs and lows using a configurable lookback period
Creates angled squares by connecting pivot points to current price action when specific geometric conditions are met
Validates square formation by checking if the price movement follows proper Gann angles (typically 45°, 135°, etc.) within a tolerance range
Key Features
Real-time square tracking: Shows both completed squares and forming squares in progress
Support/Resistance levels: Automatically generates S/R lines from:
Square edge extensions
Diagonal extensions (pivot centers)
Quarter/half levels within squares (25%, 50%, 75%)
Visual feedback: Color-coded squares (green for up, red for down, orange for forming)
Projection lines: Predicts where squares might complete based on Gann angle theory
Gann Theory Application
The indicator follows Gann's principle that time and price move in geometric harmony. It looks for price movements that form perfect squares when plotted on a chart, where the diagonal of the square represents the natural flow of price and time at specific angles.
The generated support/resistance levels are particularly valuable because they're based on completed geometric patterns rather than just horizontal price levels, making them potentially more significant according to Gann methodology.

Gann Octave 8 - Professional V 1.0Gann Octave 8 Indicator:
Core Concept: This indicator divides the price range between highest high and lowest low into 8 equal parts (octaves), creating support/resistance levels based on W.D. Gann's trading principles.
Key Components:
1. Price Range Calculation:
o Finds highest high and lowest low over a lookback period (default 50 bars)
o Divides this range into 8 equal segments (12.5% each)
2. 8 Octave Levels:
o 0% (Low Support) - Strongest support
o 12.5%, 25%, 37.5% - Minor levels
o 50% (CRITICAL) - Most important level
o 62.5%, 75%, 87.5% - Minor levels
o 100% (High Resistance) - Strongest resistance
3. Gann Angles: Projects trend lines from high/low points at various angles (1x1, 2x1, 1x2, etc.)
4. Visual Features:
o Color-coded levels
o Information table showing current position
o Background highlighting when near critical levels
o Trend analysis (bullish/bearish zones)
Trading Strategy
Entry Signals:
BULLISH TRADES:
• Price crosses above 50% level → Strong buy signal
• Price bounces from 25% or 37.5% levels → Support bounce
• Price in upper zone (above 50%) → Bullish bias
BEARISH TRADES:
• Price crosses below 50% level → Strong sell signal
• Price rejects at 75% or 87.5% levels → Resistance rejection
• Price in lower zone (below 50%) → Bearish bias
Key Trading Rules:
1. 50% Level is Critical: Most important for trend direction
2. Zone Trading:
o Above 50% = Bullish zone (look for longs)
o Below 50% = Bearish zone (look for shorts)
3. Strength Levels:
o Above 75% or below 25% = Strong moves
o Near 100% (high) or 0% (low) = Extreme levels
Risk Management:
• Stop Loss: Place below previous octave level
• Take Profit: Target next octave level
• Position Size: Reduce size near extreme levels (0%, 100%)
Example Trade:
If price breaks above 50% level:
• Entry: Long position
• Stop: Below 37.5% level
• Target: 75% level
• Risk: Monitor for rejection at resistance levels
The indicator works best in trending markets and helps identify high-probability reversal zones.
Works for both Stocks & Derivatives. Experiment with code and share your feedback in comments..

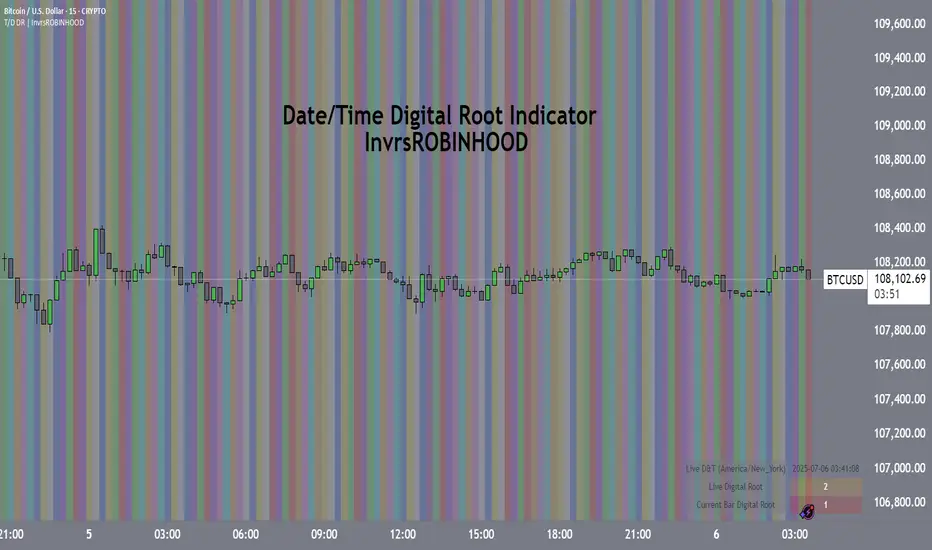
Time/Date Digital Root Indicator | InvrsROBINHOODTime/Date Digital Root Indicator | InvrsROBINHOOD
Uncover the hidden numerical rhythm of the markets with the Time/Date Digital Root Indicator. This unique tool is designed for traders who look beyond standard price and volume, exploring the cyclical and vibrational nature of time itself. It translates the essence of any time and/or date into a single-digit number from 1 to 9—its "Digital Root"—providing a novel layer of analysis for your charts.
How It Works
The indicator analyzes the market's timeline, converting user-selected components of the date (Year, Month, Day) and time (Hour, Minute, Second) into a foundational Digital Root number. This number represents the "vibrational signature" of that moment, which is then plotted visually on your chart.
Key Features
Flexible Calculation Engine: Choose your source for the calculation. Analyze the rhythm of the Time, the Date, or a powerful combination of Date & Time.
Granular Control: Fine-tune the calculation by including or excluding individual components. Want to see the rhythm of just the hour and minute? Or the full energy of the year, month, and day combined? You have complete control.
Rich Visualizations:
Background Coloring: Instantly identify market "regimes" as the chart background changes color based on the prevailing Digital Root of each bar.
Vertical Lines: Pinpoint key moments of transition by displaying a vertical line whenever the Digital Root changes from one number to the next.
Dual-Mode Info Panel: A powerful on-chart table displays both the "Live Digital Root" (updating in real-time with every tick of the clock) and the "Current Bar Digital Root" (reflecting the static value from the bar's open). This allows you to compare the immediate, live "energy" to the established "energy" of the current timeframe.
How a Trader Can Use This Indicator
This tool is not a standalone signal generator but a unique lens to enhance your market perspective. Here are a few ways traders can incorporate it:
Identify Market Regimes: Use the background colors to spot zones of influence. You might notice that price trends strongly when the Digital Root is a "4" (Green), but ranges or reverses when it shifts to a "7" (Purple). This can help you adapt your strategy to the current market "theme."
Pinpoint Potential Pivots: The vertical lines highlight a change in the numerical rhythm. A shift in the Digital Root can often precede or coincide with a shift in price momentum. Pay close attention to price action around these lines, as they can flag potential turning points.
Find Confluence: Use a Digital Root change as a confirmation signal for your existing strategy. For example, if you see a bullish divergence on the RSI that aligns with a vertical line marking a Digital Root shift, it could add significant weight to your trade idea.
Analyze Live vs. Static Energy: The info panel offers a sophisticated view. If the "Current Bar Digital Root" is a stable "5" but the "Live Digital Root" is rapidly fluctuating between "8" and "9", it could suggest that underlying pressure is building for a volatile move, even if the current bar looks calm.
Gann Ultimate Time-Price Squares Method V 1.0This Script is an outcome of my Passion towards Gann Theory and his Methodology towards Trading.
The Script is still Evolving.So wait for more updates....
# Complete Trading Guide: Gann Time-Price Squares Indicator
## 🎯 Core Trading Philosophy
**Gann's Key Principle**: "When time and price come together, a change in trend occurs."
Your indicator identifies these critical moments where **Time = Price**, creating high-probability trading opportunities.
---
## 📊 Setup & Configuration
### Recommended Settings by Timeframe
| Timeframe | Pivot Lookback | Min Price Move | Tolerance | Use Case |
|-----------|---------------|----------------|-----------|----------|
| **1-5 min** | 5-8 bars | 0.5-1.0 | 1.0-2.0 | Scalping |
| **15-30 min** | 8-12 bars | 1.0-3.0 | 1.5-2.5 | Day Trading |
| **1-4 hour** | 10-15 bars | 2.0-5.0 | 2.0-3.0 | Swing Trading |
| **Daily** | 15-25 bars | 5.0-20.0 | 3.0-5.0 | Position Trading |
### Initial Setup Steps
1. **Add indicator** to your chart
2. **Set lookback period** based on your timeframe
3. **Adjust tolerance** - start with 2.0 and fine-tune
4. **Enable all visualizations** initially
5. **Position info table** where it doesn't block price action
---
## 🚀 Trading Strategies
### Strategy 1: Square Completion Reversal Trading
#### **Long Entry Setup**
```
CONDITIONS:
✅ Bullish square completes (green box appears)
✅ Info table shows "✅ COMPLETED" status
✅ Price bounces off square's bottom edge
✅ Volume increases on bounce
✅ RSI < 30 (oversold confirmation)
ENTRY: Market buy when price breaks above square's top edge
STOP: Below square's bottom edge (-2 ATR)
TARGET: Next resistance level or 1:2 Risk/Reward
```
#### **Short Entry Setup**
```
CONDITIONS:
✅ Bearish square completes (red box appears)
✅ Info table shows "✅ COMPLETED" status
✅ Price rejects square's top edge
✅ Volume increases on rejection
✅ RSI > 70 (overbought confirmation)
ENTRY: Market sell when price breaks below square's bottom edge
STOP: Above square's top edge (+2 ATR)
TARGET: Next support level or 1:2 Risk/Reward
```
### Strategy 2: Gann Angle Trend Following
#### **1x1 Angle (45°) - The Master Angle**
- **Most Important**: This is Gann's primary trend line
- **Bullish**: Price above 1x1 = uptrend intact
- **Bearish**: Price below 1x1 = downtrend intact
- **Break**: 1x1 angle break = major trend change
#### **Multi-Angle Confluence Trading**
```
STRONG BULLISH SIGNAL:
✅ Price above 1x1 angle (45°)
✅ Bouncing off 2x1 angle (support)
✅ Volume increasing
✅ Multiple angles pointing up
ENTRY: Buy on 2x1 angle bounce
STOP: Below 1x2 angle
TARGET: Next angle resistance
```
### Strategy 3: Projection Trading (Forming Squares)
#### **Anticipation Strategy**
```
SETUP IDENTIFICATION:
👀 Info table shows "⚡ FORMING" status
👀 Progress bar > 70%
👀 P/T Ratio approaching 1.00
👀 Price approaching projected completion zone
ENTRY PREPARATION:
- Set alerts for projected completion levels
- Prepare for reversal at projection zone
- Watch for volume confirmation
- Monitor momentum indicators
```
## 📈 Step-by-Step Trading Process
### Phase 1: Market Analysis (Before Trading)
1. **Check Market Trend**: Look at info table trend indicator
2. **Identify Active Pivots**: Note last significant high/low
3. **Assess Volatility**: High volatility = larger stops needed
4. **Review Completed Squares**: These become support/resistance zones
### Phase 2: Trade Setup Identification
1. **Monitor Forming Squares**: Watch progress bars in info table
2. **Check Gann Angles**: Are they supporting or opposing your bias?
3. **Confirm with Volume**: Look for volume spikes at key levels
4. **Set Alerts**: Use TradingView alerts for completion zones
### Phase 3: Trade Execution
1. **Wait for Confirmation**: Don't trade on projections alone
2. **Enter on Breakout**: Price breaking square boundaries
3. **Set Stops Immediately**: Use square edges as stop levels
4. **Scale Out**: Take partial profits at angle intersections
### Phase 4: Trade Management
1. **Trail Stops**: Use Gann angles as trailing stop levels
2. **Monitor Progress**: Watch for new square formations
3. **Exit Signals**: New squares in opposite direction
4. **Review Performance**: Analyze win/loss against square accuracy
---
## 🎯 High-Probability Setups
### Setup A: Double Confirmation
```
BULLISH EXAMPLE:
1. Bullish square completes at major support
2. Price bounces off 1x1 Gann angle
3. Volume surge confirms reversal
4. RSI divergence present
PROBABILITY: 75-80%
RISK/REWARD: 1:3 typical
```
### Setup B: Angle Breakout
```
BEARISH EXAMPLE:
1. Price breaks below 1x1 angle
2. Bearish square forming below break
3. Multiple angles now resistance
4. Volume confirms breakdown
PROBABILITY: 70-75%
RISK/REWARD: 1:2.5 typical
```
### Setup C: Time Cycle Convergence
```
REVERSAL EXAMPLE:
1. Square completion at time cycle high/low
2. Multiple Gann angles converging
3. Momentum divergence
4. Volume climax
PROBABILITY: 80-85%
RISK/REWARD: 1:4 possible
```
---
## ⚠️ Risk Management Rules
### Position Sizing
- **Conservative**: 1-2% risk per trade
- **Aggressive**: 2-3% risk per trade
- **Never exceed**: 5% total portfolio risk
### Stop Loss Guidelines
- **Completed Squares**: Opposite edge + 1 ATR
- **Gann Angles**: Below/above angle + 0.5 ATR
- **Projections**: 50% of square height
### Take Profit Targets
- **Target 1**: Next Gann angle (1:1 R/R)
- **Target 2**: Next completed square (1:2 R/R)
- **Target 3**: Major S/R level (1:3 R/R)
---
## 📊 Reading the Info Table for Trading
### Market Trend Section
```
📈 BULLISH → Look for long setups
📉 BEARISH → Look for short setups
➡️ NEUTRAL → Wait for direction
```
### Volatility Status
```
🔥 HIGH → Larger stops needed
⚡ ELEVATED → Normal stops
😴 LOW → Tighter stops possible
📊 NORMAL → Standard approach
```
### Square Progress Monitoring
```
✅ COMPLETED → Ready to trade
⚡ FORMING → Prepare for setup
🔥 ACTIVE → Monitor closely
⏳ WAITING → No immediate action
```
### P/T Ratio Interpretation
```
🎯 Perfect (0.8-1.2) → High probability setup
⚡ Good (0.6-1.4) → Moderate probability
⚠️ Watch (outside range) → Lower probability
```
---
## 🔄 Common Trading Scenarios
### Scenario 1: Trend Continuation
**Setup**: Price pulls back to completed square in uptrend
**Action**: Buy at square support with 1x1 angle confirmation
**Management**: Trail stop below each new square formation
### Scenario 2: Reversal Trading
**Setup**: Multiple squares complete at major S/R
**Action**: Fade the move when price rejects square edges
**Management**: Quick profits, tight stops
### Scenario 3: Breakout Trading
**Setup**: Price consolidates in square, then breaks out
**Action**: Trade breakout direction with volume confirmation
**Management**: Use opposite square edge as stop
---
## 📱 Alert Setup Recommendations
### Critical Alerts
1. **Square Completion**: "Gann Square Completed - Check for reversal"
2. **1x1 Angle Break**: "Master angle broken - Trend change possible"
3. **Projection Reached**: "Forming square at 90% - Prepare for reversal"
4. **Multi-Angle Touch**: "Price at angle confluence - High probability setup"
---
Remember: **Gann analysis is both art and science**. The indicator provides the mathematical framework, but successful trading requires patience, discipline, and continuous learning. Start with small positions while you master the methodology!

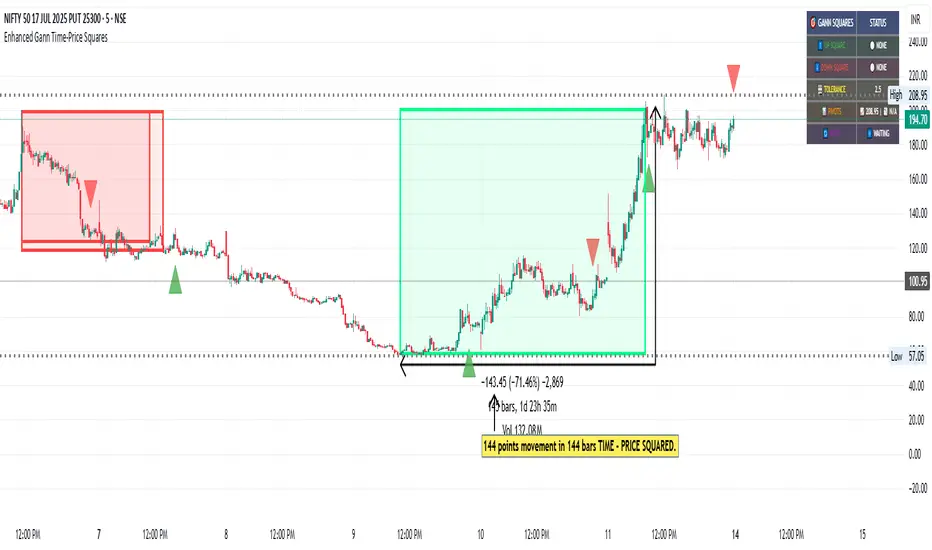
Enhanced Gann Time-Price SquaresEnhanced Gann Time-Price Squares Indicator
A comprehensive Pine Script indicator that identifies and visualizes W.D. Gann's time-price square formations on your charts. This tool helps traders spot potential market turning points where time and price movements align according to Gann's legendary market theories.
Key Features:
Automatic Square Detection - Identifies completed squares where price movement equals time movement
Future Projections - Shows forming squares with projected completion points
Pivot Integration - Automatically detects pivot highs/lows as square starting points
Visual Clarity - Clean box outlines with customizable colors and styles
Smart Filtering - Prevents overlapping squares and includes minimum move thresholds
Real-time Status - Information table showing current square formations
How to Use:
The indicator draws boxes when price moves from pivot points equal the time elapsed (number of bars). Green squares indicate upward movements, red squares show downward movements. Dashed lines show forming squares, while dotted lines project where they might complete.
Settings:
Adjust pivot sensitivity and minimum price moves
Customize tolerance for time-price matching
Toggle projections, labels, and visual elements
Fine-tune colors and line styles
Perfect for Gann theory practitioners and traders looking for time-based market analysis. The squares often coincide with significant support/resistance levels and potential reversal points.
Compatible with all timeframes and instruments.
More updates to follow
Gann Single SwingGann Single Swing Indicator
The Gann Single Swing indicator is a sophisticated tool rooted in the geometric and cyclical market analysis principles pioneered by William Delbert Gann. Designed for traders who value deep market structure analysis, this indicator leverages the interplay of price and time to identify key support and resistance zones, potential reversal points, and critical price-time synchronization areas. Its unique approach makes it an invaluable instrument for those employing Gann-based methodologies or seeking a systematic way to decode complex market dynamics.
What It Does
The Gann Single Swing indicator is built to pinpoint high-probability zones for price action, such as support and resistance levels, where traders can logically initiate long or short positions. By analyzing a user-defined price swing (a move between two selected points, such as a local high and low), the indicator constructs a geometric framework that reveals hidden patterns in market movements. It identifies:
Support and Resistance Zones: Key price levels where the market is likely to reverse or consolidate.
Temporal Reversal Zones: Specific time periods where price reversals are more probable due to time-price resonance.
Price-Time Synchronization Points: Areas where price and time align to signal potential market turning points.
How It Works
The indicator’s algorithm is grounded in Gann’s geometric principles, focusing on the relationship between price movements and time cycles. Here’s a high-level overview of its process:
Swing Selection: Traders select two key points on the chart (e.g., a local minimum and maximum) to define a price swing.
Channel Construction: The swing is encapsulated within a dynamic channel, forming the foundation of the geometric model.
Gann Fan Application: A Gann Fan is applied to the channel to calculate critical angles, representing the balance between price and time. These angles help identify resonant points that align with the channel’s central axis.
Squared Channel Analysis: The algorithm creates “squared” channels, geometrically derived sub-structures, analyzed for intersections and alignments to project external support and resistance zones beyond the base swing.
Internal Zone Mapping: Within the base swing, a reverse Gann Fan maps internal zones, highlighting areas of price-time convergence that may act as dynamic support or resistance.
Zone Projection: The indicator synthesizes these calculations to plot precise zones of support, resistance, and potential reversals, both spatially (price levels) and temporally (time-based zones).
While the exact mathematical formulations remain proprietary, the indicator relies on time-tested Gann techniques, such as angle-based analysis and cyclical resonance, to deliver actionable insights.
How to Use It
Select the Swing: Identify two significant points on the chart (e.g., a recent high and low) to define the swing. These points serve as the anchor for the indicator’s calculations.
Interpret the Zones: The indicator plots support and resistance zones (both price-based and time-based). Look for price action near these zones to identify potential entry or exit points.
Combine with Other Tools: For best results, use alongside other Gann-based tools (e.g., Gann Squares or Time Cycles) or traditional technical analysis (e.g., trendlines, Fibonacci levels) to confirm signals.
Monitor Temporal Zones: Pay attention to time-based reversal zones, as they may indicate when a price move is likely to occur, enhancing trade timing.
Why It’s Unique
Unlike conventional indicators that rely on moving averages, RSI, or other common metrics, the Gann Single Swing indicator offers a proprietary blend of Gann’s geometric and cyclical principles. Its ability to integrate price and time into a cohesive model sets it apart, providing traders with a deeper understanding of market structure. The indicator does not use public domain code or standard technical indicators, ensuring originality and value for traders seeking advanced tools.
Who It’s For
This indicator is ideal for:
Traders familiar with Gann’s methodologies who want to automate and enhance their geometric analysis.
Advanced traders looking to uncover hidden market patterns through price-time relationships.
Those seeking a robust, non-traditional tool for identifying high-probability trade setups.
The Gann Single Swing indicator is not a black-box forecasting tool but a powerful framework for dissecting market behavior. By combining user-defined inputs with sophisticated geometric calculations, it empowers traders to make informed decisions based on the timeless principles of Gann’s market philosophy.

Gann Swing PointsIndicator Logic
This is a GANN-style swing indicator that classifies bars based on their high/low structure relative to the previous bar.
I strongly encourage you to replay bars on Tradingview using this indicator to get a sense of how it creates pivot (or swing) points
Bar Classification:
Up-Bar (direction: 'up'): Higher High and Higher Low (HH/HL)
Down-Bar (direction: 'down'): Lower High and Lower Low (LH/LL)
Outside-Bar (generates 2 directions):
Green: 'down' then 'up'
Red: 'up' then 'down'
Inside-Bar: No direction generated (HL/LH)
Swing Line Logic
The swing line continues in the current direction until n opposite directions are detected.
n is the "n-direction" parameter (commonly set to 2, so 2 consecutive opposite direction is needed to turn the swing)
When n opposing directions occur, the swing turns, creating a pivot point
Inside bar is ignored, so e.g up-bar -> inside-bar -> up-bar generates "up", "up" direction
A top pivot is formed when the swing turns down
A bottom pivot is formed when it turns up
Note: This swing logic is inherently lagging — it only confirms tops/bottoms after the fact
This swing structure gives the system a clear and noise-resistant way to identify pivot points (swing-points)

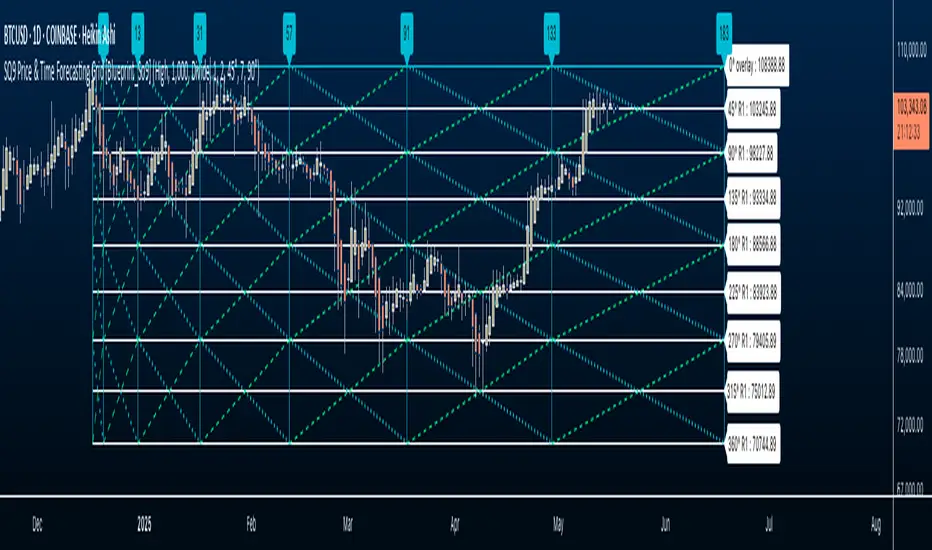
Square of Nine Price & Time Forecasting Grid📐 Square of Nine Price and Time Forecasting Grid
Adapted and Interpreted by Javonnii | Inspired by Patrick Mikula
The So9 Price and Time Forecasting Grid is a self-contained forecasting grid that allows traders to visually forecast levels in both price and time, using only Square of Nine calculations.
This indicator dynamically generates an expandable grid of angles, levels, and timeline based on the placement of a single anchor point, typically from a significant high or low. It requires no manual drawing or external tools.
🔍 How It Works:
The So9 Price and Time Forecasting Grid uses Square of Nine calculation and rotational logic to project price levels, time intervals, and internal angular structure from a single anchor point.
Once applied to the chart, the grid self-generates:
• Price levels using 360° degree Square of Nine intervals
• Timeline projections using Square of Nine progression intervals
• Diagonal and cardinal cross angles that dynamically propagate from the anchor
• Granular diagonal angle control, letting you refine internal grid resolution for tighter price structural analysis in relation to the forecasting grid.
⚙️ Setup Instructions
1. Select a Significant Pivot:
After loading the indicator, you’ll be prompted to select a significant high or low on your chart. This serves as the anchor point for the entire grid.
2. Price Grid Auto-Population:
Once anchored, Square of Nine price levels will automatically populate on the chart. These levels reflect Dynamic Square of Nine intervals from the anchor using rotational math.
3. Scale to Fit Your Instrument:
Use the provided UI settings to scale the grid to fit your instrument’s price structure. This ensures the levels align with actual historical price.
4. Engage Timelines:
Activate the timeline progression feature to generate forward-projected time intervals using Square of Nine-based timing logic. The entire grid can be extended up to 500 bars ahead on any timeframe.
5. Add Diagonal Angles:
Select which Square of Nine angle resolution you’d like to overlay from either the cardinal cross or diagonal cross based on Square of Nine geometry. This will populate diagonal levels within the grid, creating a full structural grid.
6. Customize Visuals:
You can toggle or hide price levels, timelines, or diagonal angles independently.
The entire grid can also be color-coded and customized to match your charting preferences.
All elements are plotted automatically. There is no manual drawing or calculation required. You can toggle the components on or off based on your workflow:
• Hide price levels if you just want time lines.
• Focus on angles without price levels.
• Use timeline progression independently.
📘 Attribution and Permission
This tool is inspired by concepts from "The Definitive Guide to Forecasting Using W.D. Gann’s Square of Nine" by Patrick Mikula.
The indicator reflects my personal adaptation and implementation of these forecasting principles within TradingView.
I have asked for and received permission from Patrick Mikula to share and publish tools derived from his work.
This applies to this script and to any other indicators I’ve developed that incorporate or build upon his material.
Documentation of this permission is available upon request.
Credit and respect to Patrick Mikula for his contributions to Gann-based research and for granting me the opportunity to share these tools with others.
ABC Market stage judgmentABC Stage Judgment Indicators · Introduction
Core ideology
The market situation is divided into three stages:
Zone B (Low Volatility Accumulation): Extremely low volatility, no trend, institutions accumulate chips.
Zone A (oscillation zone): The volatility has rebounded but there is no unilateral trend, suitable for short-term high selling and low buying.
Zone C (Trend Explosion): The volatility has significantly expanded and the trend is strong, making it profitable to follow the position.
Core Indicators
Volatility measurement
Bollinger Bands Width (BBWidth): 20 cycle moving average ± 2 σ bandwidth, reflecting relative volatility compression/release;
ATR (Average True Volatility): measures the absolute intensity of price volatility.
Trend Strength
ADX (Average Trend Index): measures the strength of a trend (without distinguishing direction),
ADX<20 → No trend (Zone B/A)
ADX>25 → Significant trend (Zone C)
Stage division logic
Zone B: Both BWidth and ATR are less than the set multiple of their respective historical means, and ADX is less than the threshold → "quiet bottoming out";
Zone C: ADX>threshold, and BBWidth or ATR>set multiple of their respective historical means, trading volume amplification → "trend takeoff";
Zone A: Time periods that do not belong to B/C are all classified as oscillation zones.
Optional enhanced filtering
Direction confirmation (+DI/- DI): avoid going against the trend;
Multi cycle verification (4H): in line with the trend of large-scale;
Momentum filtering (ROC/MACD/RSI): ensuring kinetic energy support;
ATR slope: Confirm the release of fluctuations;
Breakthrough Confirmation: Enter only after the breakthrough is confirmed at the closing level.
These filters are turned off by default and can be selected with one click for different scenarios such as "high-level oscillation", "low-level bottoming", "planting trees in the middle", etc.
usage
Multi cycle switching: Built in "5-minute/1-hour" two main cycles for free switching;
Visualization: The background color and labels display the current Zone at a glance;
Alarm: Stage switching automatically triggers an Alert, which can be pushed through mobile phones/Telegram.

Yearly History Calendar-Aligned Price up to 10 Years)Overview
This indicator helps traders compare historical price patterns from the past 10 calendar years with the current price action. It overlays translucent lines (polylines) for each year’s price data on the same calendar dates, providing a visual reference for recurring trends. A dynamic table at the top of the chart summarizes the active years, their price sources, and history retention settings.
Key Features
Historical Projections
Displays price data from the last 10 years (e.g., January 5, 2023 vs. January 5, 2024).
Price Source Selection
Choose from Open, Low, High, Close, or HL2 ((High + Low)/2) for historical alignment.
The selected source is shown in the legend table.
Bulk Control Toggles
Show All Years : Display all 10 years simultaneously.
Keep History for All : Preserve historical lines on year transitions.
Hide History for All : Automatically delete old lines to update with current data.
Individual Year Settings
Toggle visibility for each year (-1 to -10) independently.
Customize color and line width for each year.
Control whether to keep or delete historical lines for specific years.
Visual Alignment Aids
Vertical lines mark yearly transitions for reference.
Polylines are semi-transparent for clarity.
Dynamic Legend Table
Shows active years, their price sources, and history status (On/Off).
Updates automatically when settings change.
How to Use
Configure Settings
Projection Years : Select how many years to display (1–10).
Price Source : Choose Open, Low, High, Close, or HL2 for historical alignment.
History Precision : Set granularity (Daily, 60m, or 15m).
Daily (D) is recommended for long-term analysis (covers 10 years).
60m/15m provides finer precision but may only cover 1–3 years due to data limits.
Adjust Visibility & History
Show Year -X : Enable/disable specific years for comparison.
Keep History for Year -X : Choose whether to retain historical lines or delete them on new year transitions.
Bulk Controls
Show All Years : Display all 10 years at once (overrides individual toggles).
Keep History for All / Hide History for All : Globally enable/disable history retention for all years.
Customize Appearance
Line Width : Adjust polyline thickness for better visibility.
Colors : Assign unique colors to each year for easy identification.
Interpret the Legend Table
The table shows:
Year : Label (e.g., "Year -1").
Source : The selected price type (e.g., "Close", "HL2").
Keep History : Indicates whether lines are preserved (On) or deleted (Off).
Tips for Optimal Use
Use Daily Timeframes for Long-Term Analysis :
Daily (1D) allows 10+ years of data. Smaller timeframes (60m/15m) may have limited historical coverage.
Compare Recurring Patterns :
Look for overlaps between historical polylines and current price to identify potential support/resistance levels.
Customize Colors & Widths :
Use contrasting colors for years you want to highlight. Adjust line widths to avoid clutter.
Leverage Global Toggles :
Enable Show All Years for a quick overview. Use Keep History for All to maintain continuity across transitions.
Example Workflow
Set Up :
Select Projection Years = 5.
Choose Price Source = Close.
Set History Precision = 1D for long-term data.
Customize :
Enable Show Year -1 to Show Year -5.
Assign distinct colors to each year.
Disable Keep History for All to ensure lines update on year transitions.
Analyze :
Observe how the 2023 close prices align with 2024’s price action.
Use vertical lines to identify yearly boundaries.
Common Questions
Why are some years missing?
Ensure the chart has sufficient historical data (e.g., daily charts cover 10 years, 60m/15m may only cover 1–3 years).
How do I update the data?
Adjust the Price Source or toggle years/history settings. The legend table updates automatically.

Range + VWAP + Gann Levels + ZL AMA + Gann Square Num# Multi-Strategy Market Analysis Indicator
## Overview
This comprehensive indicator combines several powerful technical analysis tools to help traders identify potential price movements, market trends, and key support/resistance levels. By integrating price range prediction, volume-weighted averages, adaptive moving averages, and Gann-based mathematical levels, this indicator provides a complete toolkit for market analysis.
## Components & How They Work
### 1. Range Calculator
**What it does:** Calculates the expected price range based on current volatility, useful for predicting potential price movements during a specific time period.
**How it works:**
- Uses the current price level and VIX (Volatility Index) to estimate how far the price might move in a given number of days
- Applies the square root of time principle (volatility grows with the square root of time)
- Displays upper and lower bounds of the expected price range
- Shows the calculation details in a convenient table
**How to use it:**
- Enter the current price level, VIX value, and number of days
- red line indicates potential resistance
- green line indicates potential support
- Useful for options trading, setting stop-loss levels, or preparing for upcoming market events
### 2. Gann Square Numbers
**What it does:** Identifies mathematically significant price levels based on square numbers.
**How it works:**
- Takes the square root of the current price
- Calculates the next 5 square numbers above the current price (upper levels)
- Calculates the 5 square numbers below the current price (lower levels)
- Draws these levels as horizontal lines on the chart
**How to use it:**
- Pink lines (upper levels) show potential resistance levels
- Blue lines (lower levels) show potential support levels
- These mathematical levels often coincide with significant market reactions
- Based on W.D. Gann's theory that price tends to respect mathematical square numbers
### 3. Zero Lag Adaptive Moving Average (AMA)
Bullish Scenario
Bearish Scenario
**What it does:** Provides a dynamic moving average that adapts to changing market conditions, reducing lag during trends while filtering noise during sideways markets.
**How it works:**
- Calculates an "Efficiency Ratio" that measures the directional movement relative to volatility
- Adjusts the smoothing factor based on market efficiency
- Uses a faster smoothing factor during trending markets and slower smoothing during sideways markets
- Background color changes to indicate the trend direction (green for uptrend, red for downtrend)
**How to use it:**
- When price is above the AMA line with green background: Strong uptrend
- When price is below the AMA line with red background: Strong downtrend
- Helpful for trend identification and potential entry/exit points
### 4. Gann Stepline Levels
**What it does:** Creates dynamic support and resistance levels based on multiple SMAs (Simple Moving Averages) of different lengths.
**How it works:**
- Calculates two key dynamic levels:
- Gann 50% Level: Average of 90 and 144-period SMAs
- Gann Level: Average of six different SMAs (90, 144, 180, 216, 240, 288)
- These levels adjust automatically as the market evolves
**How to use it:**
- Blue line (Gann 50% Level) acts as dynamic support in uptrends and resistance in downtrends
- Orange line (Gann Level) serves as a longer-term trend indicator
- Price interaction with these levels often indicates potential reversal or continuation points
### 5. Anchored VWAP (Volume-Weighted Average Price)
**What it does:** Shows the average price weighted by volume starting from a specific anchor point.
**How it works:**
- Calculates the average price weighted by volume from a chosen anchor period (Session, Day, Week, Month)
- Resets calculations at the beginning of each new period
- Shows where the current price is relative to the average trading price
**How to use it:**
- Price above VWAP: Bullish bias, buyers are in control
- Price below VWAP: Bearish bias, sellers are in control
- VWAP often acts as dynamic support/resistance level
- Institutional traders often use VWAP for order execution
## Key Benefits
- **Comprehensive Analysis:** Combines volatility-based, trend-following, volume-weighted, and mathematical approaches
- **Multi-timeframe Perspective:** Different components operate on various timeframes for a complete market view
- **Visual Clarity:** Color-coded lines and background help quickly identify market conditions
- **Customizable Components:** Range Calculator, VWAP, and Gann Square Numbers can be adjusted to fit your trading style
## How to Interpret When Used Together
- **Strong Trend Confirmation:** When AMA shows a trend and price respects the Gann Dynamic levels
- **Reversal Signals:** When price reaches the expected range bounds and encounters a Gann Square Number
- **High-Probability Zones:** Areas where multiple components show support/resistance at similar levels
- **Volatility Assessment:** Compare the expected range from the Range Calculator with the actual price movement
This indicator combines statistical, trend-following, and mathematical approaches to market analysis, providing traders with a well-rounded view of market conditions and potential price movements.
