WD Gann: Vertical Lines for Predefined Days/Bars AgoThis Pine Script draws vertical lines on the chart at specific time intervals, inspired by WD Gann’s theories of time cycles . WD Gann, a famous trader, believed that market movements were influenced by predictable time cycles. This script enables traders to visualize these key time cycles on the chart by placing vertical lines at predefined intervals (in bars ago), helping to identify potential turning points in the market.
The time intervals used in this script are inspired by Gann’s work, as well as astrological and numerological principles , which many traders believe influence market behavior . You can customize which time intervals (such as 3, 7, 9, 21, etc.) you want to track by enabling or disabling specific vertical lines on the chart.
Key Features:
Time Cycles Based on Gann’s Theory: Draws vertical lines at significant time intervals such as 3, 7, 9, 21, 27 bars ago, which are commonly used by Gann traders.
Astrological & Numerological Significance: The predefined intervals also align with key numerological and astrological values, allowing for a broader perspective on market cycles.
Customizable Intervals: You can choose which time intervals to display by enabling or disabling checkboxes for each cycle, allowing flexibility in chart analysis.
Visual Labels: Each vertical line is labeled with its corresponding "bars ago" value, providing clear reference points for the selected time cycles.
What Users Can Do:
Track and analyze market movements based on time cycles that are significant to Gann’s theory, as well as numerological and astrological influences.
Enable or disable vertical lines for specific cycles, like the 3-bar cycle, 9-bar cycle, or 365-bar cycle, depending on the intervals that align with your trading strategy.
Combine with other technical analysis tools and Gann techniques (e.g., Gann Angles, Gann Fans, or Square of Nine) for a more comprehensive trading approach.
This tool is designed for traders who believe in the power of time cycles to influence market behavior, and is especially useful for predicting turning points or key price movements based on these cycles.
Gannsq9

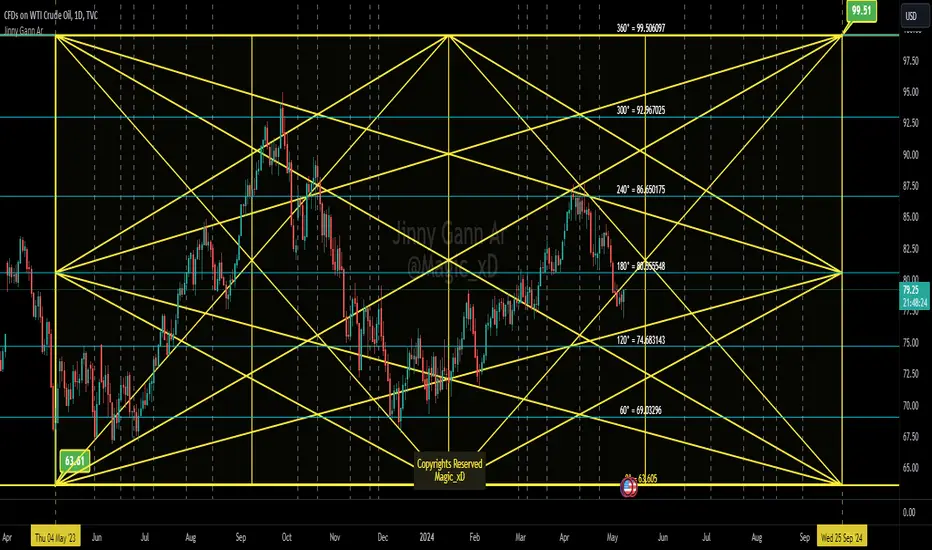
Jinny Gann ArJinny Gann AR is a comprehensive technical analysis indicator designed to empower traders with the tools to analyze market movements using Gann square of 9 theory. Developed by Magic_xD, this indicator integrates various features inspired by the legendary trader W.D. Gann's methods.
The trading techniques by WD Gann are widely seen as innovative and are still studied and used by traders today. He used angles and various geometric constructions. Gann angles divide time and price into proportionate parts and are often used to predict areas of support and resistance, key tops and bottoms and future price moves. The method is based on the notion that markets rotate from angle to angle and when an angle is broken, price moves towards the next one. Several angles together make up a Gann Fan.
- Jinny Gann AR Might accurately Shows you when and what price might be the end of the Cycle,
-Gives The important pivot points
- This Allows you to Detect Next Level of Resistance/Support And when a Possible Reversal might occur ahead so you can Catch a reversal in time.
- Its Multi Language User interface English - Arabic.
Ability to customize Every thing visually.
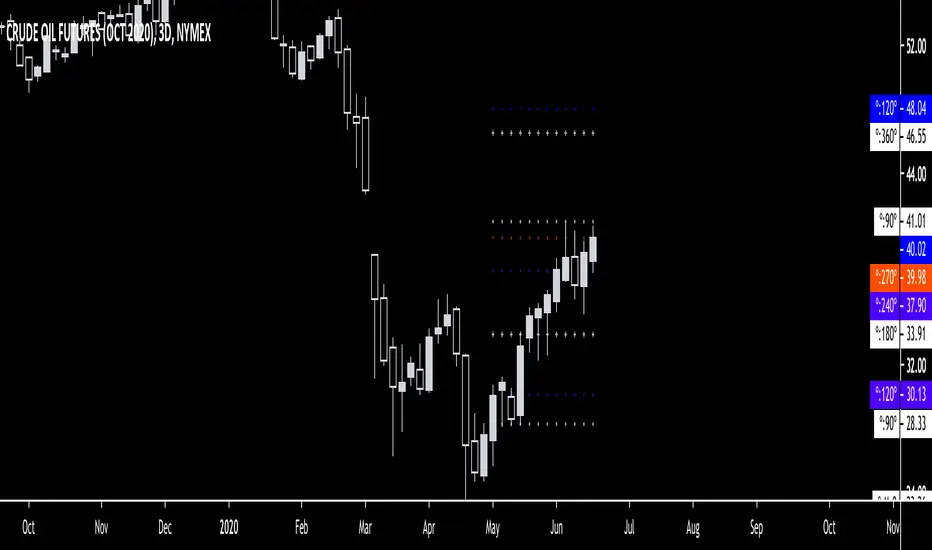
Some Features Explained on USOIL Chart :
Gann Square of 9 Levels for USOIL:
Charts Shows and Up Cycle Started 4 May 2023 From bottom of 63.61
Indicating Important Levels and Expected End of 1 Cycle at 99.5 on 25 Sep 2024
Gann Star With Levels And Time Lines :
Vertical Dashed Lines are The time lines
Jinny Gann Grid Based on Shape Type not Static 45 Angle:
Jinny Gann Grid + Levels :
Jinny Gann Fan For Up Cycle:
Jinny Gann Fan Reverse Same Cycle:
Ability To Show Both Up/Reversal Fans on The chart:
The Number of Fann Levels you need on the chart can be customized by changing Shape Type... But Price Will Respect it Pretty Well.
Key Features:
Direction Selection: Choose between "Up" or "Down" to specify the market direction you want to analyze.
Automatic Settings Adjustment: Enable this option to allow the indicator to automatically adjust settings for optimal analysis.
Original Gann Levels: Display original Gann theory levels Based on Gann Square of 9 Equations.
Auto Detect Tops/Bottoms: Determine the number of previous candles used to automatically detect Top or Bottom in the market.
Spacing Configuration: Adjust the spacing or offset between Gann levels to fine-tune your analysis.
Manual Starting Point: Manually set the starting point for your analysis.
Geometric Shape Selection: Choose from various geometric shapes including straight lines, triangles, quadrilaterals, and more...
Custom Angle Selection: Define custom angles for geometric shapes .
Time Interval Selection: Select time intervals such as 360 or 720 Etc...
Cycle Analysis: Determine the number of cycles to analyze market movements effectively.
Decimal Precision: Customize the number of decimal places displayed for accurate analysis.
Automatic Spacing (Under Development): Future feature to automatically select spacing for enhanced user experience.
Time Levels Display: Visualize time levels to gain insights into market timing.
Gann Star Display: Show Gann stars to identify critical market points.
Star Modification: Modify the appearance of Gann stars for better visualization.
Gann Grid Display: Display Gann grids to identify key support and resistance levels.
Grid Extension: Extend Gann grid lines for extended analysis.
Gann Fan Display: Show Gann fans to analyze trend lines and potential reversals.
Reverse Fan Display: Visualize Gann fans in reverse to explore alternative analysis perspectives.
Additional Fan Options: Explore more options for Gann fan analysis.
Time Line Adjustment: Move time lines to the right or left for flexible analysis.
Star Line Extension: Extend Gann star lines for deeper insights.
Fan Line Extension: Extend Gann fan lines for comprehensive trend analysis.
Customizable Colors: Customize colors for various indicators to suit your preference.
Width Adjustment: Adjust the width of trend lines for better visualization.
Label Customization: Customize colors and positions of level and price labels for clarity.
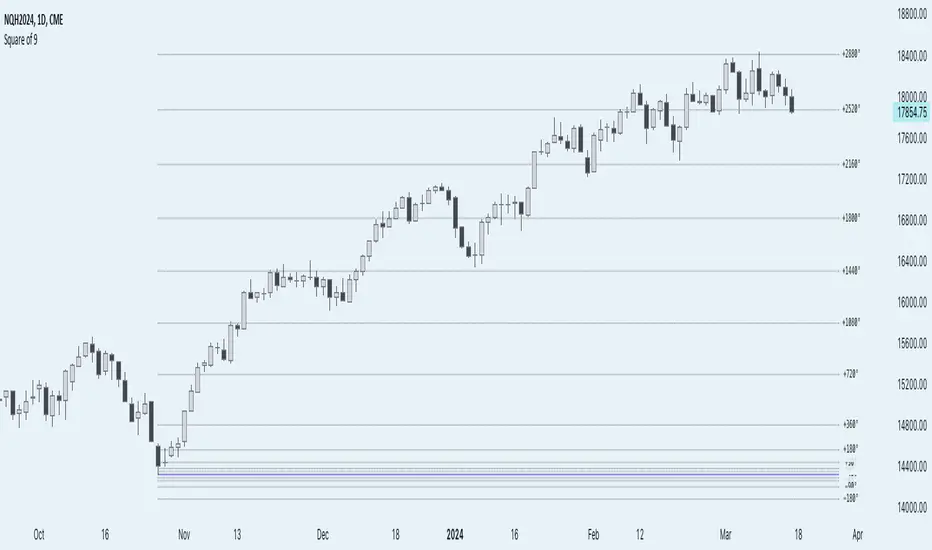
Anchored Square of 9 by AlgoCadosThe 'Anchored Square of 9 by AlgoCados' pine script indicator, leverages the non-discretionary, mathematical principles of W.D. Gann's Square of 9 for predicting vital support and resistance levels across all financial assets. Its mathematical precision and versatility make it a universally applicable tool, suitable for analysis of any financial asset without bias. Characterized by its adaptability to both high and low time frame analyses (HTF and LTF), this sophisticated indicator provides a structured, reliable method for market analysis, making it an essential asset for traders looking to apply a consistent and comprehensive approach across various market conditions and asset classes.
CME_MINI:NQH2024
Core Functionality
Anchored Price Point: The script allows users to define an anchor time and anchor point type (High, Low, Open, Close), serving as the basis for subsequent calculations. This flexibility enables precise adaptation to varying market conditions and analysis needs.
Angular Shifts and Projection: The indicator implements a range of angular shifts for LTF and HTF analyses, allowing for detailed and customizable projection of support and resistance levels. Angular shifts can range from 11.25° for finer intraday nuances up to 7200° for broader, long-term trend insights.
Mathematical Implementation
Anchor Point Selection: The script selects an anchor point based on user inputs for the anchor type and anchor time. This point serves as the basis for calculating deviations.
Angular Shift Calculation: The indicator calculates deviations by applying angular shifts to the square root of the anchor price. These deviations are used to project potential support and resistance levels.
Projection Lines and Labels: For each angular shift, the script generates projection lines and labels, which are dynamically adjusted as new data becomes available. This visual representation aids in identifying significant price levels.
CME_MINI:NQH2024
Key Features and Customization Options
Customizable Angular Shifts: Traders can enable or disable specific angular shifts to tailor the analysis to their trading strategy.
Projection Styles and Labels: Offers various styles (Solid, Dotted, Dashed) for equilibrium, upper shifts, and lower shifts lines, along with customizable label options (Levels, Prices, Levels + Prices) for enhanced clarity and information density.
Dynamic Labeling: Utilizes dynamic labeling for each projection line, indicating the angular degree and price level, facilitating a comprehensive understanding of potential market movements.
User-Friendly Inputs: Features user-defined inputs for anchor time and type, angular shifts, line styles, and labeling options, making the tool highly adaptable and intuitive.
Pine Script Technical Insight
Input Handling: The script incorporates a series of input controls to allow users to specify the anchor time, anchor type, and which angular shifts to display.
Line and Label Generation: Utilizes Pine Script's capabilities to dynamically generate and adjust projection lines and labels based on the calculated support and resistance levels.
Efficiency and Adaptability: Efficiently loops through a predefined set of angles, applying them to the anchored price point to calculate and project support and resistance levels, demonstrating the script's adaptability to both intraday and longer-term analysis.
Mathematical Formulation and Indicator Logic
Initial Setup and Inputs
The indicator starts by capturing user inputs for the anchor point—this can be a High, Low, Open, or Close price at a specified anchor time. These inputs determine the base price (P-base) from which all calculations are derived.
High if Anchor Type = "High"
Low if Anchor Type = "Low"
Open if Anchor Type = "Open"
Close if Anchor Type = "Close"
Angular Shifts and Projection Basis
The core of the "Anchored Square of 9" methodology involves calculating support and resistance levels through angular shifts applied to the Price-base (P-base).
The indicator enables a series of angular shifts, specified by the user, to project these levels dynamically.
Angular shifts are interpreted through the lens of Gann's theory, with each degree corresponding to a potential market turn or equilibrium point.
The script translates these angles into actionable projections using the square root of the anchor price, then applies the angular coefficients to find deviation points.
Angular Coefficients and Pi
In the context of the "Anchored Square of 9" indicator, angular shifts are crucial for projecting potential support and resistance levels. These shifts are quantified by angular coefficients derived from geometric principles, specifically leveraging the relationship between angles in degrees and their radian counterparts using π (Pi). Here's how angular coefficients are integrated:
Pi Reference for Angular Shifts: Given that 360° equates to 2π radians, angular coefficients (θ) for the indicator are calculated by translating degrees into a radian measure and then applying this measure to modify the square root of the base price (P-base).
Example of Angular Coefficients Shift:
A 180° shift corresponds to π radians. In the indicator's formula, this would translate to an angular coefficient of 1, since 180° = π in terms of π. Thus, applying this angular shift involves adding or subtracting 1 from the square root of P-base and then squaring the result to project a new price level.
Similarly, a 90° shift, equating to π/2, would have an angular coefficient equivalent to 0.5, reflecting its proportion of the circle (or square, in the context of Gann's geometry).
Implementation in Calculation of Deviations
Incorporating π into the formula for calculating deviations enriches the indicator's mathematical foundation, providing a direct link to geometric principles:
For each selected angular shift (θ), the script calculates positive and negative deviations from the square root of the anchor price. These deviations represent potential support and resistance levels.
P± = round (( sqrt root (P-base) ± θ)²)
Where:
P ± represents the calculated price levels for support (-) and resistance levels (+);
θ is the angular coefficient derived from the user-selected angular shifts;
sqrt root (P-base) is the square root of the base price;
round (⋅) ensures that the calculated levels are adjusted to the nearest tick size, maintaining relevance to actual trading scenarios.
Dynamic Projections and Visualization
The script generates lines and labels for these calculated levels, dynamically extending them as new market data becomes available. This feature ensures that traders have the most current and relevant information for decision-making.
For visualization:
Equilibrium Lines: Drawn at P-base to indicate the anchor or equilibrium point.
Support and Resistance Lines: Drawn at P- and P+, respectively, showing potential levels of market reaction
CME_MINI:NQH2024
Labeling and Style Customization
The indicator provides extensive customization for the appearance of projection lines and labels. Traders can select the line style, color, and text information (levels, prices, or both) to be displayed, tailoring the visual output to their preferences and trading strategy.
Implementation Details
This detailed approach to calculating support and resistance levels showcases the indicator's adherence to Gann's principles while leveraging modern computational methods to enhance trading analysis. By translating angular shifts into quantifiable projections, the "AlgoCados x Anchored Square of 9" indicator offers a powerful tool for identifying potential market movements with high precision.
The Pine Script implementation encapsulates this complex logic within a user-friendly interface, allowing traders to harness advanced analytical techniques within the TradingView platform. Through dynamic calculation and visualization, the indicator equips users with a deep understanding of market structures, enabling informed trading decisions based on mathematical projections.
Conclusion
The 'Anchored Square of 9 by AlgoCados' indicator merges mathematical precision with trading intuition, offering an advanced tool for traders seeking to leverage the time-tested principles of W.D. Gann's Square of 9. With its comprehensive set of features and customization options, it stands as a powerful addition to the TradingView platform, designed to enhance market analysis and decision-making for traders at all levels.
Embrace the essence of smarter trading where every insight is "Healthy For Your Trading."
PRESTANA SQ9PRESTANA SQ9 - Advanced Analysis with Revised Square of 9 and Custom Gann Scale
Description:
PRST SQ9 is an innovative technical analysis tool that revolutionizes the use of the Square of 9 by integrating it with a custom Gann scale and the application of solar degrees. This unique script stands out for its ability to generate more precise levels of analysis compared to traditional market indicators.
Key Features:
Customizable Price Scale (Price Unit): By adjusting the 'price unit' and 'factor', our script allows for extremely precise levels of analysis. This approach provides greater flexibility and adaptability to various market conditions.
Application of Solar Degrees: A distinct feature of our script is the use of solar degrees, offering an alternative perspective to the traditional Square of 9 scale. This allows for a broader range of analysis and the identification of key market turning points.
Customizable Configuration: Users can set the desired time frame (TF) and adjust the 'price unit' and 'factor' to suit their specific needs. For instance, settings like 1, 4, 16, 64, 256, or 2, 8, 32, 128 can be used to calibrate the indicator.
Usage Guide:
Setting the Time Frame and Price Unit: Select the TF you wish to analyze and set the 'price unit' to values like 1 or 2, and their multiples (e.g., 4, 16, 64, 256 for 'price unit' 1).
Adjusting the Factor: Modify the 'factor' to correspond to the degrees you want to explore on the Square of 9. For example, a 'factor' of 1 corresponds to 180°, 2 to 360°, 0.5 to 90°, etc.
Time Analysis: For time analysis, set the degrees for the cycle you wish to observe and the reference TF.
Uniqueness and Added Value:
PRST SQ9 stands out for its ability to merge the Square of 9 with a dynamic price scale and the application of solar degrees, offering users a richer and more varied technical analysis. This unique approach provides traders with a powerful tool to navigate the markets with greater precision and confidence.

Gann Spiral / Square of 9The Gann Spiral, more commonly known as the Square of 9 is one of the most well known tools that Gann used. Today, it is most commonly used to find possible support and resistance levels, and possible reversals in time.
This indicator is a more flexible version of the traditional Gann Spiral / Square. This is achieved by allowing you to change:
Price and Time direction
The timeframe
How often to draw lines based on degrees
Toggles for Price and Time
Price and Time line customization
How to use:
1 - Select your desired starting value of Price and Time.
2 - Choose the direction of Price and Time.
3 - Choose the amount of lines to display.
4 - Choose how often for lines to be drawn (Rotation Degree Value).
==================================================================
Side Note:
This uses a more proper and more accurate formula to "navigate the square". (Sqr x + 2)^2 is not the formula used, but rather (Sqr x + 1)^2.
If you wish to use the formula you're used to, change Full Revolution Value to 180.
The reasoning behind this formula change is because I re-created the square in the form of an actual spiral. The issue with such a conversion is that the formula used to construct it uses one Pi. If you understand circles, you should know that we're off by 180 degrees. A full rotation is 360, not 180.
Correcting for this error requires a slight but important change in the formula, that being +1 instead of +2. This not only corrects it to fit for a proper spiral, but also makes it easier to use fractions. 1/360 results in 1 degree. This slight formula change makes it incompatible when used on the actual Square of 9, however it is technically the more accurate formula.

Gann Square This indicator build by Gann Square of 19.
you select start and end of big trend in daily timeframe and calculate date range.
by draw trend line in Gann square and enter the numbers cross by line in settings input you could recognize future pivot points
remember : first) this tool worked only in daily timeframe. second) better using this in dark theme :)
chart example :
Magic levelsIt is by far the simplest on chart presentation of Gann square of 9. It calculates the levels based on previous day closing. These levels usually acts as support and resistance.

Gann ToolsThis is basically an updated version of my scripts with additional features, all in one instead of 3 separated scripts,
The script includes the following but not limited to:
1- Price Angles (Angles of Square of 9) with the ability to add extra primary angles or whole cycles, and the customization of every line color and style and more
2- Gann Star with the customization of every line color and style and more
3- Gann Grid with the customization of every line color and style and more
4- Gann Fan/s, that can be drawn from the all 4 directions/points, with the customization of every line color and style and more
5- Gann Square (Sq of 52/90/144) with the ability to extend boxes in all directions, and of course with the customization of every line color and style
The only reason that made me create 3 separated scripts, is that there was a limit of 55 line per script, and I had to draw a lot of lines, specially in the Grid, now that limit is 500 (crazy right?).
You can now select the starting point with a click instead of having to type the price by yourself, input whatever color you want for every single line that will be drawn on your screen.
I hope everyone enjoys using my indicator/s to plot their creativity on the chart.

Gann Square of 9Gann's Square's are some of the best known tools created by Gann. His most well known square was his Square of 9.
The reason for this was because of the symmetry 9 had with itself. Gann was able to balance both price and time with this symmetry.
- 9 is the last single-digit and largest number
- You can add anything to 9 and it will give you a natural number
- (9 + 3 = 12); 1 + 2 = 3... (9 + 9 = 18); 1 + 8 = 9... etc.
- Multiplying any number by 9 will have the natural number be 9
- (9 * 6 = 54); 5 + 4 = 9... (9 * 3 = 27); 2 + 7 = 9... etc.
For these reason, Gann claimed that 9 has everything within itself.
Here I have created an on-chart square of 9 including the cardinal and ordinal cross points colored. In the settings you are able to customize the starting value of the table as well as the period movement. In most cases, 81 is not high enough to be useful in charting cases, so I'd recommend printing out your own Gann Square of 9 that goes as high as you need it to go.
THIS IS NOT TRADING ADVICE ; please use your own technical analysis before making any decisions based off of public indicators. Learn more about Gann's Squares before attempting to use them as this script was not meant to give you answers, only the table.
Gann Square 9 Table Concept Alternate UIThis indicator was intended as educational purpose only for Gann Square 4, specifically to show Cross Cardinal.
This indicator was build upon The Tunnel Thru The Air Or Looking Back From 1940, written by WD Gann .
This build was improved by grouping similar values after selected to save time.
User Interface also was improved.
Indikator ini bertujuan sebagai pendidikan sahaja untuk Gann Square 4, khusus untuk menunjukkan Cross Cardinal.
Indikator ini dibina berdasarkan buku The Tunnel Thru The Air Or Looking Back From 1940, ditulis oleh WD Gann .
Binaan ini telah ditambah baik engan mengumpulkan nilai yang sama setelah dipilih untuk menjimatkan masa.
User Interface juga telah ditambah baik.
Indicator features :
1. Font size from tiny to huge.
2. For desktop display only, not for mobile.
3. All values can be selected by group.
Kemampuan indikator :
1. Saiz font dari paling kecil ke paling besar.
2. Untuk paparan desktop sahaja, bukan untuk mobile.
3. Semua nilai boleh dipilih secara berkumpulan.
FAQ
1. Credits / Kredit
WD Gann , The Tunnel Thru The Air Or Looking Back From 1940
Ganzilla
2. Page involved / Muka Surat terlibat
195 - 198
3. Code Usage / Penggunaan Kod
Free to use for personal usage.
Bebas untuk kegunaan peribadi.
4. Previous build / Binaan sebelum ini
Gann Square 9 Cross Cardinal Table Concept
5. Related build / Binaan berkaitan
Gann Square 4 Cross Cardinal Table Concept
Gann Square 4 Table Concept Alternate UI
Left : Even array number / Kiri : Array nombor genap
Right : Odd array number / Kanan : Array nombor ganjil
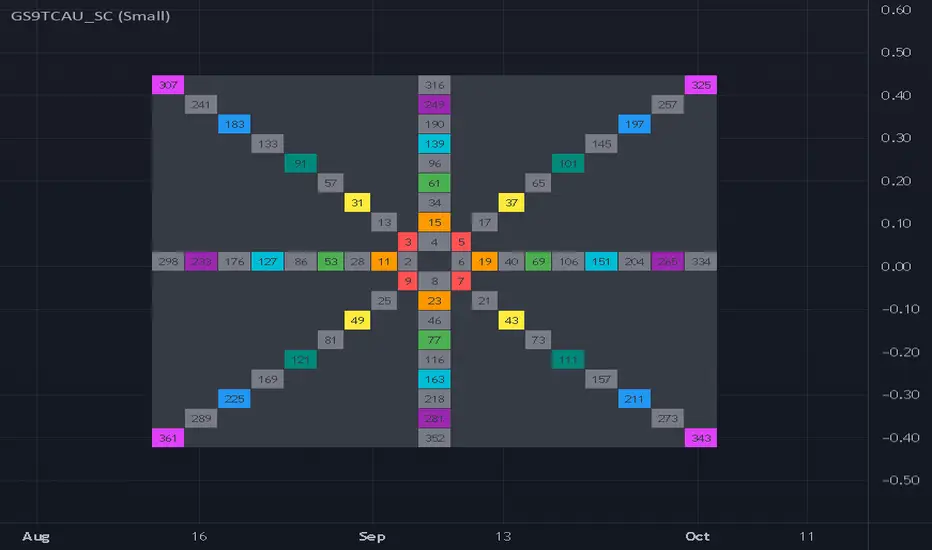
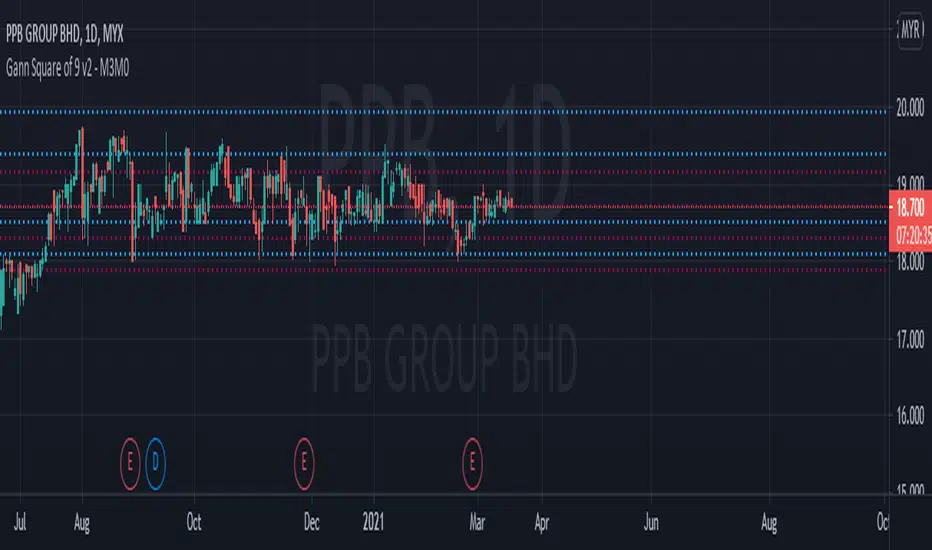
Gann Square of 9 v2- M3M0The Square of nine or Gann Square or Master Chart is also known as the square root calculator and finds its basis in Gann's methods which is squaring price and time. The square of 9 is a spiral of numbers with the initial value "1" starting at the centre. Starting from this central value, the number is increased as we move in a spiral form and a clockwise direction. According to some experts, each cell in Gann’s square of nine represents a point of vibration.
This indicator will automatically plot the Gann Level based on the Gann Square of 9 table.
How to trade with Gann Square of 9.
This indicator will automatically plot 4 lines above the current price and 4 lines below the current price, which is based on Gann Square of 9 table.
If the lines above the current price, it will be as resistance. If the lines below the current price, it will be as support.
The blue line is the strong level from Gann Square of 9 table while the red line is the very strong level from Gann Square of 9 table.
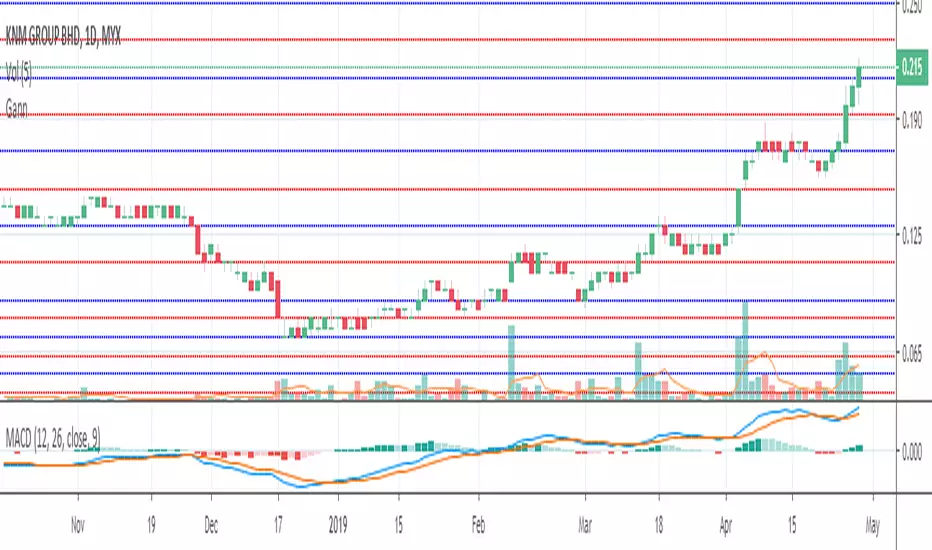
gannsquareof9chart2This Indicator works on W.D.Gann Square of 9 chart
gann works on SQUARES: ODD and EVEN
HIGH and LOW of this chart will be the " SQUARES "
this chart provides 7 major and 8 minor levels in between the ODD or EVEN Squares .
major levels are colored in blue and white respectively.
minor levels are colored in olive .
better visibility in dark background
change the color of the levels according to your requirement.
Once the HIGH or LOW (or SQUARES) breaks The next ODD or EVEN SQUARES open up ,
As the breakout of Squares happens the chart expands and acquire the new HIGH or LOW.
I have given Three different resolution option user can switch between:
DAILY ; WEEKLY ; MONTHLY .
thankyou

Gann Square of 9Red = Very Strong Support & Resistance
Blue = Strong Support & Resistance
Gann chart price is from 0 - 0.69
Price level exactly followed Gann arrangement.
Gann Square of 9 Pivots By Dr. PWho loves Gann Square of 9? Lots of people.
Who likes calculating square of 9 and then manually putting lines on the chart? No one.
Here's a nifty little add-in that you can have draw your Gann Square of 9 pivot lines with just a little bit of configuration based on what is being traded.
Adjust the modifier value to match the price range being traded. I recommend 1 for prices 1-999, 10 for prices above 1000 (like BTC or AMZN), and .001 for Forex.
The base price from which the levels are calculated can be the high, low, hl2, etc. from the Month, Week, Day, Hour previous.
Adjust the rotation to move the levels up or down 360 degrees if the previous period's price was too high or low to put the levels on the current price.
Have fun with it, play with the settings, drop a like, or shoot me a comment for improvements/problems/questions.
Cheers!
Dr. P

Gann Square Of 9 LevelsThis script uses the last hlc3 value of 1H, 4H, D and/or W and rotates it 360º up/down with four increments of 90º to find out potential support and resistance areas. Can be used as a dynamic support & resistance tool or just to gauge how overbought/oversold the market is. Special thanks to @Nv56 for his assistance in writing this script.
kosta script zidan groupit is just draw gann sq9 with other way you can define the low point and high point and it will draw the rest
i am only giving this to the first group and i am still working on it to make it better and i hope i can draw the chart as expected and learned
المجموعه الاولي لذيدان

SQ9+ : A Index Trading System(Intraday) By TruStoxHi Fellow Traders,
Around 6 months back I launched Excel based SQ9 Index Trading System(Intraday) here , With the feedback from our users the SQ9 System is updated to Tradingview for ease of charting, efficient trailing & some more fantastic features that no normal trader can have .
Please Note: SQ9+ is a full fledged trading system with defined rules to entry , exits & risk to reward management ( Check Reviews )
To know more & register for SQ9 : Click Here!
I hope this simply advanced trading system assists you in trading.
Do Visit Us @ TruStox
Enjoy & Happy Trading
#A Happy Note : SQ9+ for scripts will be launched soon..
