Dark Pool Pulse – LiteDark Pool Pulse Lite
This indicator provides an observational proxy for dealer gamma exposure using only price and volume data. It helps users visualize whether market makers may be leaning long gamma (potential stabilizing flows) or short gamma (potential destabilizing flows). For educational and informational purposes only.
Key Features
0–100 oscillator representing an estimated dealer-gamma proxy.
Bullish zone (above 60): dealers may be long gamma → potentially absorbing volatility.
Bearish zone (below 40): dealers may be short gamma → potentially amplifying volatility.
Background tint for quick visual context.
Optional summary table showing current value and interpretation.
Alert conditions for crosses of the 60 and 40 thresholds.
How It Works
The indicator measures volume-weighted directional pressure and normalizes it over a rolling lookback window. The value is smoothed and mapped into a 0–100 oscillator:
Above 60 → potential positive gamma conditions.
Below 40 → potential negative gamma conditions.
40–60 → neutral or balanced zone.
All calculations are performed internally using only price and volume.
Settings
Lookback Length (default 20): Number of bars used for normalization.
Smoothing Length (default 10): EMA smoothing applied to the proxy.
Show Summary Table: Toggles the optional value/interpretation panel.
How to Use
Add the indicator to any chart or timeframe.
Observe the oscillator levels:
A move above 60 may reflect a more stabilizing dealer environment.
A move below 40 may reflect a more destabilizing environment.
Use the background tint for quick contextual bias.
Enable alerts for threshold crossings if desired.
Adjust settings to match your preferred responsiveness.
Notes
For educational and informational purposes only.
Not financial, trading, or investment advice.
No signals or recommendations are provided.
Source code protected to maintain proprietary calculation methods.
GEX

GexView📈 OVERVIEW
GexView indicator plots the Historical Gamma Exposure (GEX) profile, directly on the chart. It enables traders and analysts to observe how GEX profile evolve across multiple days/sessions.
🧲 CONCEPT
Today everybody uses Gamma Exposure. Gamma is the ROC (Rate of Change) for an option’s delta. GEX is crucial for all traders, not just intraday traders, because it helps assess market stability and potential volatility shifts driven by options positioning.
High positive GEX generally implies a mean-reverting market, where big price swings are dampened, while negative GEX signals increased volatility and potential large moves.
Understanding GEX allows traders to anticipate liquidity-driven price action, identify key support and resistance levels, and adjust strategies accordingly. In today’s market, where options flow heavily influences underlying assets, ignoring GEX can mean missing critical market dynamics that impact both short-term and long-term positions.
💡 UNIQUENESS
This indicator is a unique tool and offers a groundbreaking way to visualize market dynamics by plotting Historical Gamma Exposure (GEX), like a Volume Profile across multiple days or sessions. For the first time, traders can clearly see how GEX levels evolve over time, revealing how certain price zones gain or lose importance as market conditions change. This multi-session GEX profile allows users to identify persistent areas of dealer positioning and potential support or resistance that develop and shift over days. Unlike traditional GEX tools designed primarily for intraday use, this indicator provides valuable insight for both short-term traders and medium-term investors seeking to understand how option market flows influence price behaviour over extended periods.
⚙️ FEATURES
• Historical Gamma Exposure
The GexView indicator by default plots the last 6 days of the GEX profile, providing a framework for understanding the bigger picture.
• GEX profile
Displays the 10 largest GEX levels across all expirations (thick lines), as well as the 10 largest GEX levels for the next expiration (thin lines, 0DTE or upcoming).
• Update
Daily, after market close, based on new open interest. No more manual level imports.
Just one-click update.
• Settings
Option to plot total sum GEX for all expirations, or only net GEX for next expiration.
• Watchlist
SPX, NDX, DIA, SPY, QQQ, VIX, VXX, IBIT
(Additional tickers coming soon)
• Mapping
The indicator automatically detects and maps the underlying ticker on your chart, or lets you plot any symbol from the available watchlist.
🔍 HOW TO USE
• Identify intraday support and resistance levels shaped by option market dynamics
• Quickly spot significant GEX levels and compare how they relate to other key levels.
• Compare current vs. past GEX distributions for contextual trend analysis
• Observe structural GEX shifts that may align with volatility or mean-reversion setups
• Easily understanding if an asset trading on positive gamma (around green lines), or negative gamma (around red lines)
Examples:
1. DIA ETF
2. QQQ and VIX
📚 NOTES
• Calculation
GEX for All Expirations: This is the total sum (Call+Put) of gamma exposure of all expirations.
GEX for Nearest Expirations: This is the net sum (Call-Put) of gamma exposure of next expirations (0DTE if available).
• Trading Session - RTH & ETH
The indicator can include the extended trading hours when activated on the chart.
✅ VISUALIZATION
• Vertical implementation of gamma exposure profile.
• Thick lines represent the total gamma exposure across all expiration contracts.
• Thin lines represent the gamma exposure of next expiration only.
• All Expirations: Green colour if Calls > Puts, Red colour if Calls < Puts
• Next Expiration: Lime colour if Calls > Puts, Maroon colour if Calls < Puts
⚠️ DISCLAIMER
This indicator is provided for informational and educational purposes only.
It does not constitute financial advice or a recommendation to buy or sell any financial instrument.
Historical Gamma patterns and analytical interpretations do not guarantee future performance.
All analysis should be combined with independent research and risk management.

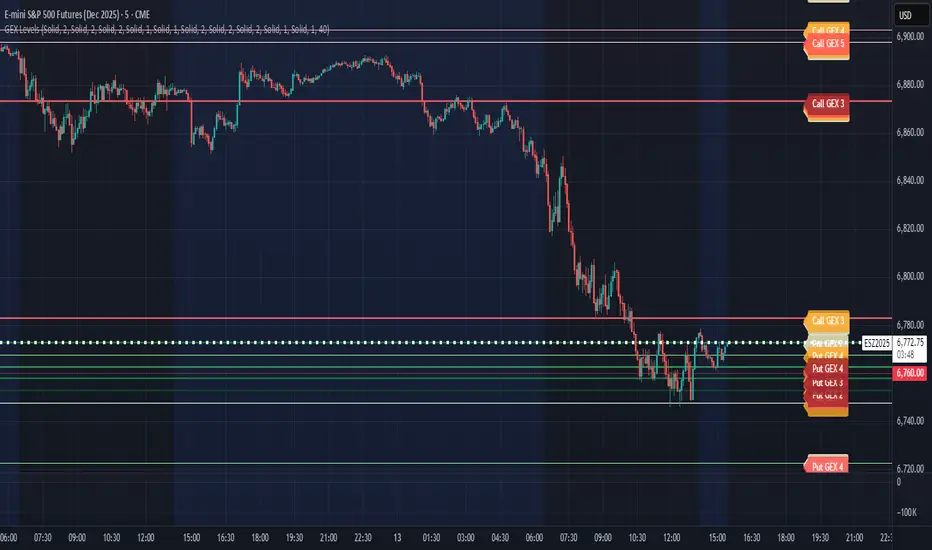
SPX-to-ES Gamma Levels (20 GEX Levels)Draws GEX levels specified by user on ES futures chart.
User inputs SPX-to-ES offset, SPX price level, and length of box

GEX Crypto LevelsGEX Crypto Levels - Professional Options Flow Visualization
This indicator displays real-time Gamma Exposure (GEX) levels and key options metrics for major cryptocurrencies directly on your TradingView charts.
What This Indicator Shows:
Call Wall: The strongest resistance level where call option gamma is concentrated (red solid line)
Put Wall: The strongest support level where put option gamma is concentrated (teal solid line)
HVL (High Volume Level): The price level with highest options trading activity (orange solid line)
GEX Strike Levels: Additional significant gamma exposure levels displayed as dashed red lines
Supported Cryptocurrencies:
The indicator automatically detects your chart symbol and displays the corresponding levels for:
BINANCE:BTCUSDT (Bitcoin)
BINANCE:ETHUSDT (Ethereum)
BINANCE:SOLUSDT (Solana)
BINANCE:XRPUSDT (Ripple)
BINANCE:BNBUSDT (Binance Coin)
BINANCE:DOGEUSDT (Dogecoin)
A fallback input is available for other symbols.
How It Works:
This indicator requires data from an external GEX data provider. To use it:
Visit our GEX provider's dashboard website (see the Invite-Only description)
Locate the "TV Export" or "TradingView Export" button for your desired cryptocurrency
Copy the export string to your clipboard
Paste it into the corresponding input field in the indicator settings
The indicator automatically parses and visualizes all levels on your chart
The data format is standardized and contains Call Wall, Put Wall, HVL, and strike-level information in a single copy-paste string.
Customization Options:
Adjustable line widths for GEX levels
Customizable label positioning (offset from current price action)
Separate offset controls for wall labels and GEX strike labels
Trading Application:
Gamma exposure levels often act as magnetic price zones where:
Call walls typically represent resistance where price may stall or reverse
Put walls typically represent support where price may find buyers
HVL shows where the market has the most positional interest
Multiple GEX strikes indicate areas of potential volatility compression or expansion
Important Notes:
This indicator requires external data input and does not fetch data automatically
Data must be updated manually by copying new export strings from your provider's website
The indicator is designed for overlay mode on price charts
Visual Design:
Clean styling with color-coded levels
Right-aligned labels that stay visible as price action develops
Dashed lines for GEX strikes to differentiate from wall levels
Extended lines that project across the entire chart
This tool is ideal for options-aware traders who want to incorporate institutional gamma positioning into their cryptocurrency trading strategy.
Access Information:
This is an invite-only indicator. Access is restricted and granted selectively. If you are interested in using this indicator please see the Invite-Only description.

GEX / Gamma - SPX Indicator Description – GEX / Gamma (SPX)
This indicator allows you to manually plot your daily +GEX, TRANS-GEX, and –GEX levels on SPX and visualize how price reacts around key gamma zones.
You enter the three levels each morning, and the script automatically draws:
+GEX / TRANS / –GEX zones with an adjustable buffer
Clean labels (e.g., “+GEX: 6850”) pinned to the right side of the chart
Today-only candle coloring (green above TRANS-GEX, red below)
Zones extend from yesterday’s session through the current session, helping highlight areas where dealer hedging flows may influence volatility, compression, or acceleration.
How to Use
Add the indicator to any intraday SPX chart.
Open settings and enter your +GEX, TRANS-GEX, and –GEX levels for the day.
Adjust the buffer, colors, and label style as needed.
Watch how price behaves as it moves above or below TRANS-GEX and interacts with +/- GEX zones.
Best For
Intraday SPX / ES / SPY
Options traders
Volatility and gamma-aware strategies
Strategy Behind It (Tight Version)
GEX levels help identify where dealer hedging flows can influence SPX price behavior.
+GEX (Positive Gamma)
Market tends to stabilize here. Dealers hedge against price moves, creating mean-reversion and lower volatility.
TRANS-GEX (Transition Level)
Key pivot where gamma flips. Price crossing this level often signals a shift in volatility or intraday direction.
–GEX (Negative Gamma)
Market becomes more reactive. Dealers hedge with price, increasing volatility, momentum, and trend potential.
How traders use it:
Expect resistance or slowdown into +GEX
Watch for potential bottoming or increased volatility –GEX
Use TRANS-GEX as a bias line or trigger for intraday shifts
A move outside of either the +GEX or -GEX will likely result in some type of high volume move.

Gamma Exposure Levels by OMG (Oh My Gamma)OMG (Oh My Gamma) - Daily GEX Levels
An operational framework for Gamma analysis with daily data.
Indicator's Purpose & Demo Data
This indicator plots key strategic levels derived from Gamma Exposure (GEX) analysis. It showcases the operational logic of OhMyGamma analytical engine.
IMPORTANT: The levels plotted by this public script are based on a past date's snapshot for demonstration purposes. They are not valid for live trading and will not update automatically.
The real edge comes from using the fresh data structure provided daily.
How to Read the Levels
This indicator is designed to provide actionable intelligence, not just data. Here's how to read it:
The Levels: Each line represents a key strategic zone (Zero Gamma, Call/Put Walls, etc.) where a market reaction is statistically probable due to dealer hedging flows.
Line Thickness = Strategic Importance: The thickness of each line directly corresponds to its strategic rating. Thicker, solid lines represent higher-conviction zones.
Labels & Tooltips: Hover over a level's label on your chart to see its full description, confluences, and strategic rating.
Pro Tip: The Power of Confluence
This indicator is not a standalone "system". It's an institutional-grade intelligence layer. Its predictive power increases exponentially when used to find confluence with your own analysis.
The highest-probability trades occur when a key Gamma level aligns with:
Price Action: Key support/resistance zones, order blocks, or liquidity pools.
Volumetric Indicators: High/Low Volume Nodes (HVN/LVN) from Volume Profile, VWAP, and Anchored VWAP.
Use these levels to confirm your setups and gain the conviction to act.
How to Get the Daily Updated Script
This indicator requires a new Pine Script code each day to load the current session's data.
To get the daily updated code feel free to visit www.ohmygamma.com
Feedback & Suggestions
This tool is built for the community. Suggestions for improvements and new features are highly welcome and help the project evolve. Feel free to get in touch via the contact form on the website.
Disclaimer: This tool is for informational and educational purposes only. Trading involves significant risk. The authors assume no responsibility for any trading decisions.

CB Charts - GEX MESZ2025/ESZ2025Last Updated: 09/22/2025 6:41 a.m. PST
*DISCLAIMER: Only intended for ESZ2025/MESZ2025 charts.
This indicator plots horizontal levels based on batched GEX levels for ESZ2025/MESZ2025. The batched data is derived from contracts expiring: 0DTE, 1DTE, EoW, EoM, Next Week, Next Month and 3-months out. Labels are available for a high-level view of which levels are which. Hovering (or long-pressing on mobile TV) over the labels will display the nominal values and Rank. This script is manually updated and may not be always updated.
When and what to use:
- Most respected levels come from 1DTE, EoW and EoM.
- 0DTE is included for when this script becomes intraday updated. (CURRENTLY NOT UPDATED INTRADAY)
- Next Week setting is best used only for Friday and Sunday trading
- Next Month setting is best for weeks close to the end of the current month
Powered by the Camels of Wallstreet
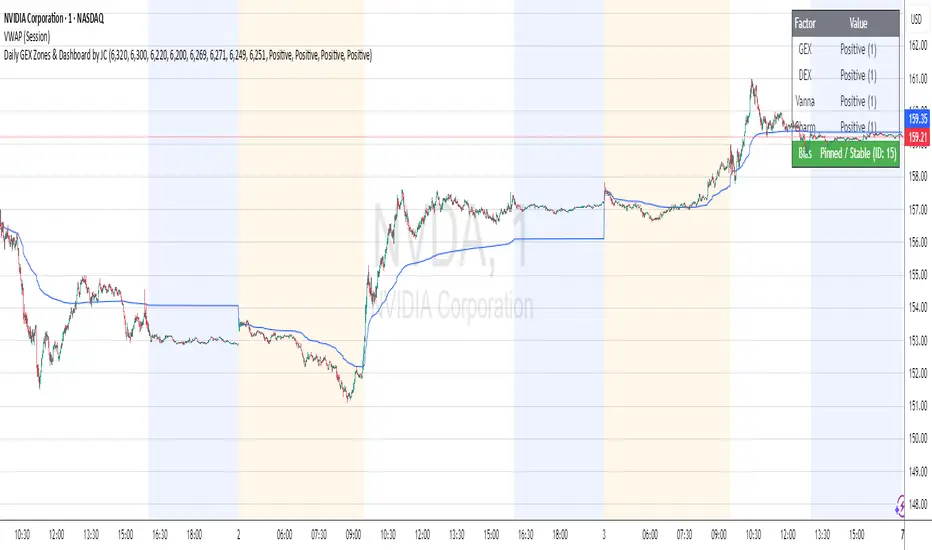
Daily GEX Zones & Dashboard by JCThis script plots daily options-driven gamma zones alongside a live sentiment dashboard to help traders visualize dealer positioning, support/resistance clusters, and expected price behavior.
Features:
📅 Date-based GEX Zones: Automatically draws GEX Resistance, GEX Support, Max Pain Zone, and Zero Gamma Line for a specific trading day.
📊 Gamma Flow Dashboard: Displays real-time GEX, DEX, Vanna, and Charm flows using intuitive dropdowns (Negative, Neutral, Positive) — no manual number typing.
🔢 Combo ID Calculation: Combines your gamma flow selections into a single Combo ID, quantifying net positioning pressure.
🎯 Automatic Bias Classification: Instantly highlights whether the day’s gamma structure is likely Pinned/Stable, Unpinned/Wild, Choppy, or Trap/Expansion — color-coded for quick reading.
📈 Zero Gamma Lines: Plots two critical levels where gamma flips from long to short, providing valuable confluence for intraday support/resistance.
How to Use:
1️⃣ Pick your target date (e.g., current day) to activate the GEX boxes.
2️⃣ Enter the day’s Resistance Wall, Support Wall, Max Pain, and Zero Gamma levels from your option chain analysis.
3️⃣ Use the radio-style dropdowns to select sentiment for GEX, DEX, Vanna, and Charm based on your interpretation of open interest, hedging, dealer flow, and market structure.
4️⃣ The dashboard will auto-calculate your Combo ID and bias class.
Designed for:
SPX, SPY, QQQ, NVDA, or any high-liquidity underlying with active options flow.
Active day traders, gamma scalpers, and market makers tracking dealer positioning.
Tip:
Combine with price action levels, VWAP, and intraday structure for high probability trade zones.
GEX Profile [PRO] Real Auto-Updated Gamma Exposure Levels𝗥𝗲𝗮𝗹 𝗚𝗘𝗫 𝗟𝗲𝘃𝗲𝗹𝘀 𝘄𝗶𝘁𝗵 𝗦𝗲𝗮𝗺𝗹𝗲𝘀𝘀 𝗔𝘂𝘁𝗼-𝗨𝗽𝗱𝗮𝘁𝗲𝘀 𝗳𝗼𝗿 𝗼𝘃𝗲𝗿 𝟭𝟲𝟱+ 𝗼𝗳 𝘁𝗵𝗲 𝗠𝗼𝘀𝘁 𝗟𝗶𝗾𝘂𝗶𝗱 𝗨.𝗦. 𝗠𝗮𝗿𝗸𝗲𝘁 𝗦𝘆𝗺𝗯𝗼𝗹𝘀 (including 𝟬𝗗𝗧𝗘 𝗳𝗼𝗿 𝗦𝗣𝗫, SPY, QQQ, TLT, IWM, etc...)
🔃 Dynamic Updates : Receive precise GEX levels with auto-updating metrics up to 5 times a day throughout the trading session—no manual refresh needed!
🍒 Strategically Developed : Built by experienced options traders to meet the needs of serious options market participants.
🕒 0DTE? No Problem! : Designed with 0DTE traders in mind, our indicator keeps you updated with GEX levels and seamless auto-refresh to capture every crucial market shift.
📈 Optimized for Option Traders : See accurate GEX and NETGEX profiles for multiple expirations to maximize strategic potential.
🔶 Comprehensive GEX Levels
This indicator provides unparalleled insight into market dynamics with levels like Call/Put Support, Resistance, HVL (High Volatility Level), and Call/Put Walls. These levels are auto-updated based on live market movements and reflect gamma shifts and volatility signals essential for options traders.
🔶 Ideal for 0DTE and Multi-Leg Strategies
Track essential GEX levels across expirations with our unique Cumulative (⅀) and Selected Alone (⊙) calculation models. Customize your view to reveal high-impact levels across multiple expirations or focus on a specific expiration for a targeted strategy.
🔶 Coverage of 165+ Highly Liquid U.S. Symbols
Compatible with over 165 U.S. market symbols, including SP:SPX , AMEX:SPY , NASDAQ:QQQ , NASDAQ:TLT , AMEX:GLD , NASDAQ:NVDA , and more. The watchlist is expanding continuously to meet the needs of active traders. List of Compatible Symbols Available Here: www.tradingview.com
🔶How does the indicator work and why is it unique?
This is not just another GEX indicator. It incorporates 15min delayed option chain data from ORATS as data provider, processes and refines the delayed data package using pineseed, and sends it to TradingView, visualizing the key GEX levels using specific formulas (see detailed below). This method of incorporating options data into a visualization framework is unique and entirely innovative on TradingView.
Unlike other providers that only set GEX levels at market open, this indicator adjusts dynamically throughout the day, providing updated insights across the trading day and capturing gamma shifts as the market moves.
_________________________________
-----------------------------------------------
🌑 𝗗 𝗢 𝗖 𝗨 𝗠 𝗘 𝗡 𝗧 𝗔 𝗧 𝗜 𝗢 𝗡 🌑
-----------------------------------------------
_________________________________
🔶 Understanding GEX (Gamma Exposure) and Gamma Profiling
Gamma Exposure (GEX) is a crucial concept in options trading because it reveals how options market positions can influence the dynamics of asset prices. In essence, GEX measures the collective gamma exposure of options market participants, impacting overall market stability and price movements.
🔹 What is GEX?
At its core, GEX captures the aggregate impact of gamma, a key options Greek, which tells us how an option's delta changes in response to price movements in the underlying asset. Positive or negative GEX levels can reflect the collective bullish or bearish stance of the market:
Positive GEX (far above HVL) : Indicates a net bullish positioning by options holders. When GEX is strongly positive, it suggests that as the asset price increases, market participants might need to buy more of the asset to maintain their hedges. This behavior can fuel further upward momentum.
Negative GEX (far below HVL) : Implies a net bearish positioning. In a strongly negative GEX environment, declines in the asset's price might prompt participants to sell, potentially exacerbating the downward movement.
🔹 The Influence of GEX on Strike Prices and Expiration
A unique feature of GEX is its impact near expiration dates. As options approach expiration, GEX levels can “pin” the price to specific strike levels, where options positions are concentrated. This pinning effect arises as market makers adjust their hedging strategies, often causing the asset price to gravitate towards certain strike prices, where a large volume of options contracts sits.
🟨 Overview of our GEX Calculation Models for Options Traders 🟨
Our GEX indicator models were developed with serious options traders in mind, providing flexibility beyond typical GEX providers. We know that using GEX levels for multi-leg strategies, where the underlying doesn't need a strong trend to be profitable , calls for a nuanced approach that aligns with different trading horizons. Here’s a detailed breakdown of our GEX calculation models and how they support strategic trading across varying timeframes.
Thus, the HVL an orher CALL/PUT WALLS depends on the indicator's selected calculation mode and expiration. The NETGEX profile of the chosen expiration appears on the HVL line , which automatically updates five times during trading hours , except for 0DTE, which reflects the value set at market open.
🔶 Cumulative Expiration (⅀) Calculation Method
This method aggregates GEX data for all expirations up to the selected date , giving you a more comprehensive view of market dynamics. We recommend using this method, as it allows you to see how combined expirations impact GEX levels, which can be critical when setting up trades with a longer time horizon.
🔶 Selected Alone (⊙) Calculation Method
This option displays the GEX profile specific to only the chosen expiration , providing a unique, time-bound view. This approach is ideal for those seeking precise insight into how an individual expiration is performing without the broader context of other expirations.
🔶 Example of using calculation methods:
With options trading, especially for multi-leg strategies, choosing the right expiration and calculation model is crucial. Let’s break down an example:
Suppose you’re considering a Friday (4DTE) front-leg diagonal on the SPX at the start of the week. In this case, the focus isn’t strictly on any single expiration (like 0DTE or 4DTE individually), but rather on what might happen cumulatively by Friday across all expirations . Here, the Cumulative Expiration (⅀) model comes into play, as it shows you an aggregated view of the GEX profile, factoring in all strikes and legs for all expirations leading up to the selected date.
For most use cases, we recommend setting your indicator to the Cumulative (⅀) model , which provides a broad and insightful look at GEX levels across multiple expirations. However, you can always switch to Selected Alone (⊙) for targeted analysis of an individual expiration. Remember, 0DTE defaults to “Selected Alone”, and Every Expiry always shows a cumulative value by default.
_________________________________
-----------------------------------------------
🟦 HVL (High Volatility Level) 🟦
Also known as the Gamma FLIP level or Zero Gamma , it represents the price level at which the gamma environment transitions from positive to negative or vice versa. The High Volatility Level (HVL) is a critical point for understanding gamma shifts and anticipating volatility. This shift influences how market makers hedge their positions, potentially increasing or dampening market volatility.
🔷 Understanding the Gamma Flip and HVL
At its core, the gamma flip represents the point where market makers may transition from a net positive to a net negative gamma position, or the reverse. When prices move above HVL, gamma is positive, often leading to lower volatility due to the stabilizing effects of market makers’ hedging. Conversely, when prices drop below HVL, gamma flips negative, and hedging by market makers can amplify volatility as they trade with the direction of price movements.
The HVL (High Volatility Level) is particularly important as it signals a shift in the impact of price movements on the GEX profile. Using the cumulative calculation mode, GEX values are aggregated across all strikes and expirations up to the selected expiration, helping to pinpoint the point where the GEX curve's slope changes from negative to positive.
🔷 Implications for Traders and Market Makers
For market makers, crossing below HVL into a negative gamma zone means that they hedge in the same direction as price movements, potentially amplifying volatility. For traders, understanding HVL's role is essential to choosing strategies that align with the prevailing volatility regime:
Positive GEX 🟢:
Above HVL, where GEX is positive, market makers hedge by buying stocks as prices fall and selling as prices rise. This has a stabilizing effect, creating a lower-volatility environment.
Negative GEX 🔴:
Below HVL, where GEX is negative, market makers' hedging aligns with price movements, increasing volatility. Here, they buy as prices rise and sell as they fall, reinforcing price direction.
🔷 HVL as a Momentum and Volatility Indicator
The HVL offers traders insight into potential shifts in market momentum. For example, above HVL, if the price increases, Net GEX also rises, which stabilizes prices as market makers hedge in opposition to price direction. Below HVL, however, a price rise decreases Net GEX, creating conditions where market makers’ hedging amplifies price movements, resulting in a more volatile environment.
HVL also acts as a significant support level, often preceding put supports. If the price falls below this level, traders may expect heightened volatility and increased bearish sentiment.
Knowing the location of HVL is vital for positioning yourself on the right side of volatility. By monitoring the HVL, traders can better anticipate shifts in sentiment and align strategies with prevailing market dynamics.
_________________________________
-----------------------------------------------
🟩 Call Resistance and Call Wall Levels 🟩
In options trading, understanding GEX levels like Call Resistance and Call Wall levels is crucial for navigating potential price inflection points. Our indicator provides these levels directly on your chart, allowing you to customize and optimize your trading approach. Here’s a detailed guide to help you understand and use Call Resistance and additional Call Wall levels effectively.
🟢 Call Resistance Level
The Call Resistance Level is a key point where our model indicates heightened Call GEX concentration. This level serves as a potential resistance area where price movement may face a barrier, slowing or even reversing before a breakout. Here’s how the Call Resistance Level can influence market behavior:
Resistance and Price Reversal ⬇️ : Similar to the Put Support level, the Call Resistance acts as a "sticky" price level, where upward movement encounters resistance. When the price approaches this level, it’s common for market makers to begin shorting to maintain delta neutrality. This shorting activity, combined with the potential monetization of calls, introduces a technical bearish force in the short term, often causing the price to bounce downward.
Upside Acceleration Point ⬆️ : If investors reposition calls to higher strikes as the price reaches Call Resistance, this level can roll up, allowing the price to push upward and potentially accelerating the rally. This effect can drive the market to higher levels as market makers adjust their positions accordingly.
🟢 Additional Call Wall Levels
Our model identifies the second and third-highest Call GEX levels, known as additional Call Walls. These levels are often secondary resistance points but hold significance as they add layers of possible resistance or breakout points. They offer similar potential as the primary Call Resistance level, acting as either:
Resistance Zones: Slowing the price momentum as it approaches these levels.
Inflection Points for Upside Momentum: Allowing for a possible continuation of upward movement if prices break through.
🟢 How to Trade the Call Resistance Level
To use the Call Resistance level effectively, look for possible price rejections or consolidations as the price approaches this zone. Here are the main scenarios:
Bounce to Downside: As the price nears the Call Resistance level, market makers’ delta-hedging activity (through shorting) can turn this level into a short-term bearish force, leading to price pullbacks.
Rolling the Position: For bulls, a key objective at the Call Resistance level is to see investors roll their call positions higher, effectively moving the resistance up. This repositioning may lead to incremental price gains as the Call Resistance level rises with each roll.
_________________________________
-----------------------------------------------
🟥 Put Support and Put Wall Levels 🟥
In options trading, understanding GEX levels like Put Support and secondary Put Wall levels is essential for managing potential price support points and gauging downside risk. Our indicator places these levels directly on your chart, allowing for customization to enhance your trading strategy. Here’s a detailed guide to help you leverage the Put Support and additional Put Wall levels effectively.
🔴 Put Support Level
The Put Support Level is a key zone where our model shows the highest concentration of negative GEX, representing an area with substantial put option interest. This level functions as a potential support zone, where price may stabilize or bounce upward, or as an inflection point, signaling increased downside momentum. Here’s how the Put Support Level can affect market behavior:
Support and Price Reversal🔺 : Similar to how Call Resistance operates on the upside, the Put Support Level often acts as a "sticky" level on the downside, where price finds support. As the asset price moves closer to this level, market makers begin adjusting their positions, frequently buying to maintain delta neutrality. This activity can create a temporary short squeeze, pushing prices back up.
Downside Acceleration Point 🔻 : If the asset continues moving lower, triggering more hedging activity, this level can become a tipping point for accelerated downside momentum.
🔴 Additional Put Wall Levels
Our model also identifies the second and third-highest negative GEX levels, known as secondary Put Walls. These levels are often seen as secondary support points and hold significance by adding layers of support or potential downside inflection points. Like the primary Put Support Level, they can act in two ways:
Support Zones: Helping slow price declines as they approach these levels.
Downside Inflection Points: Allowing further price decline if the support fails.
🔴 How Investors Hedge with Put Options
Investors commonly use put options to hedge long positions and protect portfolios, especially during times of market stress when implied volatility rises. This demand for puts increases the Put Skew, as market makers short to remain delta hedged.
As prices approach the Put Support Level, the hedging activity often intensifies because more puts become At the Money (ATM) or In the Money (ITM). To realize the value of their hedges, investors typically monetize these puts at this level, triggering the closing of short positions by market makers and resulting in a price bounce.
🔴 The Role of Implied Volatility
Implied Volatility (IV) is also a critical factor since it directly influences market flows. If IV driving put flows decreases, market makers may buy back shorts, which contributes to the bounce at the Put Support Level. Additionally, another Greek, Vanna—representing changes in delta due to IV shifts—plays a vital role here. As IV changes, Vanna affects delta-hedging adjustments, adding a layer of complexity to understanding market makers' actions around these support levels.
🔴 Possible Price Scenarios at the Put Support Level
When the price reaches the Put Support Level, there are generally two scenarios:
Bounce to Upside🔺 : The Put Support Level is where substantial put hedging activity happens. As prices approach, market makers adjust their delta by buying, which can push prices back up.
Roll Positions🔻 : After monetizing puts, investors have two options: roll hedges to higher strikes if they expect a bullish move, or open new out-of-the-money puts at lower strikes. If new hedges are set at lower levels, the Put Support level may also shift lower, creating a new bearish force as market makers begin hedging these new positions.
🟨 Customizing Put Support/Call Resistance and Put/Call Wall Levels on Your Chart
Our indicator settings provide extensive customization options for displaying Put Support, Call Resistance, and Put/Call Wall levels.
You can:
adjust the depth to highlight the highest positive or negative NETGEX levels
choose to display relative data, show only the colored strike line
adjust the offset for enhanced visibility.
This flexibility helps you focus on the critical details that best align with your trading strategy, ensuring a clearer and more tailored view of the GEX levels on your chart.
Currently, we examine the top three levels with the highest positive and negative NETGEX values, allowing you to view seven key GEX levels on your chart (3 Call + 1 HVL + 3 Put). However, in the near future, we plan to expand this to seven levels per side, resulting in a total of up to 15 significant GEX levels on the chart instead of the current 7. This enhancement will cater to all needs, especially benefiting 0DTE traders.
_________________________________
-----------------------------------------------
🔶 ADDITIONAL IMPORTANT COMMENTS
🔹- Why is there a slight difference between the displayed data and other GEX provider's data like MenthorQ, GammaEdge, SpotGamma, GEXBot, etc?
There are two reasons for this, and one is beyond our control:
🔹 (1) Option-data update frequency:
According to TradingView's regulations and guidelines, we can update external data a maximum of 5 times per day. We strive to use these updates in the most optimal way:
(1st update) 15 minutes after U.S. market open
(2nd, 3rd, 4th updates) 1.5–3 hours during U.S. market open hours
(5th update) 10 minutes before U.S. market close.
You don’t need to refresh your window; our latest refreshed data pack is always automatically applied to your indicator. You can see the time elapsed since the last update by hovering over the HVL.
🔹 (2) GEX Levels with Intraday Updates Based on Price Movements
The TanukiTrade Options GEX Indicator for TradingView provides open interest data with a 15-minute delay after the market opens. Using this data, we calculate and update the relevant levels throughout the trading day, reflecting almost real-time price changes and gamma values. Unlike other GEX providers, who set their GEX levels solely at market open without further updates, we dynamically adjust our levels intraday to capture significant price shifts.
🔹 Automatic & Seamless Intraday Updates and Special Cases
For our indicator, the HVL (High Volatility Level) reflects the selected calculation mode and expiration. We update these NETGEX profiles five times throughout the trading day, with one exception: 0DTE data, which is set at market open and does not update intraday due to the rapid narrowing of gamma levels . Note that similar to other GEX providers, our 0DTE remains fixed at open, while cumulative values update during the day based on almost real-time market movements.
🔹Consistent SPX 0DTE GEX Levels with Morning Open Interest Updates Only
For SPX, the 0DTE (Zero Days to Expiration) options and GEX levels are calculated based on openinterest data provided by the clearinghouse at market open. Due to the exponential narrowing of gamma levels throughout the day, we do not update these levels intraday, unlike other expirations. Therefore, if you select the expiring contract on that day, you’ll see the exact morning level, as it was calculated at market open. This status is also published the previous evening, based on the data available then, so you can already view the levels for the following day’s 1DTE (next day’s 0DTE) before market close. After market open, around 15 minutes later, this level is updated with the latest open interest data and remains unchanged for the rest of the day. Other providers take a similar approach. We do not support intraday volume-based GEX calculations, as our benchmarks show this can produce misleading results.
Disclaimer:
Our option indicator uses approximately 15min-3 hour delayed option market snapshot data to calculate the main option metrics. Exact realtime option contract prices are never displayed; only derived GEX metrics are shown to ensure accurate and consistent visualization. Due to the above, this indicator can only be used for decision support; exclusive decisions cannot be made based on this indicator. We reserve the right to make errors.This indicator is designed for options traders who understand what they are doing. It assumes that they are familiar with options and can make well-informed, independent decisions. We work with paid delayed data and we are not a data provider; therefore, we do not bear any financial or other liability.

GEX Profile [Lite] Real Auto-Updated Gamma Exposure LevelsReal GEX Levels with Seamless Auto-updates for 5 U.S. market symbols (AAPL, TSLA, ORCL, DIA, AMZN)
🔃 Dynamic Updates : Receive precise GEX levels with auto-updating metrics up to 5 times a day throughout the trading session—no manual refresh needed!
🍒 Strategically Developed : Built by experienced options traders to meet the needs of serious options market participants.
🕒 0DTE? No Problem! : Designed with 0DTE traders in mind, our indicator keeps you updated with GEX levels and seamless auto-refresh to capture every crucial market shift.
📈 Optimized for Option Traders : See accurate NETGEX profile for multiple expirations to maximize strategic potential.
🔶 Comprehensive GEX Levels
This indicator provides unparalleled insight into market dynamics with levels like Call/Put Support, Resistance, HVL (High Volatility Level), and Call/Put Walls. These levels are auto-updated based on live market movements and reflect gamma shifts and volatility signals essential for options traders.
🔶 Ticker Information:
This 'Lite' indicator is currently only available for 5 liquid U.S. market smbols:
NASDAQ:TSLA NASDAQ:AAPL NASDAQ:AMZN AMEX:DIA and NYSE:ORCL
🔶 Ideal for 0DTE and Multi-Leg Strategies
Track essential GEX levels across expirations with our unique Cumulative (⅀) and Selected Alone (⊙) calculation models. Customize your view to reveal high-impact levels across multiple expirations or focus on a specific expiration for a targeted strategy.
🔶How does the indicator work and why is it unique?
This is not just another GEX indicator. It incorporates 15min delayed option chain data from ORATS as data provider, processes and refines the delayed data package using pineseed, and sends it to TradingView, visualizing the key GEX levels using specific formulas (see detailed below). This method of incorporating options data into a visualization framework is unique and entirely innovative on TradingView.
Unlike other providers that only set GEX levels at market open, this indicator adjusts dynamically throughout the day, providing updated insights across the trading day and capturing gamma shifts as the market moves.
_________________________________
-----------------------------------------------
🌑 𝗗 𝗢 𝗖 𝗨 𝗠 𝗘 𝗡 𝗧 𝗔 𝗧 𝗜 𝗢 𝗡 🌑
-----------------------------------------------
_________________________________
🔶 Understanding GEX (Gamma Exposure) and Gamma Profiling
Gamma Exposure (GEX) is a crucial concept in options trading because it reveals how options market positions can influence the dynamics of asset prices. In essence, GEX measures the collective gamma exposure of options market participants, impacting overall market stability and price movements.
🔹 What is GEX?
At its core, GEX captures the aggregate impact of gamma, a key options Greek, which tells us how an option's delta changes in response to price movements in the underlying asset. Positive or negative GEX levels can reflect the collective bullish or bearish stance of the market:
Positive GEX (far above HVL) : Indicates a net bullish positioning by options holders. When GEX is strongly positive, it suggests that as the asset price increases, market participants might need to buy more of the asset to maintain their hedges. This behavior can fuel further upward momentum.
Negative GEX (far below HVL) : Implies a net bearish positioning. In a strongly negative GEX environment, declines in the asset's price might prompt participants to sell, potentially exacerbating the downward movement.
🔹 The Influence of GEX on Strike Prices and Expiration
A unique feature of GEX is its impact near expiration dates. As options approach expiration, GEX levels can “pin” the price to specific strike levels, where options positions are concentrated. This pinning effect arises as market makers adjust their hedging strategies, often causing the asset price to gravitate towards certain strike prices, where a large volume of options contracts sits.
🟨 Overview of our GEX Calculation Models for Options Traders 🟨
Our GEX indicator models were developed with serious options traders in mind, providing flexibility beyond typical GEX providers. We know that using GEX levels for multi-leg strategies, where the underlying doesn't need a strong trend to be profitable , calls for a nuanced approach that aligns with different trading horizons. Here’s a detailed breakdown of our GEX calculation models and how they support strategic trading across varying timeframes.
Thus, the HVL an orher CALL/PUT WALLS depends on the indicator's selected calculation mode and expiration. The NETGEX profile of the chosen expiration appears on the HVL line , which automatically updates five times during trading hours , except for 0DTE, which reflects the value set at market open.
🔶 Cumulative Expiration (⅀) Calculation Method
This method aggregates GEX data for all expirations up to the selected date , giving you a more comprehensive view of market dynamics. We recommend using this method, as it allows you to see how combined expirations impact GEX levels, which can be critical when setting up trades with a longer time horizon.
🔶 Selected Alone (⊙) Calculation Method
This option displays the GEX profile specific to only the chosen expiration , providing a unique, time-bound view. This approach is ideal for those seeking precise insight into how an individual expiration is performing without the broader context of other expirations.
🔶 Example of using calculation methods:
With options trading, especially for multi-leg strategies, choosing the right expiration and calculation model is crucial. Let’s break down an example:
Suppose you’re considering a Friday (4DTE) front-leg diagonal on the SPX at the start of the week. In this case, the focus isn’t strictly on any single expiration (like 0DTE or 4DTE individually), but rather on what might happen cumulatively by Friday across all expirations . Here, the Cumulative Expiration (⅀) model comes into play, as it shows you an aggregated view of the GEX profile, factoring in all strikes and legs for all expirations leading up to the selected date.
For most use cases, we recommend setting your indicator to the Cumulative (⅀) model , which provides a broad and insightful look at GEX levels across multiple expirations. However, you can always switch to Selected Alone (⊙) for targeted analysis of an individual expiration. Remember, 0DTE defaults to “Selected Alone”, and Every Expiry always shows a cumulative value by default.
_________________________________
-----------------------------------------------
🟦 HVL (High Volatility Level) 🟦
Also known as the Gamma FLIP level or Zero Gamma , it represents the price level at which the gamma environment transitions from positive to negative or vice versa. The High Volatility Level (HVL) is a critical point for understanding gamma shifts and anticipating volatility. This shift influences how market makers hedge their positions, potentially increasing or dampening market volatility.
🔷 Understanding the Gamma Flip and HVL
At its core, the gamma flip represents the point where market makers may transition from a net positive to a net negative gamma position, or the reverse. When prices move above HVL, gamma is positive, often leading to lower volatility due to the stabilizing effects of market makers’ hedging. Conversely, when prices drop below HVL, gamma flips negative, and hedging by market makers can amplify volatility as they trade with the direction of price movements.
The HVL (High Volatility Level) is particularly important as it signals a shift in the impact of price movements on the GEX profile. Using the cumulative calculation mode, GEX values are aggregated across all strikes and expirations up to the selected expiration, helping to pinpoint the point where the GEX curve's slope changes from negative to positive.
🔷 Implications for Traders and Market Makers
For market makers, crossing below HVL into a negative gamma zone means that they hedge in the same direction as price movements, potentially amplifying volatility. For traders, understanding HVL's role is essential to choosing strategies that align with the prevailing volatility regime:
Positive GEX 🟢:
Above HVL, where GEX is positive, market makers hedge by buying stocks as prices fall and selling as prices rise. This has a stabilizing effect, creating a lower-volatility environment.
Negative GEX 🔴:
Below HVL, where GEX is negative, market makers' hedging aligns with price movements, increasing volatility. Here, they buy as prices rise and sell as they fall, reinforcing price direction.
🔷 HVL as a Momentum and Volatility Indicator
The HVL offers traders insight into potential shifts in market momentum. For example, above HVL, if the price increases, Net GEX also rises, which stabilizes prices as market makers hedge in opposition to price direction. Below HVL, however, a price rise decreases Net GEX, creating conditions where market makers’ hedging amplifies price movements, resulting in a more volatile environment.
HVL also acts as a significant support level, often preceding put supports. If the price falls below this level, traders may expect heightened volatility and increased bearish sentiment.
Knowing the location of HVL is vital for positioning yourself on the right side of volatility. By monitoring the HVL, traders can better anticipate shifts in sentiment and align strategies with prevailing market dynamics.
_________________________________
-----------------------------------------------
🟩 Call Resistance and Call Wall Levels 🟩
In options trading, understanding GEX levels like Call Resistance and Call Wall levels is crucial for navigating potential price inflection points. Our indicator provides these levels directly on your chart, allowing you to customize and optimize your trading approach. Here’s a detailed guide to help you understand and use Call Resistance and additional Call Wall levels effectively.
🟢 Call Resistance Level
The Call Resistance Level is a key point where our model indicates heightened Call GEX concentration. This level serves as a potential resistance area where price movement may face a barrier, slowing or even reversing before a breakout. Here’s how the Call Resistance Level can influence market behavior:
Resistance and Price Reversal ⬇️ : Similar to the Put Support level, the Call Resistance acts as a "sticky" price level, where upward movement encounters resistance. When the price approaches this level, it’s common for market makers to begin shorting to maintain delta neutrality. This shorting activity, combined with the potential monetization of calls, introduces a technical bearish force in the short term, often causing the price to bounce downward.
Upside Acceleration Point ⬆️ : If investors reposition calls to higher strikes as the price reaches Call Resistance, this level can roll up, allowing the price to push upward and potentially accelerating the rally. This effect can drive the market to higher levels as market makers adjust their positions accordingly.
🟢 Additional Call Wall Levels
Our model identifies the second and third-highest Call GEX levels, known as additional Call Walls. These levels are often secondary resistance points but hold significance as they add layers of possible resistance or breakout points. They offer similar potential as the primary Call Resistance level, acting as either:
Resistance Zones: Slowing the price momentum as it approaches these levels.
Inflection Points for Upside Momentum: Allowing for a possible continuation of upward movement if prices break through.
🟢 How to Trade the Call Resistance Level
To use the Call Resistance level effectively, look for possible price rejections or consolidations as the price approaches this zone. Here are the main scenarios:
Bounce to Downside: As the price nears the Call Resistance level, market makers’ delta-hedging activity (through shorting) can turn this level into a short-term bearish force, leading to price pullbacks.
Rolling the Position: For bulls, a key objective at the Call Resistance level is to see investors roll their call positions higher, effectively moving the resistance up. This repositioning may lead to incremental price gains as the Call Resistance level rises with each roll.
_________________________________
-----------------------------------------------
🟥 Put Support and Put Wall Levels 🟥
In options trading, understanding GEX levels like Put Support and secondary Put Wall levels is essential for managing potential price support points and gauging downside risk. Our indicator places these levels directly on your chart, allowing for customization to enhance your trading strategy. Here’s a detailed guide to help you leverage the Put Support and additional Put Wall levels effectively.
🔴 Put Support Level
The Put Support Level is a key zone where our model shows the highest concentration of negative GEX, representing an area with substantial put option interest. This level functions as a potential support zone, where price may stabilize or bounce upward, or as an inflection point, signaling increased downside momentum. Here’s how the Put Support Level can affect market behavior:
Support and Price Reversal🔺 : Similar to how Call Resistance operates on the upside, the Put Support Level often acts as a "sticky" level on the downside, where price finds support. As the asset price moves closer to this level, market makers begin adjusting their positions, frequently buying to maintain delta neutrality. This activity can create a temporary short squeeze, pushing prices back up.
Downside Acceleration Point 🔻 : If the asset continues moving lower, triggering more hedging activity, this level can become a tipping point for accelerated downside momentum.
🔴 Additional Put Wall Levels
Our model also identifies the second and third-highest negative GEX levels, known as secondary Put Walls. These levels are often seen as secondary support points and hold significance by adding layers of support or potential downside inflection points. Like the primary Put Support Level, they can act in two ways:
Support Zones: Helping slow price declines as they approach these levels.
Downside Inflection Points: Allowing further price decline if the support fails.
🔴 How Investors Hedge with Put Options
Investors commonly use put options to hedge long positions and protect portfolios, especially during times of market stress when implied volatility rises. This demand for puts increases the Put Skew, as market makers short to remain delta hedged.
As prices approach the Put Support Level, the hedging activity often intensifies because more puts become At the Money (ATM) or In the Money (ITM). To realize the value of their hedges, investors typically monetize these puts at this level, triggering the closing of short positions by market makers and resulting in a price bounce.
🔴 The Role of Implied Volatility
Implied Volatility (IV) is also a critical factor since it directly influences market flows. If IV driving put flows decreases, market makers may buy back shorts, which contributes to the bounce at the Put Support Level. Additionally, another Greek, Vanna—representing changes in delta due to IV shifts—plays a vital role here. As IV changes, Vanna affects delta-hedging adjustments, adding a layer of complexity to understanding market makers' actions around these support levels.
🔴 Possible Price Scenarios at the Put Support Level
When the price reaches the Put Support Level, there are generally two scenarios:
Bounce to Upside🔺 : The Put Support Level is where substantial put hedging activity happens. As prices approach, market makers adjust their delta by buying, which can push prices back up.
Roll Positions🔻 : After monetizing puts, investors have two options: roll hedges to higher strikes if they expect a bullish move, or open new out-of-the-money puts at lower strikes. If new hedges are set at lower levels, the Put Support level may also shift lower, creating a new bearish force as market makers begin hedging these new positions.
🟨 Customizing Put Support/Call Resistance and Put/Call Wall Levels on Your Chart
Our indicator settings provide extensive customization options for displaying Put Support, Call Resistance, and Put/Call Wall levels.
You can:
adjust the depth to highlight the highest positive or negative NETGEX levels
choose to display relative data, show only the colored strike line
adjust the offset for enhanced visibility.
This flexibility helps you focus on the critical details that best align with your trading strategy, ensuring a clearer and more tailored view of the GEX levels on your chart.
Currently, we examine the top three levels with the highest positive and negative NETGEX values, allowing you to view seven key GEX levels on your chart (3 Call + 1 HVL + 3 Put). However, in the near future, we plan to expand this to seven levels per side, resulting in a total of up to 15 significant GEX levels on the chart instead of the current 7. This enhancement will cater to all needs, especially benefiting 0DTE traders.
_________________________________
-----------------------------------------------
🔶 ADDITIONAL IMPORTANT COMMENTS
🔹- Why is there a slight difference between the displayed data and other GEX provider's data like MenthorQ, GammaEdge, SpotGamma, GEXBot, etc?
There are two reasons for this, and one is beyond our control:
🔹 (1) Option-data update frequency:
According to TradingView's regulations and guidelines, we can update external data a maximum of 5 times per day. We strive to use these updates in the most optimal way:
(1st update) 15 minutes after U.S. market open
(2nd, 3rd, 4th updates) 1.5–3 hours during U.S. market open hours
(5th update) 10 minutes before U.S. market close.
You don’t need to refresh your window; our latest refreshed data pack is always automatically applied to your indicator. You can see the time elapsed since the last update by hovering over the HVL.
🔹 (2) GEX Levels with Intraday Updates Based on Price Movements
The TanukiTrade Options GEX Indicator for TradingView provides open interest data with a 15-minute delay after the market opens. Using this data, we calculate and update the relevant levels throughout the trading day, reflecting almost real-time price changes and gamma values. Unlike other GEX providers, who set their GEX levels solely at market open without further updates, we dynamically adjust our levels intraday to capture significant price shifts.
🔹 Automatic & Seamless Intraday Updates and Special Cases
For our indicator, the HVL (High Volatility Level) reflects the selected calculation mode and expiration. We update these NETGEX profiles five times throughout the trading day, with one exception: 0DTE data, which is set at market open and does not update intraday due to the rapid narrowing of gamma levels . Note that similar to other GEX providers, our 0DTE remains fixed at open, while cumulative values update during the day based on almost real-time market movements.
Disclaimer:
Our option indicator uses approximately 15min-3 hour delayed option market snapshot data to calculate the main option metrics. Exact realtime option contract prices are never displayed; only derived GEX metrics are shown to ensure accurate and consistent visualization. Due to the above, this indicator can only be used for decision support; exclusive decisions cannot be made based on this indicator. We reserve the right to make errors.This indicator is designed for options traders who understand what they are doing. It assumes that they are familiar with options and can make well-informed, independent decisions. We work with paid delayed data and we are not a data provider; therefore, we do not bear any financial or other liability.

Options Oscillator [PRO] IVRank, IVx, Call/Put Volatility Skew𝗧𝗵𝗲 𝗳𝗶𝗿𝘀𝘁 𝗧𝗿𝗮𝗱𝗶𝗻𝗴𝗩𝗶𝗲𝘄 𝗶𝗻𝗱𝗶𝗰𝗮𝘁𝗼𝗿 𝘁𝗵𝗮𝘁 𝗽𝗿𝗼𝘃𝗶𝗱𝗲𝘀 𝗥𝗘𝗔𝗟 𝗜𝗩𝗥𝗮𝗻𝗸, 𝗜𝗩𝘅, 𝗮𝗻𝗱 𝗖𝗔𝗟𝗟/𝗣𝗨𝗧 𝘀𝗸𝗲𝘄 𝗱𝗮𝘁𝗮 𝗯𝗮𝘀𝗲𝗱 𝗼𝗻 𝗥𝗘𝗔𝗟 𝗼𝗽𝘁𝗶𝗼𝗻 𝗰𝗵𝗮𝗶𝗻 𝗳𝗼𝗿 𝗼𝘃𝗲𝗿 𝟭𝟲𝟱+ 𝗺𝗼𝘀𝘁 𝗹𝗶𝗾𝘂𝗶𝗱 𝗨.𝗦. 𝗺𝗮𝗿𝗸𝗲𝘁 𝘀𝘆𝗺𝗯𝗼𝗹𝘀
🔃 Auto-Updating Option Metrics without refresh!
🍒 Developed and maintained by option traders for option traders.
📈 Specifically designed for TradingView users who trade options.
🔶 Ticker Information:
This indicator is currently only available for over 165+ most liquid U.S. market symbols (eg. SP:SPX AMEX:SPY NASDAQ:QQQ NASDAQ:TLT NASDAQ:NVDA , etc.. ), and we are continuously expanding the compatible watchlist here: www.tradingview.com
🔶 How does the indicator work and why is it unique?
This Pine Script indicator is a complex tool designed to provide various option metrics and visualization tools for options market traders. The indicator extracts raw options data from an external data provider (ORATS), processes and refines the delayed data package using pineseed, and sends it to TradingView, visualizing the data using specific formulas (see detailed below) or interpolated values (e.g., delta distances). This method of incorporating options data into a visualization framework is unique and entirely innovative on TradingView.
The indicator aims to offer a comprehensive view of the current state of options for the implemented instruments, including implied volatility (IV), IV rank (IVR), options skew, and expected market movements, which are objectively measured as detailed below.
The options metrics we display may be familiar to options traders from various major brokerage platforms such as TastyTrade, IBKR, TOS, Tradier, TD Ameritrade, Schwab, etc.
🟨 The following data is displayed in the oscillator 🟨
We use Tastytrade formulas, so our numbers mostly align with theirs!
🔶 𝗜𝗩𝗥𝗮𝗻𝗸
The Implied Volatility Rank (IVR) helps options traders assess the current level of implied volatility (IV) in comparison to the past 52 weeks. IVR is a useful metric to determine whether options are relatively cheap or expensive. This can guide traders on whether to buy or sell options.
IV Rank formula = (current IV - 52 week IV low) / (52 week IV high - 52 week IV low)
IVRank is default blue and you can adjust their settings:
🔶 𝗜𝗩𝘅 𝗮𝘃𝗴
The implied volatility (IVx) shown in the option chain is calculated like the VIX. The Cboe uses standard and weekly SPX options to measure expected S&P 500 volatility. A similar method is used for calculating IVx for each expiration cycle.
We aggregate the IVx values for the 35-70 day monthly expiration cycle, and use that value in the oscillator and info panel.
We always display which expiration the IVx values are averaged for when you hover over the IVx cell.
IVx main color is purple, but you can change the settings:
🔹 IVx 5 days change %
We are also displaying the five-day change of the IV Index (IVx value). The IV Index 5-Day Change column provides quick insight into recent expansions or decreases in implied volatility over the last five trading days.
Traders who expect the value of options to decrease might view a decrease in IVX as a positive signal. Strategies such as Strangle and Ratio Spread can benefit from this decrease.
On the other hand, traders anticipating further increases in IVX will focus on the rising IVX values. Strategies like Calendar Spread or Diagonal Spread can take advantage of increasing implied volatility.
This indicator helps traders quickly assess changes in implied volatility, enabling them to make informed decisions based on their trading strategies and market expectations.
Important Note:
The IVx value alone does not provide sufficient context. There are stocks that inherently exhibit high IVx values. Therefore, it is crucial to consider IVx in conjunction with the Implied Volatility Rank (IVR), which measures the IVx relative to its own historical values. This combined view helps in accurately assessing the significance of the IVx in relation to the specific stock's typical volatility behavior.
This indicator offers traders a comprehensive view of implied volatility, assisting them in making informed decisions by highlighting both the absolute and relative volatility measures.
🔶 𝗖𝗔𝗟𝗟/𝗣𝗨𝗧 𝗣𝗿𝗶𝗰𝗶𝗻𝗴 𝗦𝗸𝗲𝘄 𝗵𝗶𝘀𝘁𝗼𝗴𝗿𝗮𝗺
At TanukiTrade, Vertical Pricing Skew refers to the difference in pricing between put and call options with the same expiration date at the same distance (at tastytrade binary expected move). We analyze this skew to understand market sentiment. This is the same formula used by TastyTrade for calculations.
We calculate the interpolated strike price based on the expected move, taking into account the neighboring option prices and their distances. This allows us to accurately determine whether the CALL or PUT options are more expensive.
🔹 What Causes Pricing Skew? The Theory Behind It
The asymmetric pricing of PUT and CALL options is driven by the natural dynamics of the market. The theory is that when CALL options are more expensive than PUT options at the same distance from the current spot price, market participants are buying CALLs and selling PUTs, expecting a faster upward movement compared to a downward one .
In the case of PUT skew, it's the opposite: participants are buying PUTs and selling CALLs , as they expect a potential downward move to happen more quickly than an upward one.
An options trader can take advantage of this phenomenon by leveraging PUT pricing skew. For example, if they have a bullish outlook and both IVR and IVx are high and IV started decreasing, they can capitalize on this PUT skew with strategies like a jade lizard, broken wing butterfly, or short put.
🔴 PUT Skew 🔴
Put options are more expensive than call options, indicating the market expects a faster downward move (▽). This alone doesn't indicate which way the market will move (because nobody knows that), but the options chain pricing suggests that if the market moves downward, it could do so faster in velocity compared to a potential upward movement.
🔹 SPY PUT SKEW example:
If AMEX:SPY PUT option prices are 46% higher than CALLs at the same distance for the optimal next monthly expiry (DTE). This alone doesn't indicate which way the market will move (because nobody knows that), but the options chain pricing suggests that if the market moves downward, it could do so 46% faster in velocity compared to a potential upward movement
🟢 CALL Skew 🟢
Call options are more expensive than put options, indicating the market expects a faster upward move (△). This alone doesn't indicate which way the market will move (because nobody knows that), but the options chain pricing suggests that if the market moves upward, it could do so faster in velocity compared to a potential downward movement.
🔹 INTC CALL SKEW example:
If NASDAQ:INTC CALL option prices are 49% higher than PUTs at the same distance for the optimal next monthly expiry (DTE). This alone doesn't indicate which way the market will move (because nobody knows that), but the options chain pricing suggests that if the market moves upward, it could do so 49% faster in velocity compared to a potential downward movement .
🔶 USAGE example:
The script is compatible with our other options indicators.
For example: Since the main metrics are already available in this Options Oscillator, you can hide the main IVR panel of our Options Overlay indicator, freeing up more space on the chart. The following image shows this:
🔶 ADDITIONAL IMPORTANT COMMENTS
🔹 Historical Data:
Yes, we only using historical internal metrics dating back to 2024-07-01, when the TanukiTrade options brand launched. For now, we're using these, but we may expand the historical data in the future.
🔹 What distance does the indicator use to measure the call/put pricing skew?:
It is important to highlight that this oscillator displays the call/put pricing skew changes for the next optimal monthly expiration on a histogram.
The Binary Expected Move distance is calculated using the TastyTrade method for the next optimal monthly expiration: Formula = (ATM straddle price x 0.6) + (1st OTM strangle price x 0.3) + (2nd OTM strangle price x 0.1)
We interpolate the exact difference based on the neighboring strikes at the binary expected move distance using the TastyTrade method, and compare the interpolated call and put prices at this specific point.
🔹 - Why is there a slight difference between the displayed data and my live brokerage data?
There are two reasons for this, and one is beyond our control.
◎ Option-data update frequency:
According to TradingView's regulations and guidelines, we can update external data a maximum of 5 times per day. We strive to use these updates in the most optimal way:
(1st update) 15 minutes after U.S. market open
(2nd, 3rd, 4th updates) 1.5–3 hours during U.S. market open hours
(5th update) 10 minutes before U.S. market close.
You don’t need to refresh your window, our last refreshed data-pack is always automatically applied to your indicator, and you can see the time elapsed since the last update at the bottom of the corner on daily TF.
◎ Brokerage Calculation Differences:
Every brokerage has slight differences in how they calculate metrics like IV and IVx. If you open three windows for TOS, TastyTrade, and IBKR side by side, you will notice that the values are minimally different. We had to choose a standard, so we use the formulas and mathematical models described by TastyTrade when analyzing the options chain and drawing conclusions.
🔹 - EOD data:
The indicator always displays end-of-day (EOD) data for IVR, IV, and CALL/PUT pricing skew. During trading hours, it shows the current values for the ongoing day with each update, and at market close, these values become final. From that point on, the data is considered EOD, provided the day confirms as a closed daily candle.
🔹 - U.S. market only:
Since we only deal with liquid option chains: this option indicator only works for the USA options market and do not include future contracts; we have implemented each selected symbol individually.
Disclaimer:
Our option indicator uses approximately 15min-3 hour delayed option market snapshot data to calculate the main option metrics. Exact realtime option contract prices are never displayed; only derived metrics and interpolated delta are shown to ensure accurate and consistent visualization. Due to the above, this indicator can only be used for decision support; exclusive decisions cannot be made based on this indicator. We reserve the right to make errors.This indicator is designed for options traders who understand what they are doing. It assumes that they are familiar with options and can make well-informed, independent decisions. We work with public data and are not a data provider; therefore, we do not bear any financial or other liability.

BK GEX LevelsThis indicator was created to plot lines and labels based on the GEX Levels provided by BK Brown or any other provider of GEX Levels.
The Levels must be added in the settings panel in the following format:
PRICE,TITLE;
Example of a GEX data dump of levels formatted for the indicator.
5760,HvolC;5660,HvolP;5710,Upper PDVR;5660,Lower PDVR;5700,Upper CDVR;5690,Lower CDVR;
Once the formatted text is added to the settings. The indicator will plot simple lines on the price level with its Title. The title is added as a Label over or under the line that was plotted for that level. When to price levels fall on the same level for example: 5760,HvolP;5760,Upper PDVR; - the line will be plotted as a red dashed line with one label above the line and the other label below the same line.
In the settings you can:
Change colors and opacity of Lines and Labels
Show/Hide Labels
Thank you

SPY to ES or QQQ to NQThis indicator is used to automatically map SPY VWAP and 10 levels of your choice to ES / MES or map QQQ VWAP and 10 levels of your choice to NQ / MNQ . Since SPY and QQQ have the same price action as their futures iteration, there seems to a direct correlation between their levels and VWAP. This indicator is made to easily map the key levels of your choice to the appropriate futures instrument.

DIX Short Sale VolumeThis indicator combines all the short sale volumes from NASDAQ, NYSE and BATS exchanges and calculates Short Vol % to Total Volume across these 3 exchanges. Use it on Daily Timeframe as shown in the above chart.
For more information on Short Sale Volumes refer to www.finra.org
Usage
When short sale volume data is rising rapidly, it indicates bullishness in the underlying as market makers do not have the shares to sell which results in short sale
When a stock gets dumped by institutions, short sale %age is normally very low and trend is downwards
