EDUVEST QQE Grade System - S/A/B/C Signal ClassificationEDUVEST QQE Grade System - S/A/B/C Signal Classification
━━━━━━━━━━━━━━━━━━━━━━━━━━━━━━━━━━━━━━━━━━━━━━━━
█ ORIGINALITY
This indicator introduces a unique grading system (S/A/B/C) for QQE signals, combining traditional QQE analysis with SMC (Smart Money Concepts) price zones and trading session filters. Unlike standard QQE indicators that show all signals equally, this version classifies signals by quality to help traders focus on the highest probability setups.
━━━━━━━━━━━━━━━━━━━━━━━━━━━━━━━━━━━━━━━━━━━━━━━━
█ WHAT IT DOES
- Generates BUY/SELL signals with S/A/B/C grade classification
- Automatically detects asset type and applies optimized QQE factors
- Integrates SMC price zones (support/resistance) for grade enhancement
- Filters signals by trading session time
- Displays real-time session and market status
Grade Hierarchy:
- S (Gold/Orange): Signal near SMC zone + active trading hours - Highest quality
- A (Green/Red): Score 70+ during trading hours - High quality
- B (Darker): Score 50-69 during trading hours - Medium quality
- C (Gray, small): Outside trading hours or weak signal - Low quality
━━━━━━━━━━━━━━━━━━━━━━━━━━━━━━━━━━━━━━━━━━━━━━━━
█ HOW IT WORKS
【QQE Core Calculation】
The QQE (Quantitative Qualitative Estimation) is calculated as:
1. RSI with configurable period (default: 14)
2. EMA smoothing of RSI (Smoothing Factor: 5)
3. Dynamic bands using Wilder's smoothing: RSI ± (ATR of RSI × QQE Factor)
QQE Factor is auto-adjusted per asset:
- USD/JPY: 4.238
- EUR/USD: 3.8
- Gold (XAU/USD): 8.0
- NASDAQ/US100: 9.0
【Signal Generation】
- BUY: QQE line crosses above its trailing stop (QQExlong == 1)
- SELL: QQE line crosses below its trailing stop (QQExshort == 1)
【Internal Scoring System】
Score components (0-100):
- Signal Base: +25 points when signal occurs
- QQE Strength: +10 to +20 based on RSI distance from 50
- Volatility: +15 (optimal ATR ratio 1.1-2.0), -10 (low volatility)
- Volume Confirmation: +10 (high volume), -5 (low volume)
- Session Bonus: +5 during London/NY sessions
- Base: +20 points
【Grade Assignment】
- Grade S: Signal near user-defined SMC price zone (within tolerance %) AND during trading hours
- Grade A: Internal score >= 70 AND during trading hours
- Grade B: Internal score >= 50 AND during trading hours
- Grade C: Outside trading hours OR score < 50
【SMC Price Zone Integration】
Users can set support/resistance levels for each asset. When price is within the tolerance percentage of these levels, signals are upgraded to S-grade, indicating confluence with institutional price levels.
【Trading Session Filter】
Configurable active trading hours (JST timezone):
- Default: 15:00 - 01:00 JST (London + NY overlap)
- Signals outside this window receive C-grade
━━━━━━━━━━━━━━━━━━━━━━━━━━━━━━━━━━━━━━━━━━━━━━━━
█ HOW TO USE
【Recommended Settings】
- Timeframe: 15M, 1H, 4H
- Best on: USD/JPY, EUR/USD, Gold, NASDAQ
- Focus on: S and A grade signals
【Trading Strategy】
- S-Grade (Gold/Orange): Highest conviction - consider larger position
- A-Grade (Green/Red): Strong signal - standard position
- B-Grade: Valid but use additional confirmation
- C-Grade: Avoid or use minimal size
【Setting Up SMC Zones】
1. Identify key support/resistance on higher timeframe
2. Input prices in SMC Price Settings
3. Adjust tolerance % (default: 0.15%)
4. S-grade appears when signal occurs near these levels
【Info Panel】
Top-right panel shows:
- Asset name and detection mode (Auto/Manual)
- Current session (Tokyo/London/NY)
- Trading hours status
- SMC zone proximity
【Alert Setup】
1. Enable alerts in settings
2. Create alert with "Any alert() function call"
3. Alerts include grade, price, and session info
━━━━━━━━━━━━━━━━━━━━━━━━━━━━━━━━━━━━━━━━━━━━━━━━
█ SETTINGS
Basic Settings:
- Enable Alerts: Turn on/off notifications
- Time Filter: Activate trading hour filter
- Start/End Hour: Define active trading window (JST)
QQE Settings:
- RSI Period: RSI calculation period
- RSI Smoothing: EMA smoothing factor
- Auto QQE Factor: Auto-detect optimal factor per asset
- Manual QQE Factor: Override when auto is disabled
SMC Price Settings:
- Support/Resistance levels for each asset
- Tolerance %: How close to SMC line for S-grade
Display Settings:
- Grade Only: Hide QQE lines, show only signals
- Show SMC Lines: Display support/resistance on chart
- Show Debug: Display asset detection info
━━━━━━━━━━━━━━━━━━━━━━━━━━━━━━━━━━━━━━━━━━━━━━━━
█ CREDITS
QQE concept originally developed by John Ehlers.
SMC (Smart Money Concepts) integration and grading system by EduVest.
License: Mozilla Public License 2.0
Goldlong

Golden Vector Trend Orchestrator (GVTO)Golden Vector Trend Orchestrator (GVTO) is a composite trend-following strategy specifically engineered for XAUUSD (Gold) and volatile assets on H4 (4-Hour) and Daily timeframes.
This script aims to solve a common problem in trend trading: "Whipsaws in Sideways Markets." Instead of relying on a single indicator, GVTO employs a Multi-Factor Confluence System that filters out low-probability trades by requiring alignment across Trend Structure, Momentum, and Volatility.
🛠 Methodology & Logic
The strategy executes trades only when four distinct technical conditions overlap (Confluence). If any single condition is not met, the trade is filtered out to preserve capital.
1. Market Structure Filter (200 EMA)
Indicator: Exponential Moving Average (Length 200).
Logic: The 200 EMA acts as the baseline for the long-term trend regime.
Bullish Regime: Price must close above the 200 EMA.
Bearish Regime: Price must close below the 200 EMA.
Purpose: Prevents counter-trend trading against the macro direction.
2. Signal Trigger & Trailing Stop (Supertrend)
Indicator: Supertrend (ATR Length 14, Factor 3.5).
Logic: Uses Average True Range (ATR) to detect trend reversals while accounting for volatility.
Purpose: Provides the specific entry signal and acts as a dynamic trailing stop-loss to let profits run while cutting losses when the trend invalidates.
3. Volatility Gatekeeper (ADX Filter)
Indicator: Average Directional Index (Length 14).
Threshold: > 25.
Logic: A high ADX value indicates a strong trend presence, regardless of direction.
Purpose: This is the most critical filter. It prevents the strategy from entering trades during "choppy" or ranging markets (consolidation zones) where trend-following systems typically fail.
4. Momentum Confirmation (DMI)
Indicator: Directional Movement Index (DI+ and DI-).
Logic: Checks if the buying pressure (DI+) is physically stronger than selling pressure (DI-), or vice versa.
Purpose: Ensures that the price movement is backed by genuine momentum, not just a momentary price spike.
📋 How to Use This Strategy
🟢 LONG (BUY) Setup
A Buy signal is generated only when ALL of the following occur simultaneously:
Price Action: Price closes ABOVE the 200 EMA (Orange Line).
Trigger: Supertrend flips to GREEN (Bullish).
Strength: ADX is greater than 25 (Strong Trend).
Momentum: DI+ (Plus Directional Indicator) is greater than DI- (Minus).
🔴 SHORT (SELL) Setup
A Sell signal is generated only when ALL of the following occur simultaneously:
Price Action: Price closes BELOW the 200 EMA (Orange Line).
Trigger: Supertrend flips to RED (Bearish).
Strength: ADX is greater than 25 (Strong Trend).
Momentum: DI- (Minus Directional Indicator) is greater than DI+ (Plus).
🛡 Exit Strategy
Stop Loss / Take Profit: The strategy utilizes the Supertrend Line as a dynamic Trailing Stop.
Exit Long: When Supertrend turns Red.
Exit Short: When Supertrend turns Green.
Note: Traders can also use the real-time P/L Dashboard included in the script to manually secure profits based on their personal Risk:Reward ratio.
📊 Included Features
Real-Time P/L Dashboard: A table in the top-right corner displays the current trend status, ADX strength, and the Unrealized Profit/Loss % of the current active position.
Smart Labeling: Buy/Sell labels are coded to appear only on the initial entry trigger. They do not repaint and do not spam the chart if the trend continues (no pyramiding visualization).
Visual Aids: Background color changes (Green/Red) to visually represent the active trend based on the Supertrend status.
⚠️ Risk Warning & Best Practices
Asset Class: Optimized for XAUUSD (Gold) due to its high volatility nature. It also works well on Crypto (BTC, ETH) and Major Forex Pairs.
Timeframe: Highly recommended for H4 (4 Hours) or D1 (Daily). Using this on lower timeframes (M5, M15) may result in false signals due to market noise.
News Events: Automated strategies cannot predict economic news (CPI, NFP). Exercise caution or pause trading during high-impact economic releases.

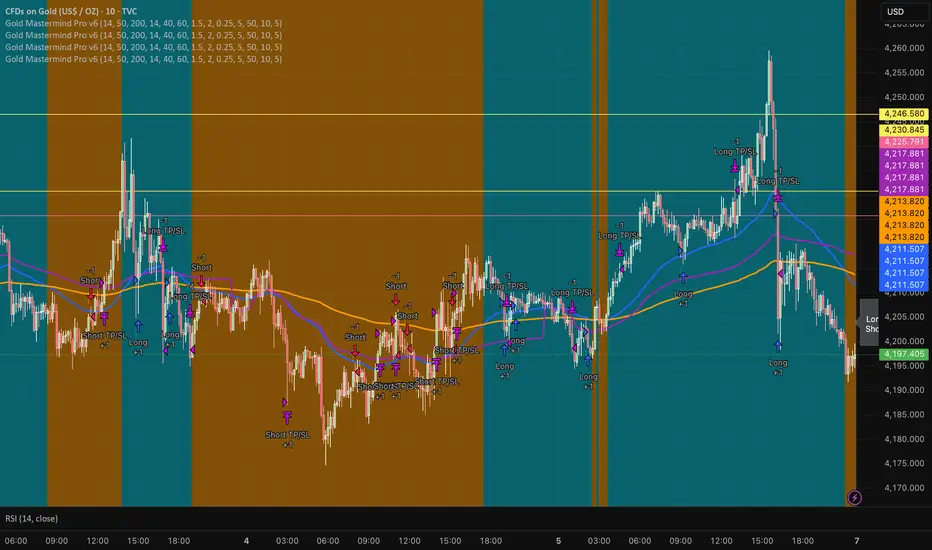
Gold Mastermind Pro v6EMA50 / EMA200 trend (UP / DOWN / FLAT)
VWAP + ATR + RSI filters for entries
ATR-based stop & 2R target
Risk-based position sizing with max 5 contracts
Cooldown in bars after each entry
Long arrows = baby blue, Short arrows = bright orange
Simple dashboard label showing trend, qty, stop & target
SuperTrade ST1 StrategyOverview
The SuperTrade ST1 Strategy is a long-only trend-following strategy that combines a Supertrend indicator with a 200-period EMA filter to isolate high-probability bullish trade setups. It is designed to operate in trending markets, using volatility-based exits with a strict 1:4 Risk-to-Reward (R:R) ratio, meaning that each trade targets a profit 4× the size of its predefined risk.
This strategy is ideal for traders looking to align with medium- to long-term trends, while maintaining disciplined risk control and minimal trade frequency.
How It Works
This strategy leverages three key components:
Supertrend Indicator
A trend-following indicator based on Average True Range (ATR).
Identifies bullish/bearish trend direction by plotting a trailing stop line that moves with price volatility.
200-period Exponential Moving Average (EMA) Filter
Trades are only taken when the price is above the EMA, ensuring participation only during confirmed uptrends.
Helps filter out counter-trend entries during market pullbacks or ranges.
ATR-Based Stop Loss and Take Profit
Each trade uses the ATR to calculate volatility-adjusted exit levels.
Stop Loss: 1× ATR below entry.
Take Profit: 4× ATR above entry (1:4 R:R).
This asymmetry ensures that even with a lower win rate, the strategy can remain profitable.
Entry Conditions
A long trade is triggered when:
Supertrend flips from bearish to bullish (trend reversal).
Price closes above the Supertrend line.
Price is above the 200 EMA (bullish market bias).
Exit Logic
Once a long position is entered:
Stop loss is set 1 ATR below entry.
Take profit is set 4 ATR above entry.
The strategy automatically exits the position on either target.
Backtest Settings
This strategy is configured for realistic backtesting, including:
$10,000 account size
2% equity risk per trade
0.1% commission
1 tick slippage
These settings aim to simulate real-world conditions and avoid overly optimistic results.
How to Use
Apply the script to any timeframe, though higher timeframes (1H, 4H, Daily) often yield more reliable signals.
Works best in clearly trending markets (especially in crypto, stocks, indices).
Can be paired with alerts for live trading or analysis.
Important Notes
This version is long-only by design. No short positions are executed.
Ideal for swing traders or position traders seeking asymmetric returns.
Users can modify the ATR period, Supertrend factor, or EMA filter length based on asset behavior.

Gold Friday Anomaly StrategyThis script implements the " Gold Friday Anomaly Strategy ," a well-known historical trading strategy that leverages the gold market's behavior from Thursday evening to Friday close. It is a backtesting-focused strategy designed to assess the historical performance of this pattern. Traders use this anomaly as it captures a recurring market tendency observed over the years.
What It Does:
Entry Condition: The strategy enters a long position at the beginning of the Friday trading session (Thursday evening close) within the defined backtesting period.
Exit Condition: Friday evening close.
Backtesting Controls: Allows users to set custom backtesting periods to evaluate strategy performance over specific date ranges.
Key Features:
Custom Backtest Periods: Easily configurable inputs to set the start and end date of the backtesting range.
Fixed Slippage and Commission Settings: Ensures realistic simulation of trading conditions.
Process Orders on Close: Backtesting is optimized by processing orders at the bar's close.
Important Notes:
Backtesting Only: This script is intended purely for backtesting purposes. Past performance is not indicative of future results.
Live Trading Recommendations: For live trading, it is highly recommended to use limit orders instead of market orders, especially during evening sessions, as market order slippage can be significant.
Default Settings:
Entry size: 10% of equity per trade.
Slippage: 1 tick.
Commission: 0.05% per trade.

Marcel's Dynamic Profit / Loss Calculator for GoldOverview
This Dynamic Risk / Reward Tool for Gold is designed to help traders efficiently plan and manage their trades in the volatile gold market. This script provides a clear visualisation of trade levels (Entry, Stop Loss, Take Profit) while dynamically calculating potential profit and loss. It ensures gold traders can assess their positions with precision, saving time and improving risk management.
Key Features
1. Trade Level Visualisation:
Plots Entry (Blue), Stop Loss (Red), and Take Profit (Green) lines directly on the chart.
Helps you visualise and confirm trade setups quickly which is good for scalping and day trades.
2. Dynamic Risk and Reward Calculations:
Calculates potential profit and loss in real time based on user-defined inputs such as position size, leverage, and account equity.
Displays a summary panel showing risk/reward metrics directly on the chart.
3. Customisable Settings:
Allows you to adjust key parameters like account equity, position size, leverage, and specific price levels for Entry, Stop Loss, and Take Profit.
Defaults are dynamically generated for convenience but remain fully adjustable for flexibility.
How It Works
The script uses gold-specific conventions (e.g., 1 lot = 100 ounces, 1 pip = 0.01 price change) to calculate accurate risk and reward metrics.
It dynamically positions Stop Loss and Take Profit levels relative to the entry price, based on user-defined or default offsets.
A real-time summary panel is displayed in the bottom-right corner of the chart, showing:
Potential Profit: The monetary value if the Take Profit is hit.
Potential Lo
ss: The monetary value if the Stop Loss is hit.
How to Use It
1. Add the script to your chart on a gold trading pair (e.g., XAUUSD).
2. Input your:
Account equity.
Leverage.
Position size (in lots).
Desired En
try Price (default: current close price).
3. Adjust the Stop Loss and Take Profit levels to your strategy, or let the script use default offsets of:
500 pips below the Entry for Stop Loss.
1000 pips above the Entry for Take Profit.
4. Review the plotted levels and the summary panel to confirm your trade aligns with your risk/reward goals.
Why Use This Tool?
Clarity and Precision:
Provides clear trade visuals and financial metrics for confident decision-making.
Time-Saving:
Automates the calculations needed to evaluate trade risk and reward.
Improved Risk Management:
Ensures you never trade without knowing your exact potential loss and gain.
This script is particularly useful for both novice and experienced traders looking to enhance their risk management and trading discipline in the Gold market. Enjoy clearer trades at speed.

XAUUSD Multi-Timeframe Trend AnalyzerOverview
The "XAUUSD Multi-Timeframe Trend Analyzer" is an advanced script designed to provide a comprehensive analysis of the XAUUSD (Gold/US Dollar) trend across multiple timeframes simultaneously. By combining several key technical indicators, this tool helps traders quickly assess the market direction and trend strength for M15, M30, H1, H4, and D1 timeframes.
Multi-Timeframe Analysis: Displays the trend direction and strength across M15, M30, H1, H4, and D1 timeframes, allowing for a complete overview in a single glance.
Comprehensive Indicator Blend: Utilizes six popular technical indicators to determine the trend—Moving Averages, RSI, MACD, Bollinger Bands, DMI, and Parabolic SAR.
Trend Strength Scoring: Provides a numerical trend strength score (from -6 to 6) based on the alignment of the indicators, with positive values indicating uptrends and negative values for downtrends.
Visual Table Display: Displays results in a color-coded table (green for uptrend, red for downtrend, yellow for neutral) with a strength score for each timeframe, helping traders quickly assess market conditions.
How It Works
This script calculates the overall trend and its strength for each selected timeframe by analyzing six widely-used technical indicators:
Moving Averages (MA): The script uses a Fast and a Slow Moving Average. When the Fast MA crosses above the Slow MA, it indicates an uptrend. When the Fast MA crosses below, it signals a downtrend.
Relative Strength Index (RSI): The RSI is used to assess momentum. An RSI value above 50 suggests bullish momentum, while a value below 50 suggests bearish momentum.
Moving Average Convergence Divergence (MACD): MACD measures momentum and trend direction. When the MACD line crosses above the signal line, it signals bullish momentum; when it crosses below, it signals bearish momentum.
Bollinger Bands: These measure price volatility. When the price is above the middle Bollinger Band, the script considers the trend to be bullish, and when it's below, bearish.
Directional Movement Index (DMI): The DMI compares positive directional movement (DI+) and negative directional movement (DI-). A stronger DI+ over DI- signals an uptrend and vice versa.
Parabolic SAR: This indicator is used for determining potential trend reversals and setting stop-loss levels. If the price is above the Parabolic SAR, it indicates an uptrend, and if below, a downtrend.
Trend Strength Calculation
The script calculates a trend strength score for each timeframe:
Each indicator adds or subtracts 1 to the score based on whether it aligns with an uptrend or a downtrend.
A score of 6 indicates a Strong Uptrend, with all indicators aligned bullishly.
A score of -6 indicates a Strong Downtrend, with all indicators aligned bearishly.
Intermediate scores (e.g., 2 or -2) indicate Weak Uptrend or Weak Downtrend, suggesting that not all indicators are in agreement.
A score between 1 and -1 indicates a Neutral trend, suggesting uncertainty in the market.
How to Use
Assess Trend Direction and Strength: The table provides an easy-to-read summary of the trend and its strength on different timeframes. Look for timeframes where the strength is high (either 6 for a strong uptrend or -6 for a strong downtrend) to confirm the market’s overall direction.
Use in Conjunction with Other Strategies: This indicator is designed to provide a comprehensive view of the market. Traders should combine it with other strategies, such as price action analysis or candlestick patterns, to further confirm their trades.
Trend Reversal or Continuation: A weak trend (e.g., a strength of 2 or -2) could signal a possible reversal or a trend that has lost momentum. Strong trends (with a strength of 6 or -6) indicate higher confidence in trend continuation.
Multiple Timeframe Confirmation: Look for alignment across multiple timeframes to confirm the strength and direction of the trend before entering trades. For example, if M15, M30, and H1 are all showing a strong uptrend, it suggests a higher probability of the trend continuing.
Customization Options
- Adjustable Indicators: Users can modify the length and parameters of the Moving Averages, RSI, MACD, Bollinger Bands, DMI, and Parabolic SAR to suit their trading style.
- Flexible Timeframes: You can toggle between different timeframes (M15, M30, H1, H4, D1) to focus on the intervals most relevant to your strategy.
Ideal For
- Traders looking for a detailed, multi-timeframe trend analysis tool for XAUUSD.
- Traders who rely on trend-following strategies and need confirmation across multiple timeframes.
- Those who prefer a multi-indicator approach to avoid false signals and improve the accuracy of their trades.
Disclaimer
This indicator is for informational and educational purposes only. It is recommended to combine this with proper risk management strategies and your own analysis. Past performance does not guarantee future results. Always perform your own due diligence before making trading decisions.
