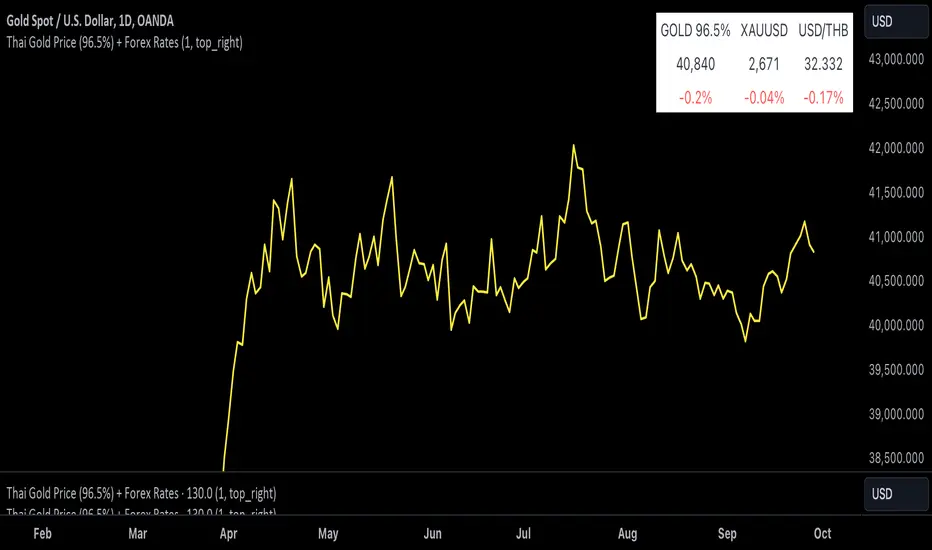
Gold Thai CompassGold Thai Compass Indicator
Calculates Thai Gold Price (96.5%) by converting XAU/USD with the USD/THB exchange rate in real time
Displays the calculated gold_price_thb directly on the chart with a clean right-aligned label for easy price reading
Includes customizable reference lines — add, remove, rename, recolor, and adjust each line independently
Supports multiple editable lines (e.g., 4 levels) with price labels displayed beside each line
Provides user-friendly input settings (e.g., custom price sources, spread/adjustment options)
Updates dynamically with live market data — suitable for trading, analysis, and Thai gold price tracking
Designed for TradingView (Pine Script) and optimized for clarity and usability
Optional visibility controls to show/hide labels and reference lines for a cleaner chart layout
Goldprice

Hassi XAUUSD STRATEGY BOTGold (XAUUSD) 15m trend+momentum based signals with EMA(9/21/200), RSI, custom ADX, ATR-based SL/TP & alerts
Works on XAUUSD 15m.
Entry: EMA9/21 cross + price relative to EMA200 + RSI filter + custom ADX trend strength.
Risk: default SL=1.5×ATR, TP=2×ATR (editable).
Notes: No financial advice. Backtest before live use. Avoid high-impact news whipsaws.

Apex Edge - RSI Trend LinesThe Apex Edge - RSI Trend Lines indicator is a precision tool that automatically draws real-time trendlines on the RSI oscillator using confirmed pivot highs and lows. These dynamic trendlines track RSI structure in motion, helping you anticipate breakout zones, reversals, and hidden divergences.
Every time a new pivot forms, the indicator automatically re-draws the RSI trendline between the two most recent pivots — giving you an always-current view of momentum structure. You’ll instantly see when RSI begins compressing or expanding, long before price reacts.
Key Features: • Dynamic RSI trendlines drawn from the last 2 pivots
• Auto re-draws in real-time as new pivots form
• Optional "Full Extend" or "Pivot Only" modes
• Slope color-coded: green = support, red = resistance
• Built-in dotted RSI levels (30/70 default)
• Alert conditions for RSI trendline breakout signals
• Ideal for spotting divergence, compression, and early SMC confluence
This is not your average RSI — it’s a fully reactive momentum edge overlay designed to give you clarity, structure, and timing from within the oscillator itself. Perfect for traders using Smart Money Concepts, divergence setups, or algorithmic trend tracking.
⚔️ Built for precision. Built for edge. Built for Apex.

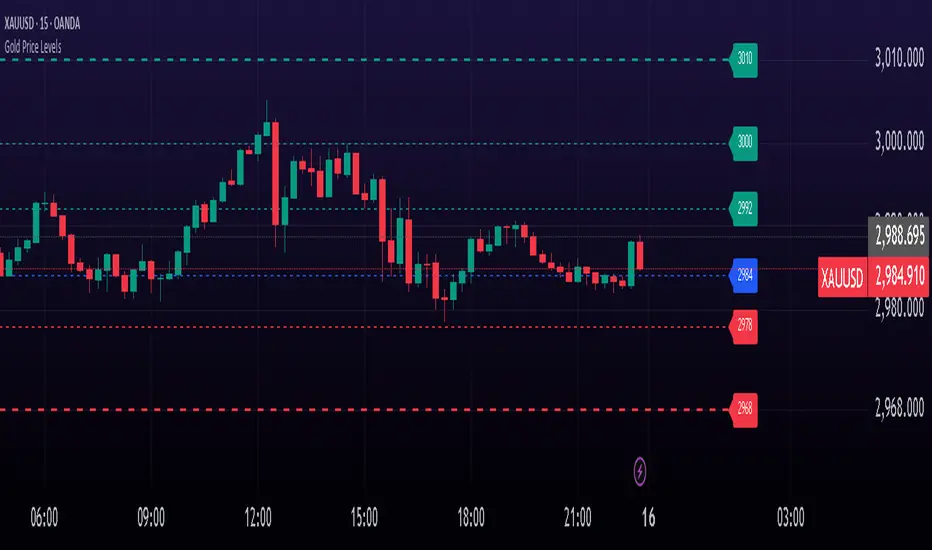
Gold Price LevelsThis indicator identifies and displays key price levels for gold trading. It highlights important psychological and technical price points that often act as support and resistance levels.
Features
Automatically identifies and displays key price levels ending in 92, 84, 78, 55, 42, 27, and 00
Special emphasis on critical levels ending in 68, 32, and 10 with increased line width
Color-coded visualization: green for levels above current price, red for levels below
Customizable line style, width, and label visibility
Automatically adjusts to different price ranges (works with any gold price)
How to Use
This indicator helps gold traders identify potential support and resistance zones. Watch for price reactions at these levels for potential trade entries, exits, or stop placement. The thicker lines (68, 32, 10) often represent more significant price levels where stronger reactions may occur.
Perfect for both day traders and swing traders looking to optimize their gold trading strategy with key price levels.
Gold Friday Anomaly StrategyThis script implements the " Gold Friday Anomaly Strategy ," a well-known historical trading strategy that leverages the gold market's behavior from Thursday evening to Friday close. It is a backtesting-focused strategy designed to assess the historical performance of this pattern. Traders use this anomaly as it captures a recurring market tendency observed over the years.
What It Does:
Entry Condition: The strategy enters a long position at the beginning of the Friday trading session (Thursday evening close) within the defined backtesting period.
Exit Condition: Friday evening close.
Backtesting Controls: Allows users to set custom backtesting periods to evaluate strategy performance over specific date ranges.
Key Features:
Custom Backtest Periods: Easily configurable inputs to set the start and end date of the backtesting range.
Fixed Slippage and Commission Settings: Ensures realistic simulation of trading conditions.
Process Orders on Close: Backtesting is optimized by processing orders at the bar's close.
Important Notes:
Backtesting Only: This script is intended purely for backtesting purposes. Past performance is not indicative of future results.
Live Trading Recommendations: For live trading, it is highly recommended to use limit orders instead of market orders, especially during evening sessions, as market order slippage can be significant.
Default Settings:
Entry size: 10% of equity per trade.
Slippage: 1 tick.
Commission: 0.05% per trade.

Thai Gold 96.5%Gold 96.5% Price Display (Test Version)
This Pine Script indicator is a test version designed to display the current price of Thai gold (96.5%) in a customizable table on your TradingView chart. The script calculates the gold price using the latest values for XAU/USD and USD/THB, reflecting the price of gold in Thai Baht (THB) with a purity adjustment.
Features:
- Price Calculation: Computes the Thai gold price by multiplying the XAU/USD price with USD/THB and adjusting for gold purity (0.49 * 0.965).
- Customizable Display: Adjust text size, text color, background color, and table position (Top Right, Top Left, Bottom Right, Bottom Left).
- Formatted Output: Gold price is formatted with commas for better readability.
Inputs:
- Text Size: Choose from tiny, small, normal, large, or huge.
- Text Color: Customize the text color.
- Background Color: Select a background color for the table.
- Table Position: Choose the table position on the chart.
Usage:
Add this test script to your TradingView chart to see the current Thai gold price displayed in a table format. This version is for testing purposes and may be updated based on feedback.
Feel free to test and customize the script further!