Lumiere’s Indicator BundleThe Lumiere’s Indicator Bundle combines three of Lumiere’s most used tools into one script:
🔹 BOS Mark-out – Marks Breaks of Structure with clear bullish/bearish levels and optional alerts.
🔹 Liquidity Mark-ou t – Draws significant swing highs/lows and automatically removes them once swept.
🔹 Trading Session High/Low – Tracks Asia, London, and New York session ranges with customizable timezone.
Why this bundle?
I made this bundle so everyone can run all my indicators at once without having to pick and choose between them or worry about chart space limits.
Instead of loading 3 separate indicators, this package gives you everything in one place. You can toggle each module (BOS, Liquidity, Sessions) on or off from the settings. All inputs are kept clean and organized in their own sections for easy adjustments.
What to expect
BOS lines always plotted on top for maximum clarity.
Liquidity highs/lows update in real time and get removed when taken out.
Session ranges show the active session’s high/low and can mark sweeps after the session closes.
Default timezone is New York (UTC-4), but you can switch to any TradingView-supported timezone.
BOS alerts are included, so you’ll never miss a structural break.
Highandlow

SmartPlusSmartPlus
Overview
The SmartPlus indicator is a complete framework for intraday traders. It combines key market reference points (VWAP, moving averages, and the first 15-minute high/low range) with predictive levels based on historical daily moves. Together, these elements allow traders to build directional bias, spot breakouts, and manage risk throughout the session.
Key Features
1. VWAP (Volume-Weighted Average Price)
- Plots the intraday VWAP in real time.
- VWAP acts as a central “fair value” reference point for institutional order flow.
- Price trading above VWAP generally suggests bullish bias, while below VWAP leans bearish.
2. Exponential Moving Averages (EMAs)
- Two configurable EMAs are included:
- Fast EMA (default: 21 periods)
- Slow EMA (default: 34 periods)
- Each EMA is plotted with a single, user-selectable color for clarity.
- Crossovers or alignment between price, VWAP, and EMAs help define market structure.
3. Smart Bar Coloring
- Candles automatically change color when conditions align:
- Bull Zone: Price above VWAP, Fast EMA, and Slow EMA.
- Bear Zone: Price below VWAP, Fast EMA, and Slow EMA.
- Fluorescent bar coloring helps highlight momentum zones visually without additional analysis.
4. First 15-Minute High/Low/Mid (Automatic)
- Automatically detects the first 15 minutes of each new trading day (no manual input required).
- Plots horizontal lines for:
- First 15-Minute High (green)
- First 15-Minute Low (red)
- Midpoint of that range (gray)
- Once the initial 15-minute window ends, these levels remain projected throughout the session as breakout or support/resistance zones.
- Alerts trigger when price breaks above the high or below the low after the window.
5. Daily Support/Resistance Forecast
- Uses a rolling lookback of recent daily ranges (default: 126 days).
- Tracks average up moves and down moves from the daily open.
- Optionally incorporates standard deviation for wider confidence bands.
- Plots forecast levels above/below the current day’s open for reference.
Trading Logic (How to Use)
- Bullish Bias:
- Price is above VWAP, above both EMAs, and ideally above the first 15-minute high.
- This setup suggests trend continuation or breakout opportunities on the long side.
- Bearish Bias:
- Price is below VWAP, below both EMAs, and ideally below the first 15-minute low.
- This setup suggests downward pressure or breakout opportunities on the short side.
- Neutral / Caution Zone:
- Price caught between VWAP, EMAs, or inside the 15-minute range often signals indecision.
- Best to wait for confirmation or breakout before committing to trades.
Expectations After Using It
- The script provides context and structure, not trading signals.
- It highlights where price is relative to meaningful market levels so traders can act with greater confidence.
- Combining VWAP, EMAs, and the 15-minute breakout framework helps traders stay aligned with the market’s natural rhythm.
Disclaimer
This script is a tool for market analysis and educational purposes only.
It does not constitute financial advice, trading recommendations, or guaranteed profitability.
Markets are inherently risky, and past patterns do not ensure future results.
Always combine this tool with sound risk management, personal research, and professional guidance before making any trading decisions.

Trading session High/Low (Lumiere)Trading session High/Low
What it does:
Plots the High and Low for each session (Asia, London, New York) as horizontal zones that “snap” to the first true extreme of the session and then extend right.
Key points:
Snap‑to‑extreme only: Lines don’t draw at the open; they appear only once price makes a new session high or low, and anchor exactly at that bar.
Persistent until next session: Once drawn, each session’s lines stay on the chart after the session ends, and are cleared only when that same session next opens (or when you hide it).
Three configurable sessions:
Asia: 18:00–03:00 (UTC‑4)
London: 03:00–09:30 (UTC‑4)
New York: 09:30–16:00 (UTC‑4)
Customizable appearance:
You can toggle each session on/off, choose its color, and set line width.
The time that is already set on the different sessions is based on the standard session open/close. If you want to change it, it will refer to the NY time, UTC -4.
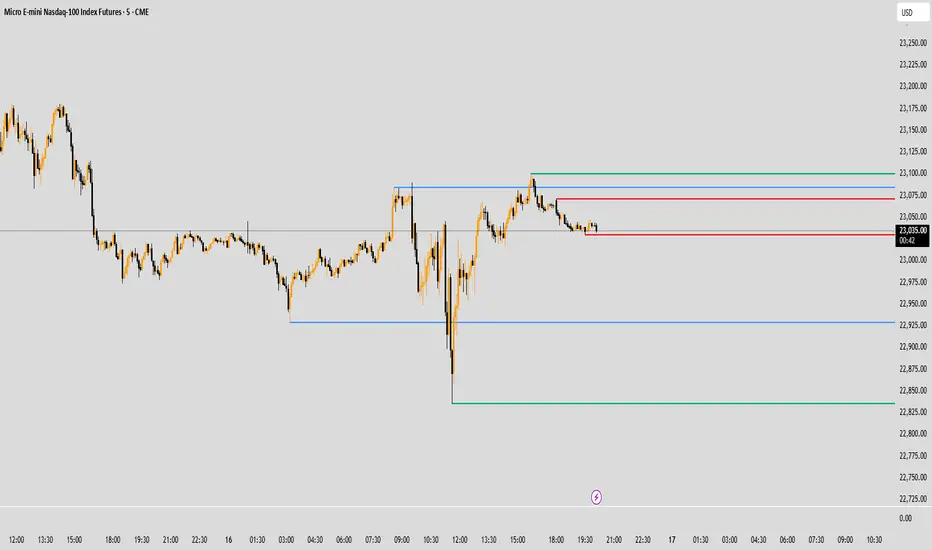
Intraday LevelsWhat it shows:
This indicator is useful for day trading, where it will track and display you important price levels which includes:
Premarket Low (PML)
Premarket High (PMH)
Previous Day Low (PDL)
Previous Day High (PDH)
Previous Day Close (PDC)
After Hours Low (AHL)
After Hours High (AHH)
Day Low (DL)
Day High (DH)
The price level lines and labels will automatically adjust itself as the price moves, eliminating the need of manually having to adjusting these levels.
How to use it:
At these levels it can act as important support resistance points during the day and can often serve as a important pivot point for any ticker. You can expect price rejection or bounce when the price approaches these levels.
Key settings:
For each of the levels, user can adjust in the settings menu:
Line Colour
Line Thickness
Line Style
Label Text
Price Labelling on Label
Label Location (Offset from current bar)
Ability to turn on/off the price level and label
Display levels for either all days or on the day

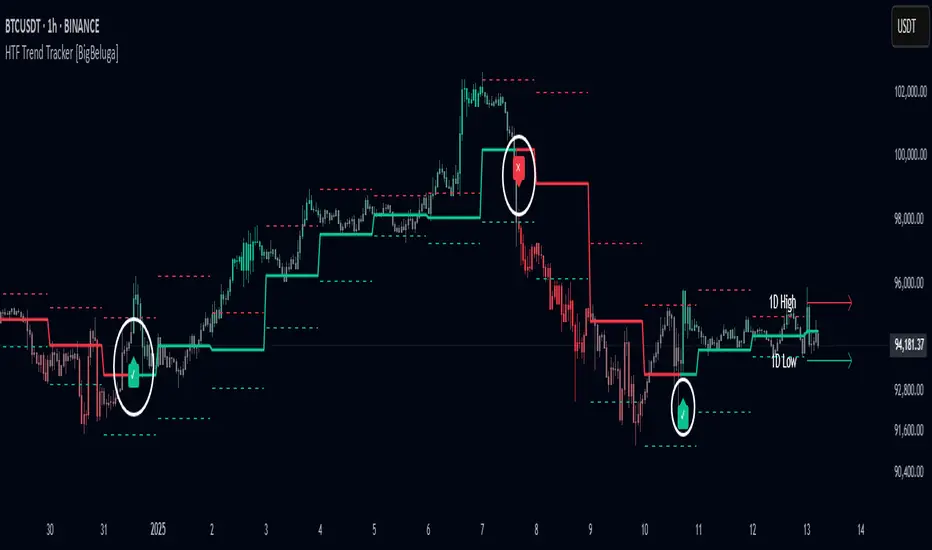
HTF Trend Tracker [BigBeluga]HTF Trend Tracker is a higher timeframe (HTF) trend tracking indicator designed to help traders identify significant trends, key levels, and market sentiment. The indicator dynamically adapts to the current price action, using HTF highs and lows to display trend direction and strength with detailed visuals.
🔵 Key Features:
Dynamic Trend Detection:
Uptrend is identified when the price closes above the HTF high.
Downtrend is detected when the price closes below the HTF low.
Midline changes color dynamically based on the trend direction:
Bullish Green: Indicates an uptrend.
Bearish Red: Indicates a downtrend.
Historical and Active HTF Levels:
Historic HTF highs and lows are displayed as dotted lines.
Current active HTF high and low levels are shown as solid lines.
Timeframe labels (e.g., "1D High" or "1D Low") mark the active levels for clarity.
Trend Change Signals:
A green checkmark (✓) is plotted when an uptrend starts.
A red cross (✕) appears when a downtrend begins.
Trend-Based Candle Coloring:
Candle colors change dynamically based on the trend and the price's distance from the midline:
Intense Bullish Green: Price is far above the midline during an uptrend.
Intense Bearish Red: Price is far below the midline during a downtrend.
Neutral Gray: Price is near the midline.
Users can customize the colors to suit their preferences.
🔵 Usage:
Identify uptrends and downtrends using the midline's color and the position of the close relative to the HTF levels.
Use solid lines and timeframe labels to track current HTF high and low levels.
Observe dotted lines for historical HTF levels to understand past price behavior.
Watch for checkmark (✓) and cross (✕) signals to spot trend changes and key market shifts.
Monitor candle colors to gauge trend intensity and proximity to the midline:
Intense colors signal strong trends, while neutral gray indicates consolidation near the midline.
HTF Trend Tracker is an essential tool for traders aiming to follow higher timeframe trends, identify key levels, and make data-driven decisions based on price dynamics and trend strength. Its customizable features allow for flexible integration into any trading strategy.
Fibonacci Pivot Points & Previous D,W&M Highs/LowsIndicator Overview
This indicator combines Fibonacci Pivot Points with previous high and low levels for different timeframes (day, week, month). It plots these levels on the chart to provide traders with key support and resistance areas, making it easier to identify potential trading opportunities.
Features
Fibonacci Pivot Points:
The indicator calculates pivot points based on the high, low, and close prices.
Fibonacci levels are used to determine support (S1, S2, S3, S4, S5) and resistance (R1, R2, R3, R4, R5) levels.
Users can customize the Fibonacci levels for both support and resistance.
Previous Highs and Lows:
The indicator plots previous day, week, and month high and low levels.
Each of these lines can be customized in terms of visibility, color, and width.
This helps traders to see key historical levels that might act as support or resistance in the future.
Inputs and Customization:
Fibonacci Time Frame:
Users can select the timeframe for calculating the pivot points (Daily, Weekly, Monthly).
Fibonacci Levels:
Customizable input fields for each Fibonacci level (R1, R2, R3, R4, R5, S1, S2, S3, S4, S5).
Previous High/Low Lines:
Day Lines:
Options to show or hide previous day's high/low lines.
Customizable color and width for these lines.
Week Lines:
Options to show or hide previous week's high/low lines.
Customizable color and width for these lines.
Month Lines:
Options to show or hide previous month's high/low lines.
Customizable color and width for these lines.
Technical Calculations:
Fibonacci Pivot Points:
Calculated as:
pp = (High + Low + Close) / 3
S1 = pp - ((High - Low) * Fibonacci Level)
R1 = pp + ((High - Low) * Fibonacci Level)
Previous High/Low Levels:
Uses request.security to fetch previous high and low values for the selected timeframe.
Plotted using line.new to draw lines across the chart.
Plotting:
The indicator plots Fibonacci Pivot Points and previous high/low lines on the chart, using distinct colors for each level.
Customizable transparency and linewidths make it easier to visually interpret the levels.
This indicator is particularly useful for traders who rely on technical analysis to identify key support and resistance levels, offering a blend of historical data and Fibonacci-based predictions.
Feel free to ask if you have any specific questions or need further adjustments!

Opening Range & Daily and Weekly PivotsThis script is for a combination of two indicators: an Opening Range Breakout (ORB) indicator and a daily/weekly high/low pivot indicator. The ORB indicator displays the opening range (the high and low of the first X minutes of the trading day, where X is a user-defined parameter) as two lines on the chart. If the price closes above the ORB high, the script triggers an alert with the message "Price has broken above the opening range." Similarly, if the price closes below the ORB low, the script triggers an alert with the message "Price has broken below the opening range."
The daily/weekly high/low pivot indicator plots the previous day's high and low as well as the previous week's high and low. If the current price closes above yesterday's high or last week's high, the script triggers an alert with the messages "We are now trading higher than the previous daily high" and "We are now trading higher than the last week high", respectively. If the current price closes below yesterday's low or last week's low, the script triggers an alert with the messages "We are now trading lower than the previous daily low" and "We are now trading lower than the last week low", respectively.
In addition to the visual representation on the chart, the script also triggers alerts when the price crosses any of these levels. These alerts are intended to help traders make decisions about entering or exiting trades based on the price action relative to key levels of support and resistance.
