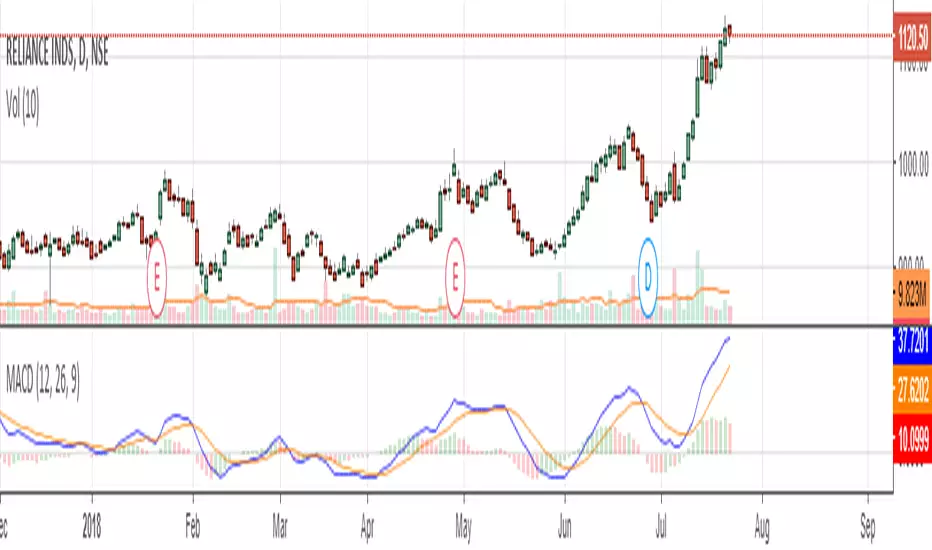
Histogram
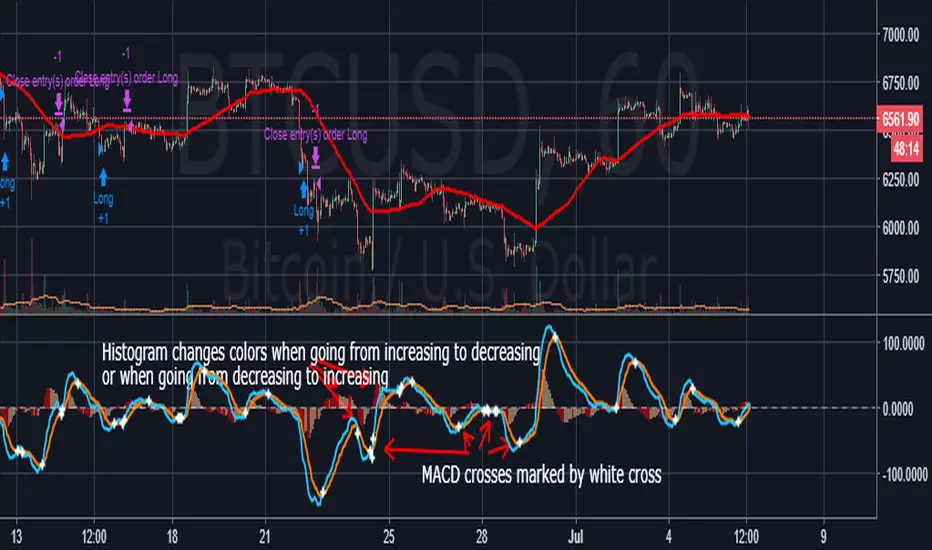
Better MACD with clearer cross and histogram signalsSimple but much needed visual improvements to the default MACD script. First, every time the MACD and signal cross, a white cross is placed on he chart, which lets you quickly identify the crosses. Second, whenever the histogram goes from increasing to decreasing or from increasing to decreasing, a color change occurs. Colors can be customized under "Style" tab under settings.
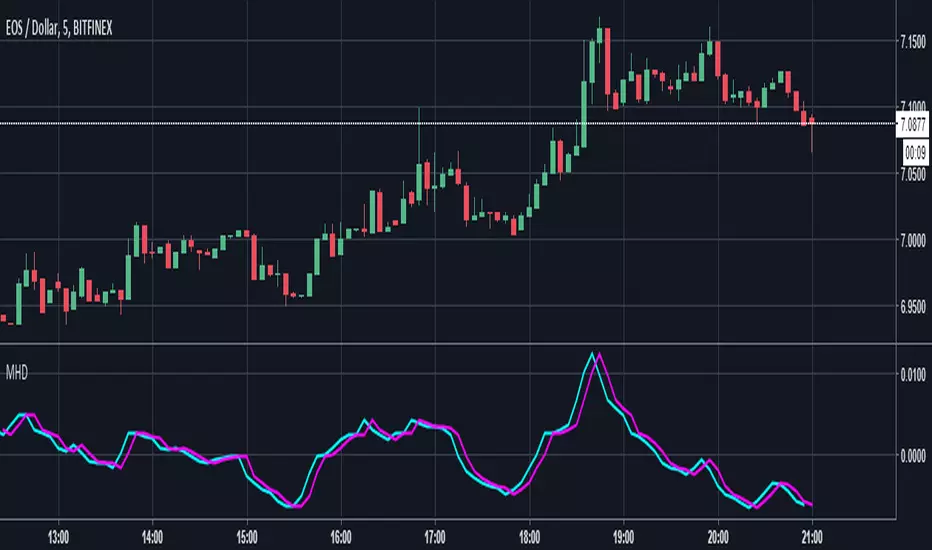
Laguerre PPO 4C4 Colored Laguerre PPO
lime = positive rising
green = positive descending
red = positive descending
maroon = positive rising
Enjoy :)
www.tradingview.com(PPO)
The Laguerre Filter is a smoothing filter based on Laguerre polynomials.

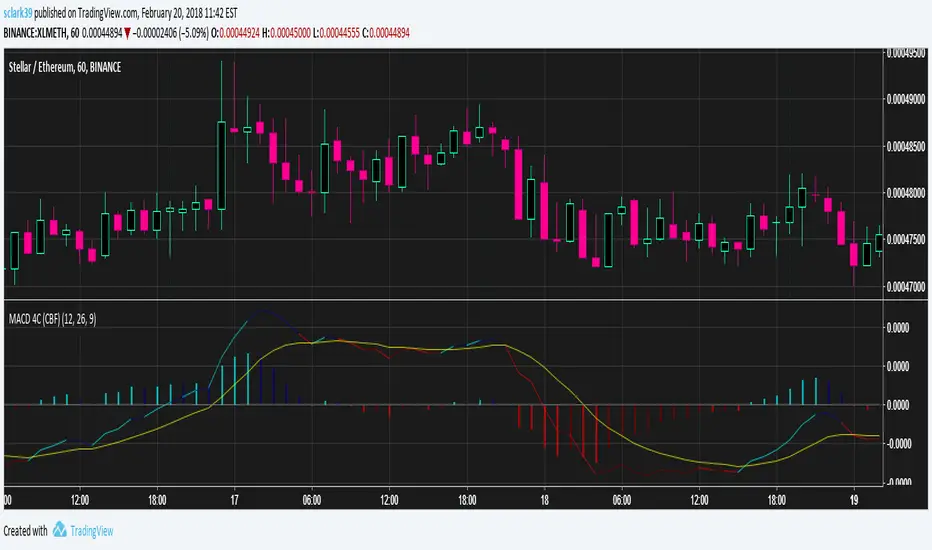
MACD (4 Color, Color-Blind Friendly)Working MACD Histogram which colors bars based on the slope from the previous. The default colors will work for both Deuteranopia and Protonopia color-blind people but can be modified.
There is a bug with 'MACD 4C' by vkno422 + signal line - squattter and 'MACD for colour blind people' by cfhrtd in that it draws the MACD line itself as a histogram, rather than drawing an MACD histogram (which is the MACD line - signal line).
Bad indicators that this should replace:
Price and EMA Difference Customizable [Requested script]
Easy options, you can toggle the lines and other things. Even turn of the histogram.

TRIX Histogram R1-12 by JustUncleLCreated by request.
Description:
This study is an implementation of the Standard TRIX indicator (a momentum oscillator), shown in coloured histogram format by default, with optional Bar colouring of TRIX zero cross overs. Other options include showing TRIX as a line graph instead of histogram and an optional TRIX signal line with difference histogram (to highlight signal line crosses).
References:
forex-indicators.net
"TRIX MA" by munkeefonix

Pine Script Tutorial #4Welcome to Pine Script Tutorial #4
This is more complex than the previous 3 tutorials. This one builds upon the first 3 tutorials.
What does this code do?: It plots on a histogram (at the bottom), the difference between closest round number and the close. So for example 84 -close = 16 pips. It shows the 16 pips on the histogram.
First off, it is actually Two studies on this graph, not one. I wanted the histogram at the bottom and round number indicator to overlay on the graph. There is no code within Pine Script that lets you do that within one script.
Secondly, there is no code that lets you spit out number on the graph, that is why I used histogram, initially I wanted it to tell me 16 pips in writing but no way of doing that.
In order to replicate the graph you have to first plot the rounding formula as overlay. Thean take out the overlay and plot te histogram.
I got the rounding formula from one of the coders here and simplified it. Just search round.
Hope this helps,
Feel free to comment.

Bill Williams Divergent BarsBill William Bull/Bear divergent bars
See: Book, Trading Chaos by Bill Williams
Coded by polyclick
A bullish (green) divergent bar, signals a trend switch from bear -> bull
-> The current bar has a lower low than the previous bar, but closes in the upper half of the candle.
-> This means the bulls are pushing from below and are trying to take over, potentially resulting in a trend switch to bullish.
-> We also check if this bar is below the three alligator lines to avoid false positives.
A bearish (red) divergent bar, signals a trend switch from bull -> bear
-> The current bar has a higher high than the previous bar, but closes in the lower half of the candle.
-> This means the bears are pushing the price down and are taking over, potentially resulting in a trend switch to bearish.
-> We also check if this bar is above the three alligator lines to avoid false positives.
Best used in combination with the Bill Williams Alligator indicator.

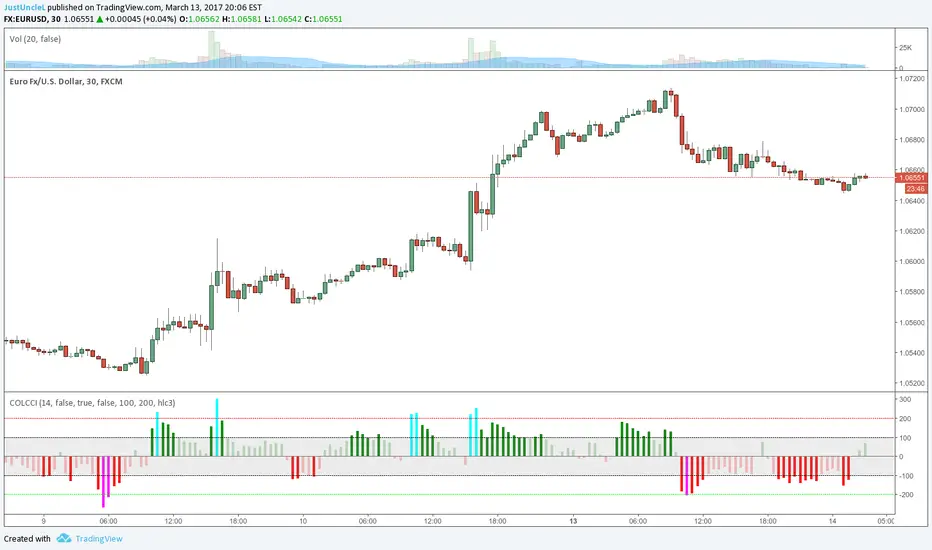
Coloured CCI Histogram V2.0 by JustUncleLThis is a requested update of this script. This is a standard CCI indicator that shows a coloured histogram of important CCI levels, giving a good visual of the CCI levels. Added to this version is an extra coloured level +/-200 and an option to calculate CCI with EMA instead of the standard SMA.
CCI LEVELS:
Light Green - Greater than 0 and less than 100.
Green - Greater than 100 and less than 200.
Aqua - Greater than 200.
Light Red - Less than 0 and greater than -100.
Red - Less than -100 and greater than -200.
Magenta - Less than -200.
If you would like different colour arrangement just change them in the "Style" settings of the indicator.
Stochastic HistogramLast Edited: 5/19/16
Description:
This is a basic Stochastic histogram that essentially shows when the indicator
is either above or below the 50 level. Colors can be customized to your liking.
Length and smoothing factor can be adjusted as well. Defaults are 14 (Length)
and 3 (Smoothing Factor).
NOTE: The above chart contains the built-in stochastic indicator for comparison.

Patrick's Buy/Sell HistogramSimply look for a 12 point long bar and that's a perfect time to buy the security

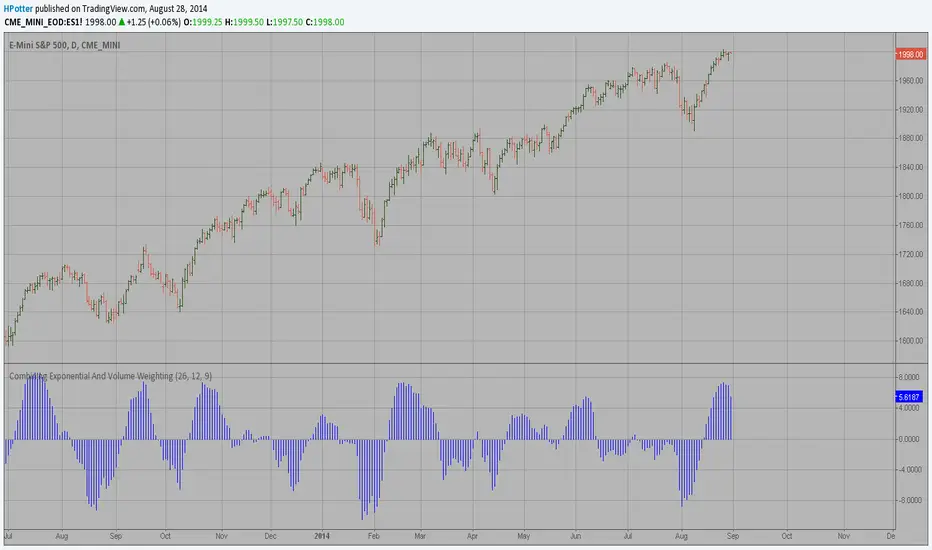
The Volume-Weighted MACD HistogramThe related article is copyrighted material from Stocks & Commodities 2009 Oct
Momentum HistogramThis creates a replica of relative distance from the moving averages, a good way to measure the strength, divergences etc.... short, mid and long term waves.
List of All my Indicators - www.tradingview.com
