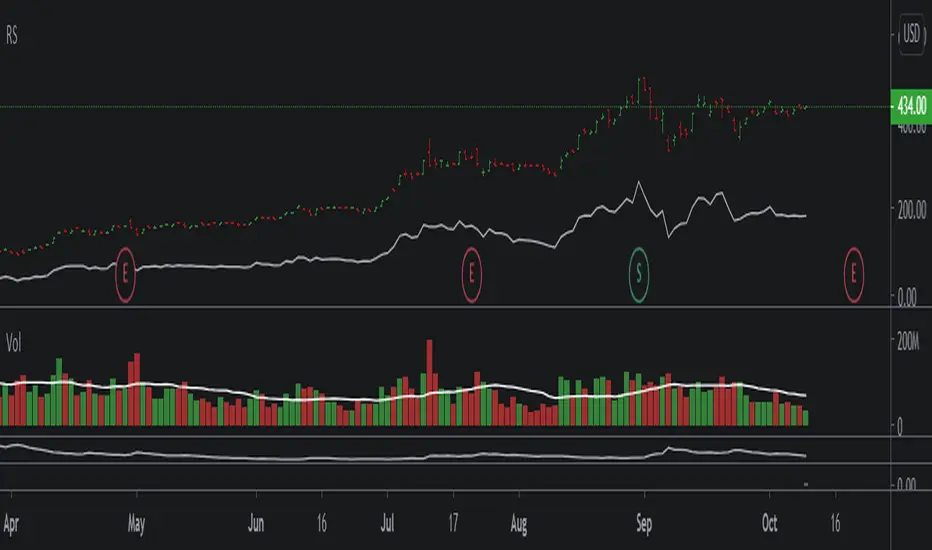
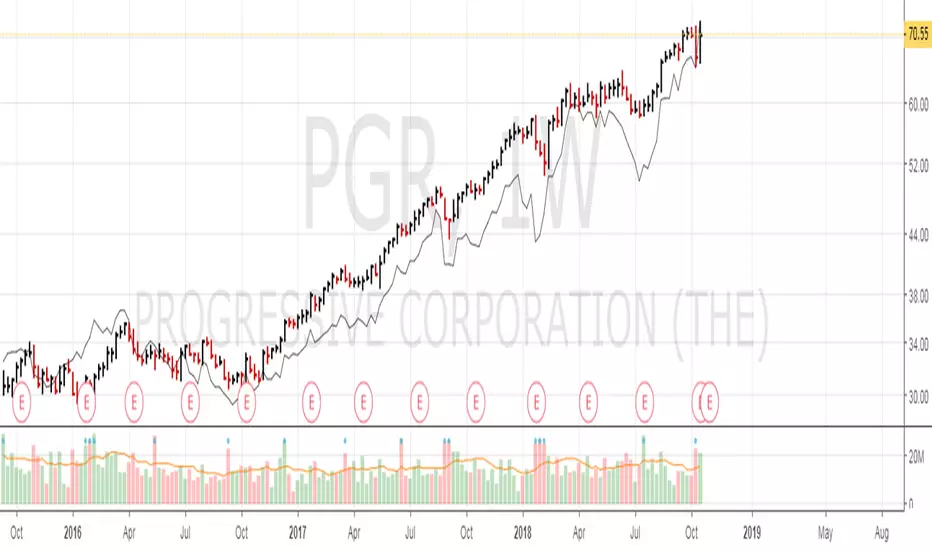
Relative Strength OverlayThis is the original script to my other Relative Strength indicator (link below) It provides a graphical overlay of the Relative Strength, compared to the QLD, a Nasdaq x2 ETF.
You can not use the value to compare to other stocks or securities, as it is scaled based on the price (so it can be used as an overlay).
If you want a value which you can use to compare with other stocks, please see my other Relative Strength indicator.
Ibd
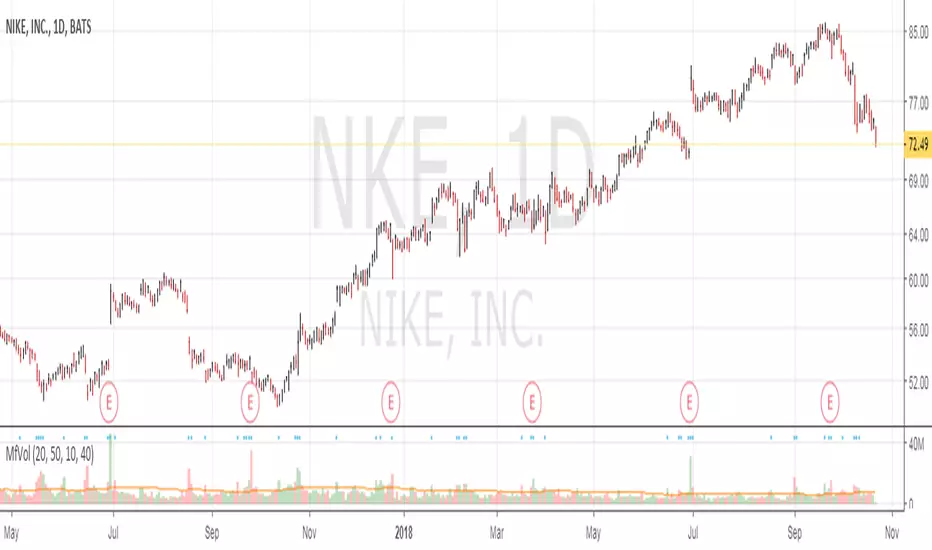
Relative StrengthA relative strength overlay, similar to that of IBD shown on Marketsmith.
The value is not from 0-100, it is compared with the Nasdaq x2 ETF, QLD. Therefore, if greater than zero it will give you a good indication that the stock has a very good relative strength.
Feel free to change the comparison ETF to one of your choosing.

Upside ReversalsUpside reversal is noticed when a stock first dips below the prior week's low, then rallies in heavy trade to close either with a gain or with a much-reduced loss. Upside reversal can be identified with following condition:
A stock falls in heavy volume but bounces back, ending up for the day or week
OR
A stock falls in heavy volume but at least it finishes in the upper 60% of its trading range for the day or week
Upside reversal can be applied on day or week but if it is on weekly, it is a strong indication that institutions may be pumping money as they think stock is a bargain. This script is the approximate conversion of Richard Moglen's TC2000 scripts in TradingView. Search YouTube for his video on 'Upside Reversal'
This indicator, evaluates following conditions and print the arrow down label with percentage of reversal
Stoc(1,1) should be higher than 60%;
AND today's close is above 60% range;
AND today's low is lesser than yesterday;
AND Stoc(5,2,1) is lesser than 65
You can change inputs from Stoc(5,2,1) to Stoc(10,4,1) based on your need.
NOTE:
1) I still see some false positives so be aware of it.
2) It is absolutely possible to have an Upside reversal on down trend also. Please look for confirmation following day on the trend before act on it.
3) Volume level is not validated in the indicator, so you need to include it in the chart and check it.
4) This is still an experimental script & published for educational purpose only

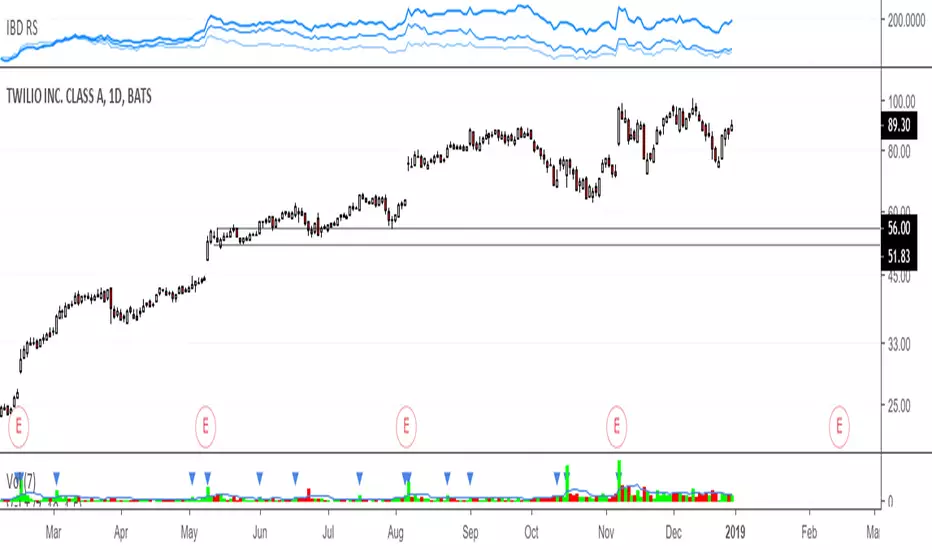
IBD RS, Relative strengthRelative Strength calculation of 3 time periods: 12 months, 6 months and 3 months.
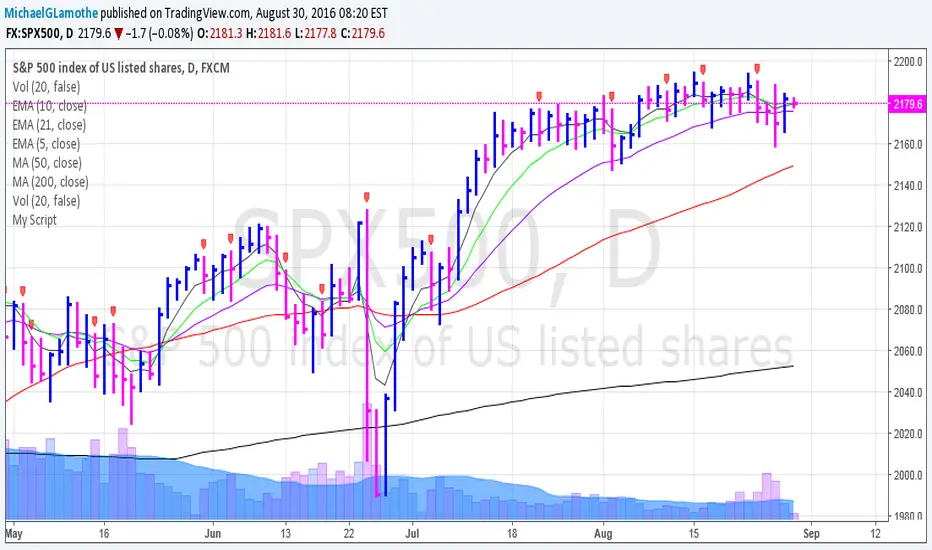
Multi Time Frame Moving AverageThis is a standard Moving Average indicator with options to allow different configuration of daily and week length. All other chart time frame (besides daily and weekly) will be using the default length value.
Default, daily and week length are configurable. Default value of MA source is set to closing price, configurable as well. Here are the default value, Default = 9, Daily length = 50, Weekly length = 10, Source = close.

Multi Time Frame VolumeThis is a standard Volume indicator with options to allow different configurable daily and weekly MA length. All other chart time frame (besides daily and weekly) will be using the default MA length value.
On top of the configurable daily and weekly MA length, a dot is displayed for volume x% > current MA length. This is to indicate institutional buying when volume is above certain %.
Default, daily and weekly MA length are configurable. % of increase above the MA length is also configurable. Here are the default value, Default = 20, Daily MA length = 50, Weekly MA length = 10, Institutional Purchase (blue dot) = 40%.
Relative Strength LineRelative Strength Line compares equity's price performance with S&P 500 (default). The indicator will retrieve current equity value comparing it with S&P 500 equivalent time frame.
S&P 500 is set as the default index for comparison. This value can be change to any equity available in the market, located at the format settings of the indicator.
IBD Relative strengtHThis code is to replicate the relative strength indicator as used on investors.com (on lists like the IBD 50, big cap 20 etc).
Let me know if any issues / any updates wanted.

Auto Flag Distribution DaysThis script automatically flags distribution days. Distribution days are defined as any day that is down -0.2% or greater on heavier volume than the previous day. Distribution days are counted on the major indexes (S&P 500, NASDAQ, NYSE, etc...) within the CANSLIM methodology.