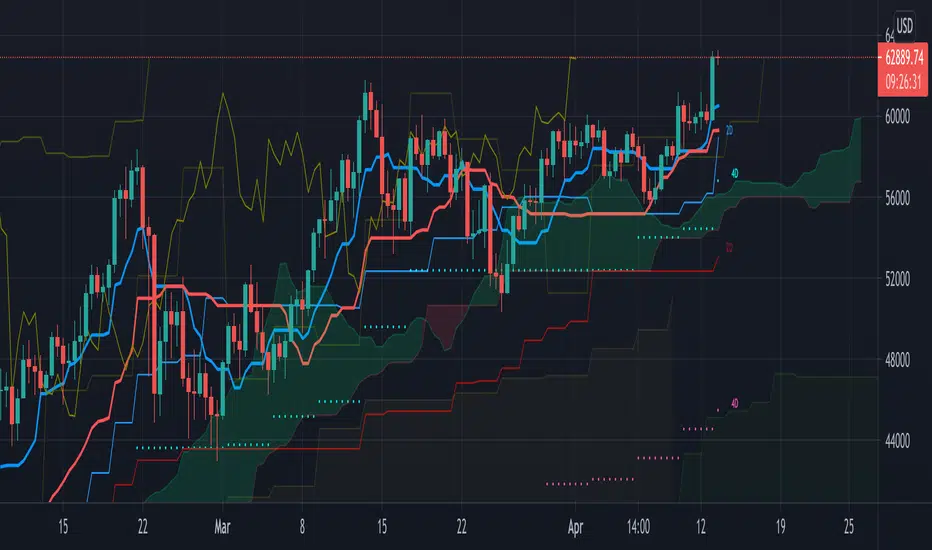
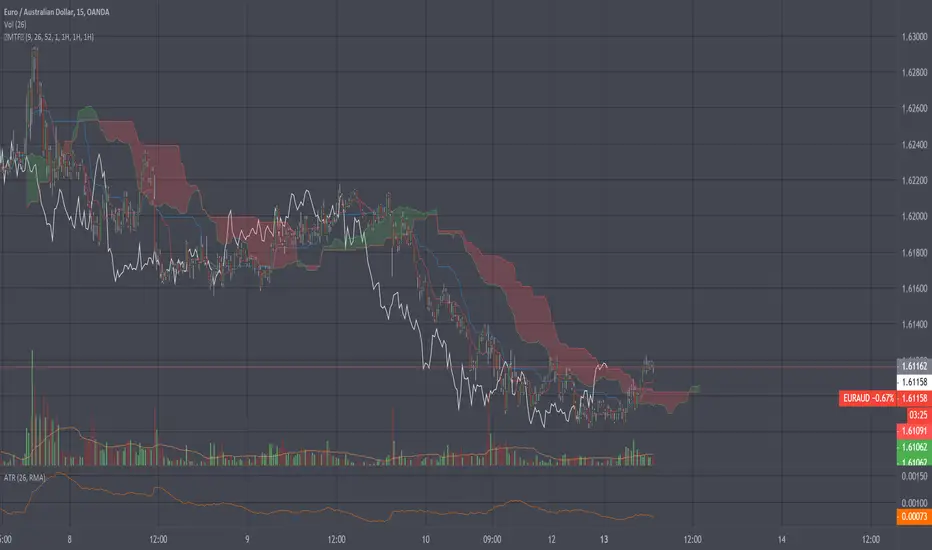
MTF Ichimoku CloudHere is my take on Ichimoku Cloud, Multiple Time Frames, based on the
most excellent work of "PineCoders" (MTF Selection Framework functions)!
The big advantage is that on 1 image you can easily see where
price is compared to Ichimoku Cloud patterns (each of different Time Frames).
This gives a lot of Support and Resistance area's!
I restricted the amount of MTF's at 2, more is just too messy
To make it more clear:
- Conversion line and Baseline in present timeframe : thick line
- Conversion line and Baseline in Higher Time Frame (HTF 1) : thin line
- Conversion line and Baseline in Higher Time Frame (HTF 2) : line with circles
All lines has labels at the right of the line with corresponding Time Frame
Since some prefer different settings with higher Time Frames,
each period in each Time Frame can be changed
The Time Frames itself can be chosen:
- or a multiple of present Time Frame
- or a fixed chosen Time Frame
Thanks!
Ichimoku Cloud
Ichimoku Timeframe - [Silver-Wong]"Ichi Time" displays an Ichimoku indicator from another timeframe.
IE: Displays Ichimoku Daily while you are on the 4H chart.
Available timeframes:
- 1H
- 4H
- 12H
- Daily
- Weekly

Ichimoku MTFIchimoku MTF
This is two time frame indicator: Live and second as a default multi time frame for 1h
MTF Affected:
Kumo
Tenkan Sen
Kijun Sen
Chikou Span
Good Luck

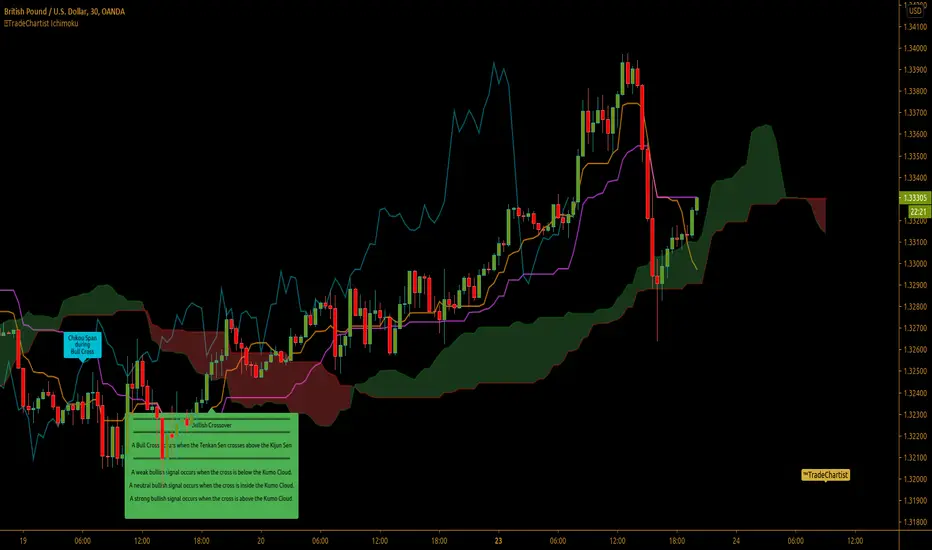
™TradeChartist - Show and Tell - Ichimoku Cloud™TradeChartist Show and Tell - Ichimoku Cloud is a free and easy to use script that helps anyone learn and understand the Ichimoku cloud by using the 'Show and Tell' option from the indicator settings and by choosing the Ichimoku component/Signal from the dropdown box. For individuals new to Ichimoku Cloud , Show and Tell option will help explain the components and signals of Ichimoku Cloud on the chart without having to navigate away from price action, thus making it easier to learn and understand Ichimoku cloud with respect to chart price action on the corresponding time frame.
The indicator automatically detects cryptocurrencies as it uses different settings specific to cryptocurrencies market - (20,60,120,30) respectively as opposed to classic - (9,26,52,26).
When 'Show and Tell' is unchecked from indicator settings, the script detects signals and important Ichimoku events like Bull/Bear crosses, Bullish/Bearish Kumo Twists, Bullish/Bearish Kumo Breakouts etc and plots labels on chart. To turn off this feature, just uncheck 'Labels' from the styles tab under the indicator settings.
This is a free to use indicator. Give a thumbs up or leave a comment if you like the script.
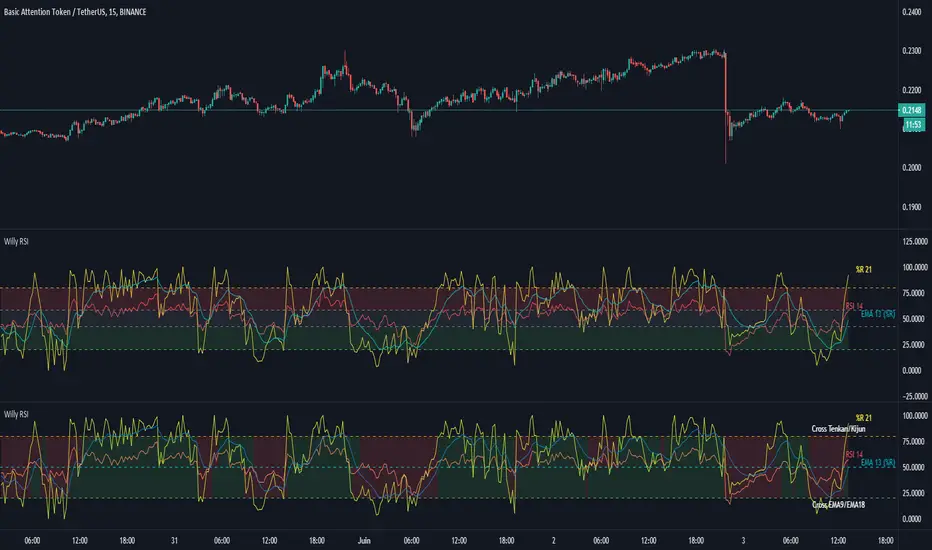
Williams %R + RSI + EMA - [Silver-Wong]
Williams %R + EMA + RSI
Un seul indicateur avec :
- William %R
- RSI
- EMA
- Une ligne médiane
- Les étiquettes des indicateurs
BERLIN CandlesA problem with Heikin Ashi is that while it gives you a great overview of overall direction, it is rarely possible to use it as a replacement for normal japanese
candlesticks. The reason for this is that actual price data is lost, since the candles are more akin to a moving average than a different way to see price action. Also, with Heikin Ashi, most of the actual price action is lost, because the candles can be bigger than the high and low of the underlying japanese candlestick.
With BERLIN Candles I have tried to fix that problem. By using a smoothed out version of the previous Heikin Ashi candle close as the current BERLIN Candle open, the high and low of the actual japanese candlestick for the high and low of the BERLIN Candle, and the current Heikin Ashi close as the BERLIN Candle close, while setting hard limits for BERLIN Candle open and close values so that they can never exceed the high and low of the underlying japanese candlestick.
One problem still persists though. The actual current price data is lost. However, the BERLIN Candles have solved this by adding a fifth part to the candles. The close of the underlying japanese candlesticks are indicated with a plus-sign. This way, actual price data is never lost, while keeping all of the other benefits of this type of candles.
A few added bonuses:
The addition of the 14 period ATR at the latest candle
The baseline from Ichimoku is included as an option
The 14 period ATR value of each candle can be seen in the indicator data as
the orange value

Commander IndicatorCommander Multi Indicator
included:
Pioneer EMA
Commander 3MA with MAs cross signal
Double Ichimoku - Kijun Base-Line (26) and Kijun Commander Moving (103)
Parabolic Sar
Bollinger Band
3-Stroke Movings

Pivot Boss 4 EMA + BB + Parabolic SAR + IchimokuA combination of a few of my favorite indicators.
1) Pivot Boss 4 EMA
2) Bollinger Bands
3) Parabolic SAR
4) Ichimoku Cloud
All credit to original authors.

Ichimoku Cloud by Wei V1.3Label Sanyaku events, green for Gold and red for dead
- a: Tenkan sen Kijun Sen cross
- b: Chiko Span Cross Candle
- c: Kumo breakout
I also added a input option to draw chiko span differently. Original Chiko to draw Chiko as originally designed, and false to draw price at 25 bars earlier at current as "chiko span"
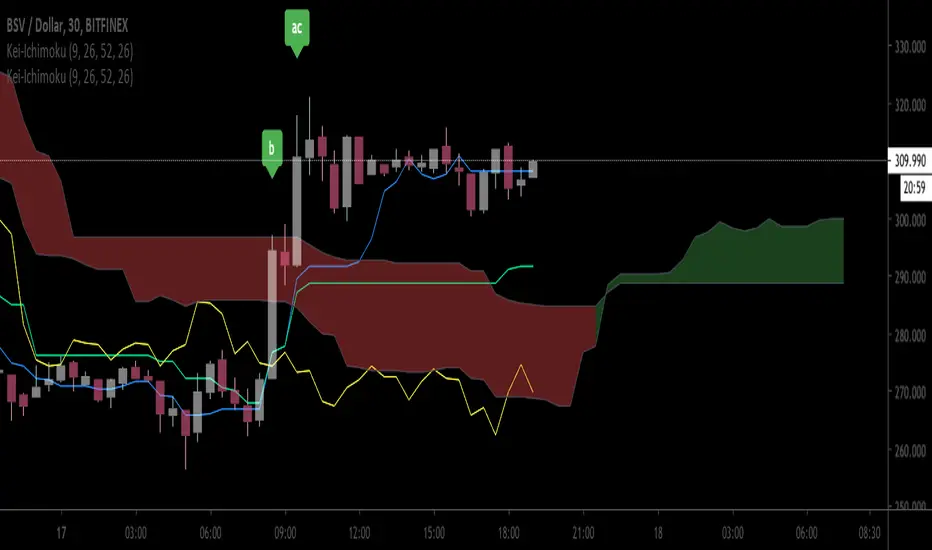
Ichimoku Cloud betaThis is a test version of Ichimoku, instead of plot chiko span backward 26 bars, it draws price at 26 bars backward at the current bar.
Best Ichimoku ScreenerHello traders
Continuing deeper and stronger with the screeners' educational series one more time
I - Concept
This screener detects whether the price goes above, below or stays in between the Ichimoku cloud
II - How did I set the screener
The visual signals are as follow:
- square: Above or Below
Then the colors are:
- green when above the cloud
- red when below the cloud
- orange when in the cloud
Best regards,
Dave

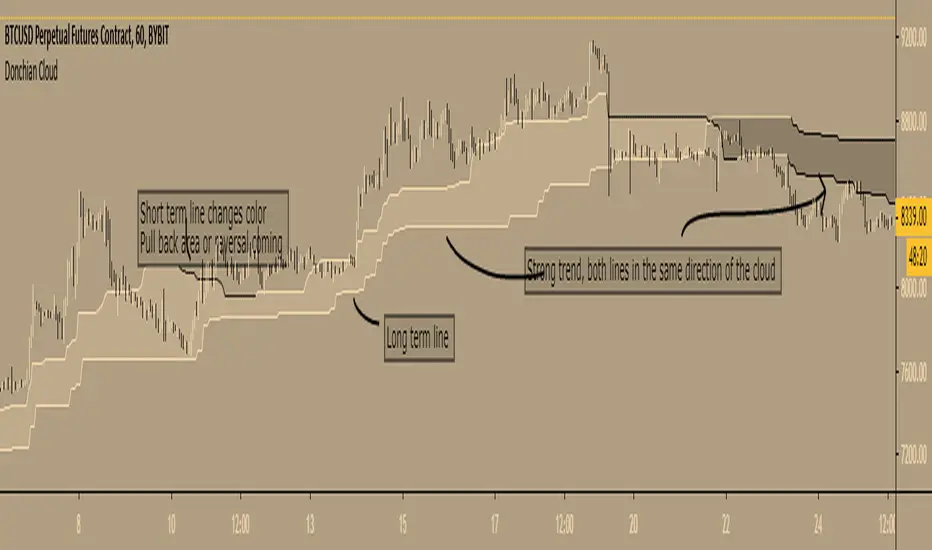
Donchian Cloud - evoA cloud based on the highest high and lowest low of a given period (Donchian), same lines used in Ichimoku Cloud (Conversion line or Base line).
Short term line is based on current time frame, long term line is based on your given multiple of current time frame.
The color of the lines is based on up or down movement.
I stole a piece of code from PineCoders for the multiple time frame:
I have not used this in my trades (yet) so I don't know how good it is, just posting because it looks nice :)
Feel free to share your settings if you can find good ones.
Commander IndicatorMulti mixed customized Indicators
double Ichimoku set (Kijun 103 and 26)
EMA 103
Pioneer EMA 1
3MA
Uber Baseline [UTS]Fixed Trend Visualization
The trend is assumed UP while candle closes are above baseline. The baseline is then colored green.
The trend is assumed DOWN while candle closes are below baseline. The baseline is painted red in this case.

Extended Ichimoku by Grzechu789This script extends capabilities of Ichimoku Indicator adding nondisplaced SSB line (serves as Kijun Sen line) and ability to see Kijun Sen line from higher (or lower) timeframes.
Other than that it's same as original Ichimoku Kinko Hyo Indicator. Enjoy!

[astropark] Ichimoku Cloud Strategy [alarms]Dear Followers,
today a Great Swing Trading Strategy , runnable on a bot , which works great on High Timeframes (1D is suggested!) but also even better on 1m Renko chart.
If you are a scalper, you will love suggested entries for fast profit. You can run it on 1h timeframe (below is not suggested) if you are used to scalp trading and close each trade whenever you feel happy (a proper trailing stop strategy is suggested anyway).
This strategy is based on the Ichimoku Cloud Indicator and let's you set a lot of settings:
works on all timeframes (but 1D and above is suggested on normal candlesticks chart)
you can run this indicator on 1m Renko chart (be sure to enable the "USING RENKO CHART? ENABLE THIS OPTION" setting)
you can use 4 kind of Ichimoku Cloud (Custom, Slow, Standard and Fast - keep only one enabled)
you can make the Ichimoku Cloud show or not
you can enable showing the possibile re-entries
you can enable an heiking ashi analysis
you can enable a trailing stop strategy ("Auto Trailing Stop Loss" and "Close Trade When Price Breaks Above the Ichimoku Cloud" are two options very much suggested to keep enabled, especially on bot trading)
you can create your own trailing stop stategy and take profit strategy
you can enable a simple take profit strategy based on RSI Overbought and Oversold levels
This strategy only trigger 1 buy or 1 sell, but if you missed the possibility to open your long or short position don't get mad, but just enable the "show re-entry signals" option, so yout will be able to enter again (be sure to always use a proper money management ).
By the way, you can set any alarms you like in order to get notified when any kind of signal is triggered (you need to use the "alarms" version for this).
Strategy results are calculated on the timeframe from May 2017 to now, so on 2 years and half, using 10000$ as initial capital and working at 1x leverage (so no leverage at all! If you like to use leverage, be sure tp use a safe option, like 3x or 5x at most in order to have liquidation price very far).
This is not the "Holy Grail", so use a proper risk management strategy.
This script will let you set all notifications you may need in order to be alerted on each triggered signals (there is also an "ALL-IN-ONE" option for free tradingview users.
The backtesting version of this indicator, which will let you backtest how the indicator will perform on any chart you may test, can be found by searching for "Ichimoku Cloud Strategy" and then choosing the astropark indicator with "red and green arrows" at the end of the name. You can find it here below too:
This is a premium indicator , so send me a private message in order to get access to this script.

Ichimoku Cloud & CandlesThe Ichimoku Cloud is a hybrid indicator combining numerous technical indicators that show support and resistance levels, as well as indicating momentum and trend direction. Ichimoku does so by taking multiple, pre-set price moving averages and plotting them on the chart in line form. It also uses these inputs to create a "cloud" which intends to forecast where the price may find support or resistance in the future. Refer to standard, and widely available, Ichimoku Cloud technical publications and/or YT videos for information on how to trade using the Ichimoku Cloud.
This indicator uses standard/default Ichimoku settings. The difference between this indicator and standard Ichimoku indicators is that the candle colors are based on price relative to the Tenkan-sen and Kijun-sen, and as such are painted lime, fuchsia and gray. Lime price candles indicate that price is in an uptrend; fuchsia candles indicate a downtrend; gray is no identifiable trend, or neutral.

Ichimoku Kinkō hyō Keizen 改MTF善The script is not finnished yet and show's an other interpretation of how it could be scripted
Step -1 is complete... Basic Ichimoku with asjutable length and editable lines colors and visibilities.
Step -2 in progress... Adding ability to une multiple Spans, sens and Kumo on higher and lower timeframe.
Your Step : Like and Share ;) have a good year 2020 !
2020-01-06 /--------/ -R.V.
Jan 06
Release Notes: The script is not finnished yet and show's an other interpretation of how it could be scripted
Step -1 is complete... Basic Ichimoku with asjutable length and editable lines colors and visibilities.
Step -2 in progress... Adding ability to une multiple Spans, sens and Kumo on higher and lower timeframe.
Your Step : Like and Share ;) have a good year 2020 !
2020-01-06 /--------/ -R.V.
Jan 07
Jan 13
Release Notes: MTF Ichimoku is on it's way !!
Jan 17
Release Notes: The script is not finnished yet and show's an interpretation of how it could be scripted
Step -1 is complete... Basic Ichimoku with asjutable length and editable lines colors and visibilities.
Step -2 in complete... Adding ability to use multiple Spans, sens and Kumo on higher timeframe.
Step -3 in progress... Creating a UNIX based function to framgments actual chart periods in subcandles or "Subprices/periods" to plot multiple Spans, sens and Kumo on LOWER timeframe.
Your Step : Like and Share ;) have a good year 2020 !
/--------Coder--------/ -R.V.

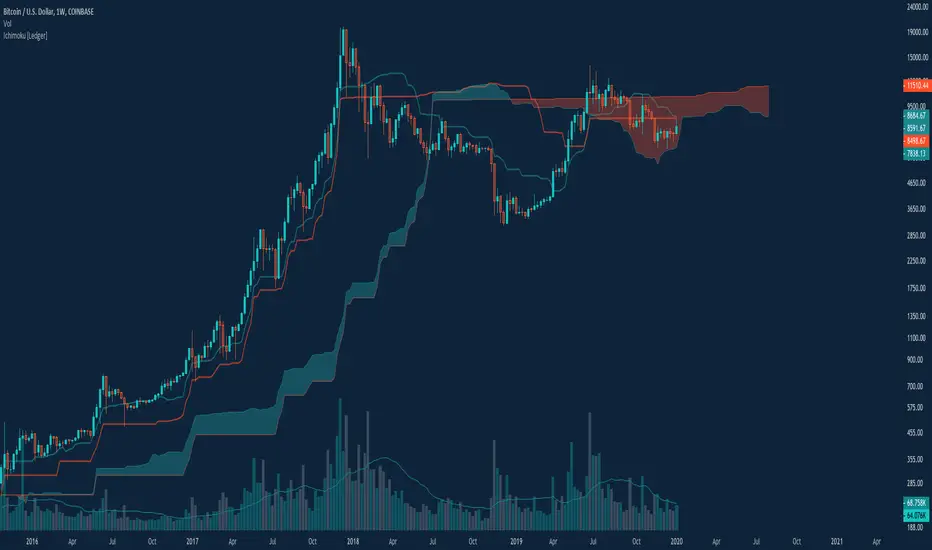
Ichimoku Cloud with Presets [Ledger]This is not too innovative, but I look at cloud setups with single and doubled settings, using both the traditional inputs for legacy markets, and "24/7" formatted inputs initially established by my friend CarpeNoctom and popularized for crypto markets. This makes those inputs a toggle that's easy to adjust. That's about it. Otherwise, it's the classic Ichimoku cloud. This is a fork of 's iteration, with my own flare and some minor adjustments. I have some ideas I would eventually like to include with this, but I've been using it this way for a long time and figure I should publish it.
Ichimoku Kinkō hyō Keizen 改善
The script is not finnished yet and show's an other interpretation of how it could be scripted
Step -1 is complete... Basic Ichimoku with asjutable length and editable lines colors and visibilities.
Step -2 in progress... Adding ability to une multiple Spans, sens and Kumo on higher and lower timeframe.
Your Step : Like and Share ;) have a good year 2020 !
2020-01-06 /--------/ -R.V.
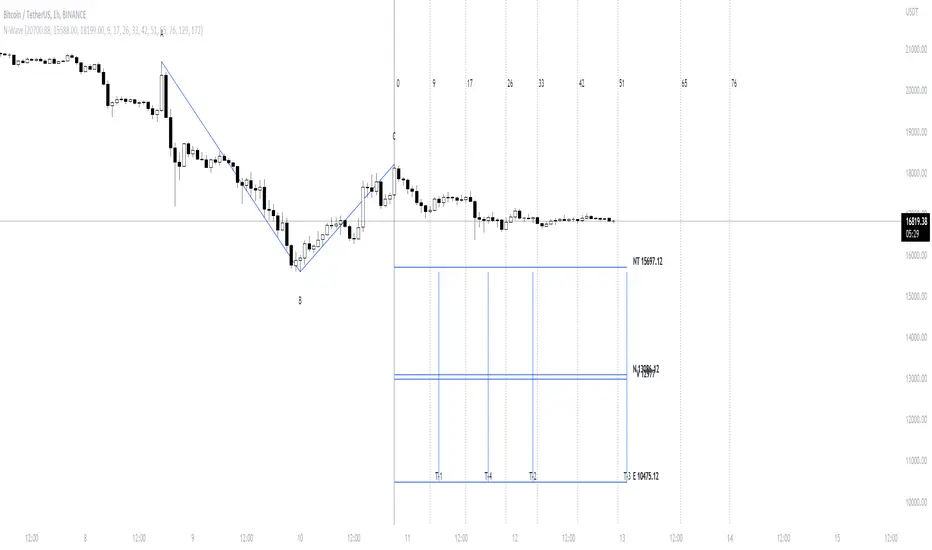
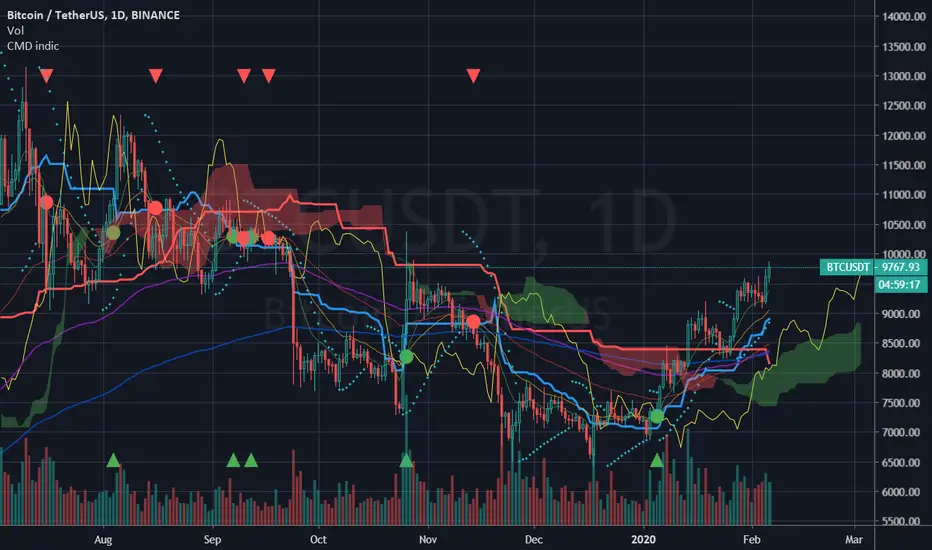
SwingHello All,
Here is another gem I recently finished working on.
Swing is a Ichimoku based indicator which I designed specifically to call major swing trades.
Here I have Daily BTC chart which shows Swing perfectly calling major trend reversals.
Not only that, this indicator also works its magic on lower TFs, here is just one example, where Swing called major moves on BTC 1hr chart.
Contact me for more information.
:) :)
