Ichimoku Cloud

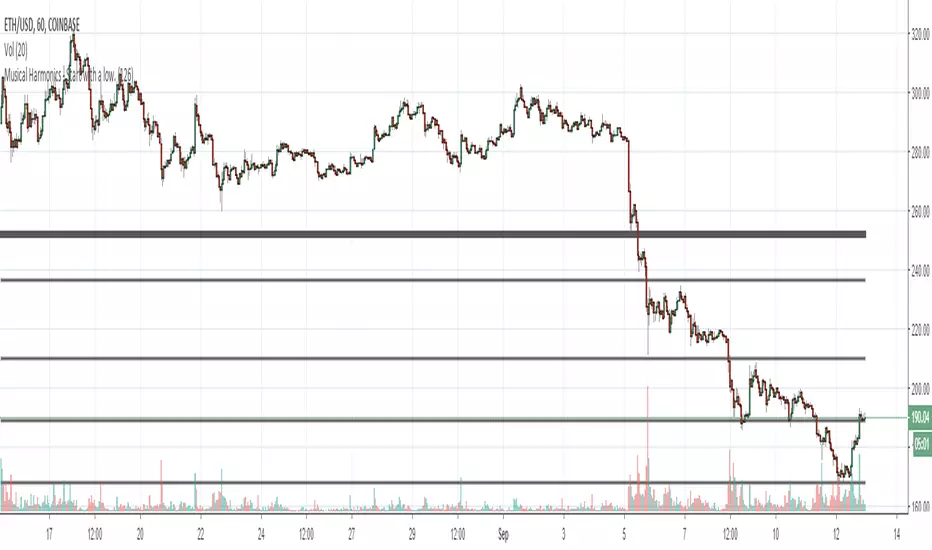
Musical Harmonics - Start with a low.Octaves double from one octave to another, so start with octaves beginning with the number one, for example:
1 doubled is 2, 2 doubled is 4, 4 double is 8 and then we go on to this sequence:
1,2,4,8,16,32,64,126,256,512,1024,2048,etc,etc
Find one of the numbers near a range, so for example on this chart Ethereum was trading at 190.31. That price is in between the octaves of 126 and 256. The number I use as the low for the indicator is 126.
Working on updating with labels and such


EMA analysis with Stoch OverSold/Bought indicator + IchimokuThe script will analyze trend around EMAs (configurable periods) and let you know when to short or long the market.
It will also tell you when there is a Overbought / Oversold Cross over Stochastic indicator
The script also includes a Ichimoku cloud so you can add this to your analysis for a trading action.
There will be more indicators coming into this script since im constantly working on Trading view scripts and analysing new strategys.
If you want access to it, contact me. (Its not free but also not expensive)
Best Regards.

Covengers Ichimoku Cloud ver 0.4Covegers Ichimoku Cloud ver 0.4 Released !
Middle Price Line Updated !
IF,
High Price Line head Downward = Sell
Low Price Line head Upward = Buy
EASY WORK.
//
코벤져스 일목구름 0.4 버전이 출시되었습니다.
중간값 선이 추가되었습니다.
만약,
고가의 중간선이 하향한다면 매도
저가의 중간선이 상향한다면 매수
정말 간단한 개념인데 결과가 재밌습니다.
0.41 버전이 추가업데이트 될 예정입니다.

2xIchimoku Cloud + 4xMA + Williams FractalUpdated version of the previously published multi-indicator which includes
4x Moving Averages
2x Ichimoku Clouds
Bill Williams Fractals
Changes:
-Toggle switches for each indicator on input tab for easy on/off
-MA Type Selector (EMA/SMA/WMA/VWMA)
-Various default style change
Many thanks to both redwraith and jedireza for helping me work out the MA section
www.tradingview.com
www.tradingview.com
Next improvements: Ichimoku settings


IO_Ichimoku_Simplev1.0
This is a simplified version of Ichimoku cloud: Chikou and Senkou A and B clouds removed
Tenkan and Kijun is color coded based on the following rules:
1. If both Tenkan and Chikou are above Senkou then bullish
2. If both Tenkan and Chikou are below Senkou then bearish
The chart shows a plot of Tenkan and Kijun color coded with the above rules
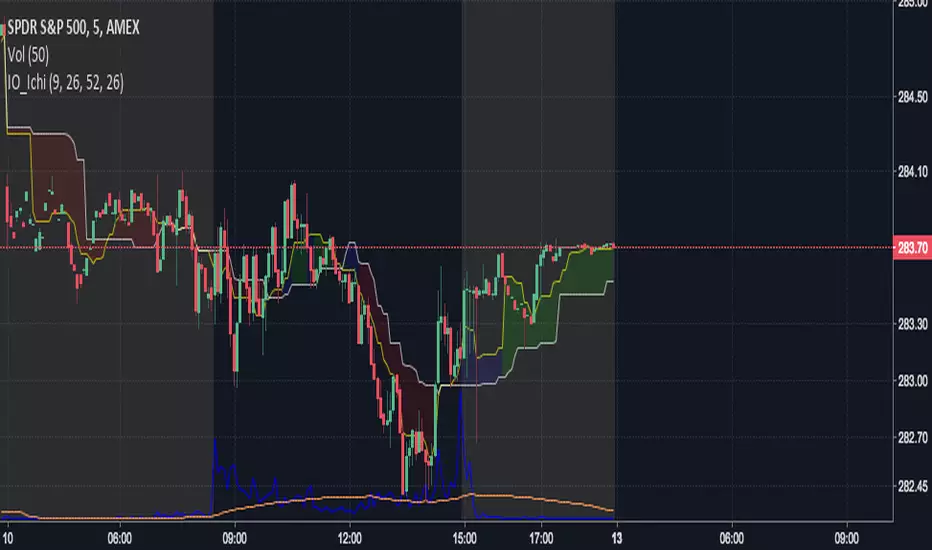

umo Ichimoku CloudYou can see an Ichimoku Cloud in another time frame than the current time frame in which the bars are displayed.
When the cloud's time frame is larger than the bars', the cloud is not filled with solid color(I don't know why). Therefore the cloud is filled with bars instead.

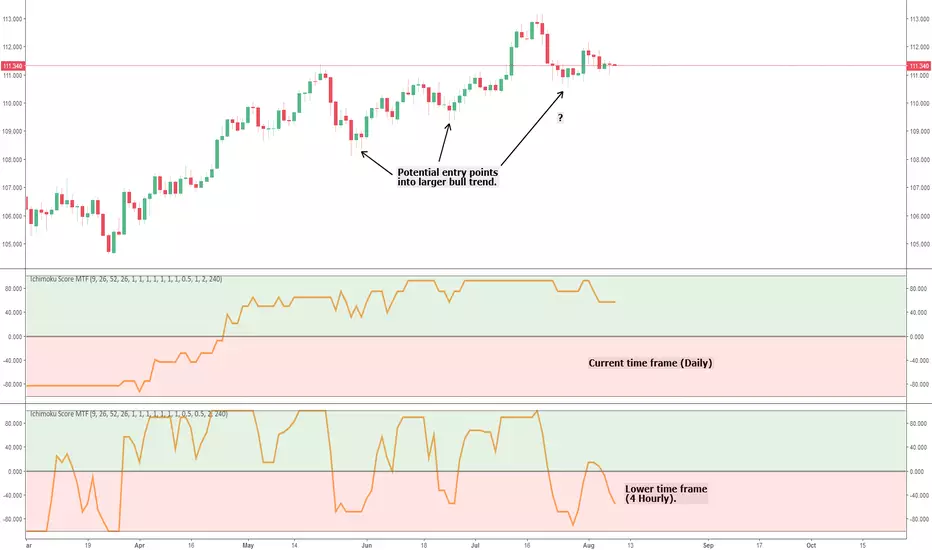
Ichimoku Cloud Score MTFThis is a simple multi time frame (MTF) conversion of the Ichimoku Cloud Score indicator.
All credit goes to the following users for the initial implementations:
- User @dashed :
- User @sjb933 :
This script calculates the Cloud Score based on the sjb933 version; all I've done is convert the script to Pinescript version 3 (to ensure the security function works as intended) and add MTF capability.
I'm a big fan of MTF analysis when using indicators (particularly oscillators). Using a higher time frame runs into the issue of the indicator repainting until the relevant higher time frame candle closes (this is inevitable and logical - so don't comment saying it repaints!). However, for lagging indicators such as this one, adding a lower time frame provides potential entry and exit signals into the larger trend, and also provides early warning of large trend shifts before the current time frame will. This can give you more control over your trades, and in my experience helps lagging indicators such as Ichimoku stay relevant in high volatility markets that are vastly different from when the indicators were conceived.
Any queries please let me know.
Cheers,
RJR
Ichimoku with Alerts (Flexible Conditions)This is the standard Ichimoku indicator with very flexible BUY and SELL conditions.
Inputs
Standard Ichimoku Inputs:
Conversion Line Periods
Base Line Periods
Lagging Span 2 Periods
Displacement
BUY Options
Crossover happens Above the Cloud : Buy when conversion line crosses over baseline above the ichimoku cloud.
Crossover happens Inside the Cloud : Buy when conversion line crosses over baseline inside the ichimoku cloud.
Crossover happens Below the Cloud : Buy when conversion line crosses over baseline below the ichimoku cloud.
Buy when price crosses over Conversion Line : Buy when price crosses over conversion line (could happen below, inside or above the cloud).
Buy when price crosses over Base Line : Buy when price crosses over base line (could happen below, inside or above the cloud).
Buy when price crosses over min of CL and BL : Buy when price crosses over min of conversion and base line pair (could happen below, inside or above the cloud).
Buy when price crosses over max of CL and BL : Buy when price crosses over max of conversion and base line pair (could happen below, inside or above the cloud).
Consecutive ups : Number of bars for the selected buy condition to stay valid in order to trigger a BUY signal/alert.
SELL Options
Note: Each of the following conditions could happen below, inside or above the cloud.
Sell with Crossunder : Sell when converison line crosses under base line.
Sell when price crosses under Conversion Line : Sell when price crosses under conversion line.
Sell when price crosses under Base Line : Sell when price crosses under base line.
Sell when price crosses under min of CL and BL : Sell when price crosses under min of conversion and base line pair.
Sell when price crosses under max of CL and BL : Sell when price crosses under max of conversion and base line pair.
Consecutive downs : Number of bars for the selected sell condition to stay valid in order to trigger a SELL signal/alert.
This indicator has pretty much every possible scenarios to use the Ichimoku indicator effectively. I have also added consecutive ups/downs input, so you can avoid false signals and trade safely.
You can combine different options together. In that case, Buy or Sell signals will be triggered if at least one of the condtions is true.
Please report the bugs you found with a screenshot of the chart. Please make sure that the time stamp is visible, and also include the inputs you selected so I can reproduce the problem and fix it.
Please provide some feedback so we can improve this indicator together.
If you have any questions, please feel free to ask.
The strategy of this indicator is available here:


2xIchimoku Cloud + 4xEMA + Williams FractalCopy+Pasted/edited the code from :
Moku
www.tradingview.com
EMA
www.tradingview.com
Fractal
www.tradingview.com
BottomFinder Adv. Charts Suite V2.0With the advanced charts suite you get multiple indicators you can overlay on your charts, while only using one indicator slot. We made this after requests from our members, to assist those who use a free TV account. IT can take a minute or more to load... be patient! Its not advised to use them all at once, use them in combinations and see what works for you! I wanted to include more indicators, but hit some of the limits imposed by pine script. All options are off by default.
Included are:
Ichimoku Cloud
Support Resistance Fractal
Trailing Long/Short Stoploss
Bull Bear Squares
Triple Hull Moving Average
Standard Hull Moving Average
Fibonacci Daily
Advance Decline Lines
This indicator is available to all our members at no extra charge. If you would like access join us in the link from my signature. You can get a trial of our paid indicators and access to the free ones as well.
Please also like this indicator, and follow me on TradingView for access! We have many more great free indicators coming in the future!

Covengers Ichimoku Cloud ver0.3Covengers Ichimoku Cloud ver0.3
What's NEW?
ver 0.3 Plot Arrow When leadLine 1 and leadLine 2 CROSS
-END-
버전 0.3에서 변한 것
구름대 꼬임이 일어날 경우 화살표를 표시합니다.
끝

Ichimoku With SignalsA variation on Ichimoku Cloud that has markers for strong/neutral/weak bullish/bearish signals.

Trend jumping StrategyBased on this strategy: gaiatrader.com
When on cryptocurrencies or lower timeframes, I apply the indicator on Heiken Ashi candles to reduce noise.
If anyone's interested, I've got a RSI with a predrawed line on 50 level.


Price Equilibrium ImbalancesShows the highest/lowest percentage distance that current price has travelled from Ichimoku Lines & potential reversals/pullbacks when price is statistically far out of equilibrium.
