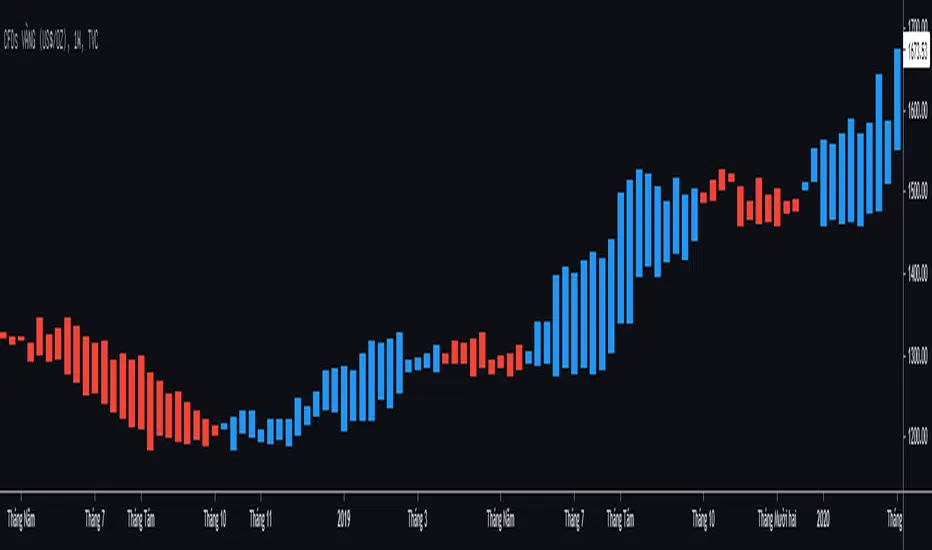
9Week_CandleThe 9-week candle is a candlestick writing method introduced in "Ichimoku Kinko Hyo, Weekly”, which creates positive and negative candles at the closing price of the current week and the opening price of 9 weeks ago to know the current state of the market. By combining the period of the basic numerical value of 9 as one candlestick, it becomes easier to grasp the direction and time relationship.
By default, the upper and lower shadows are displayed, but if you set the shadow color to the same as the background color in the settings, you can display the positive and negative of only the body.
I also created a 3-day candle based on the same method, so please use it as well.
9週足は「一目均衡表週間編」で発表されたローソク足の書き方で、当週の終値と9週前の始値で陽線・陰線を作成し、相場の現在性を知ろうとするものです。9という基本数値の期間を1本のローソク足としてまとめることで方向性と時間関係が把握しやすくなります。
デフォルトでは上ヒゲと下ヒゲが表示されていますが、設定でヒゲの色を背景色と同じにすれば実体のみの陰陽表示が可能です。
同じ考え方で3日足も作成しましたので、併せてご利用ください。
Ichimoku Cloud

TK Cross and Kumo Twist AlertBased on the ichimoku cloud system, this shows on a chart where Tenkan-Kijun cross happens and when a Kumo Twist happens.

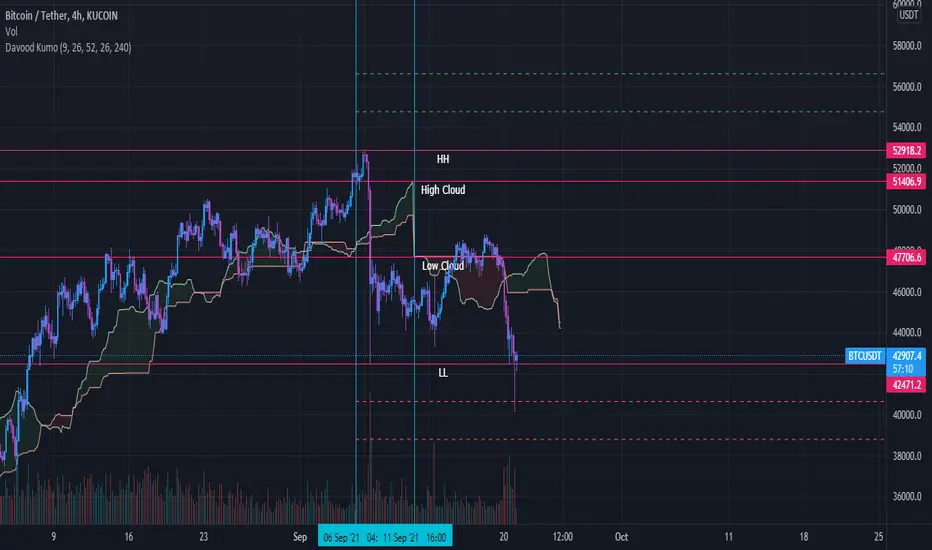
Davood Kumothis andicator is build in base of ichimoku cloud.
Select the interval at which the kumo clouds change phase and depending on what time frame we are in, we give the time inputs to the indicator.
then, the indicator calculates the area of the cloud and set the ascending and descending targets when price break the highest or lowest candle in that time range.
So entry point is the highest and lowest candle and first and second targets are determined by the indicator.
note : i used this andicator only in crypto market not forex and it works well
Specific Date Series (llnylk's)Show specific dates/bars (useful for Ichimoku cloud)
Show where are -9th bar, -20th bar, -26th bar, -52th bars in the past

Confluence TradingThis indicator makes use of the Kumo Cloud, 3EMA and ADX/DI+/DI- indicators. While these can be used separately (green bars show where to long and red bars show where to short), this indicator also shows how their use together can create a more precise estimate on when to enter and exit the market. It is interesting to note that while each of the three indicators individually can predict movements and trend reversals early, having their signals converge into one makes a slower prediction but also a more accurate one. It is a great visual representation of why combining multiple trading techniques or analysis increases odds of winning trades (confluence trading). Do feel free to message me if you wish for me to add any other indicator to the mix or to fix any bugs. The ADX indicator makes use of robertkowalski's code.

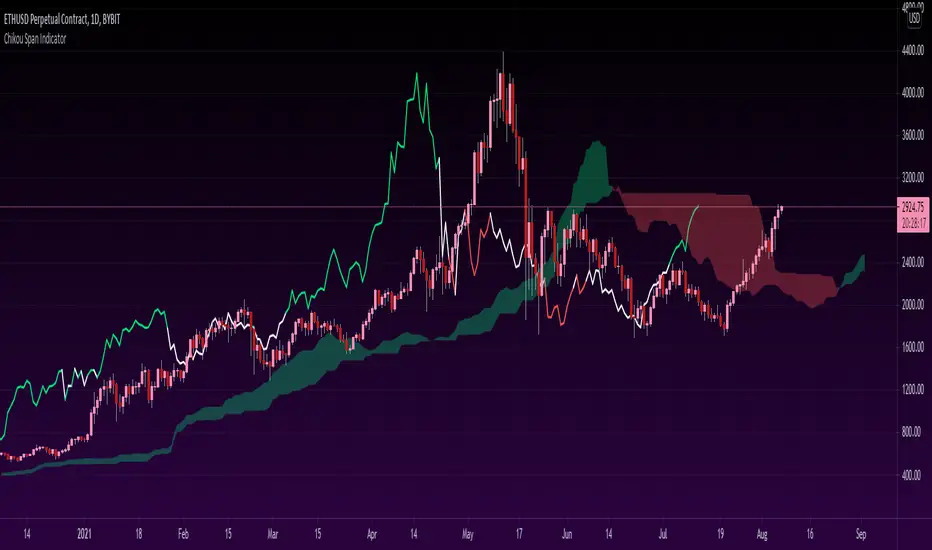
Chikou Span 'Open Space' ColorsThe Ichimoku Clouds strategy has been one of my favorite scripts to work with since I came across it a few months ago, so I thought I'd share one of the automated features I created for the strategy.
For the purpose of this script, I'll only explain the Chikou Span aspect of it since there are plenty of other explanations about Ichimoku Clouds.
The Chikou Span is one of the most useful aspects of the Ichimoku Clouds strategy despite it not being used in most people's strategies. It is calculated by simply taking the current closing value and plotting it backwards 26 bars. The Chikou Span is used to identify large trend moves and trend reversals by what is referred to as 'open space'. This occurs when the Chikou Span is not intersecting any candlestick within 10 bars (if you were to draw a horizontal line from the tip of the Chikou Span, it would not touch any part of a candle within 10 bars).
The purpose of this script is to better identify the Chikou Span reaching 'open space' by coloring the Chikou Span's line:
- Green when it is in upwards open space (bullish trend), and
- Red when it is in downwards open space (bearish trend).
I've also included my personal color scheme for the Ichimoku Clouds strategy as well as inputs to turn on/off every aspect of the strategy.
** Disclaimer: THIS IS NOT TRADING ADVICE. The Chikou Span should not be used on its own to make any trades. When trading with the Ichimoku Cloud strategy, one should utilize all 5 lines of the strategy to make realistic trades. If you'd like to learn more, I'd recommend reading "Trading with Ichimoku Clouds - The Essential Guide to Ichimoku Kinko Hyo Technical Analysis" **
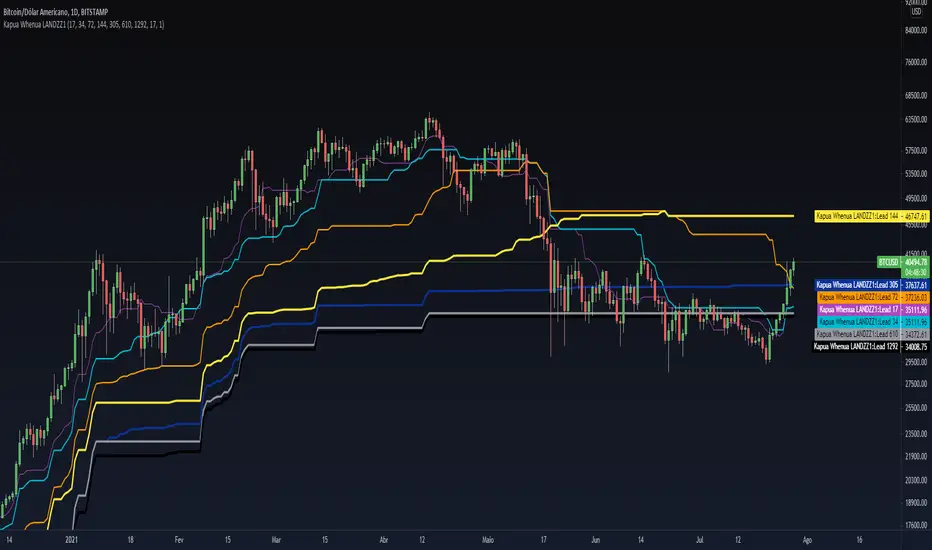
Kapua Whenua LANDZZ1Kapua Whenua means Earth's Clouds in Maori language, this indicator was created to show impulses and trends of the asset's price movement both up and down.
The Indicator was made based on key numbers of the golden ratio:
Conversion Line: Kw 17 (Purple Color)
Kw 34 - Short Period Fractal (Light Blue Color)
Kw 72 - Short/Medium Period Fractal (Orange)
Kw 144 - Medium Period Fractal (Yellow Color)
Kw 305 - Medium/Long Period Fractal (Dark Blue Color)
Kw 610 - Long Period Fractal (Grey)
Kw 1292 - Long Period Fractal+ (Black Color)
The baseline or also called the conversion line is identified by the Color Purple of value 17.
How to read the indicator:
Every time the conversion line (Purple Color 17 periods) crosses a Kw value (Kapua Whenua) it will always look for the next KW line above or below the value as support or resistance.
For example:
If we are in a bull market, and the price crosses below the KW17 conversion line it will go towards KW 34 as support, if the price breaks KW 34 it will go towards the next line below KW 34 as support.
Every time the conversion line or the price crosses a higher value of Kapua Whenua (KW) this trend will be stronger, it means, if the conversion line (KW 17) crosses above KW 305 it will indicate more strength than if it had crossed above the KW 72 or 144 for example. So to get better results trading with the trend, always observe if the conversion line and the price are below or above some Medium/Long Period KW.
Note also that, in an uptrend, it could be that all KW are below each other. In a downtrend, it could be that all KW are on top of each other. This indicates that the farther the price is from the fractals the stronger the trend is, also, when there is a narrowing of the fractals means that the price will start to go sideways. If the price is between 2 or more Fractals, it will indicate consolidation.
A really good trend is considered when the price or the Short/Medium Period Fractals are all above or below at KW 610, which is a long period fractal, meaning a strong uptrend or downtrend.
A larger KW can be at the same point as a smaller KW, however, the stronger color will be shown above the weaker one.
***Larger chart timeframes are better to see longer KW fractals that are above or below the price, if your chart timeframe doesn't show a bigger support or resistance fractal, change the chart time to another longer period**
Tip - Get used to looking at line colors as your indicators, just like moving averages. You can also take or place any fractal at any time in the configuration menu.
ICHIMOKU Trading betaIchimoku Kinko Hyo is a trend-following trading system with 5 indicators. All the five indicators have a different purpose and successful Ichimoku trading required in-depth analysis of all indicators. The script interpreted each indicator and develop a score to indicate the overall strength.
I have taken the idea from the book “Trading with Ichimoku Clouds by MANESH PATEL”. The scoring system is mine to get an idea about how all the indicators are performing together.
If most of the indicators are confirming then the score will be high.
I am very new to Pinescript, so waiting for your comments and review.
You can view all comments by turning the comments on.

Equilibriums -- Based on Ichimoku Kinko HyoIntro:
Hello dear traders. Lately I have been studying Ichimoku for trading. Personaly I find myself in a long lasting quest of creating an automated trading strategy that works.
Let me tell you it aint easy. On this route I made countless of indicators some of which are worthless, others that have some potential. I did not publish these indicators as I do not want to bother people with sub par indicators that waste your time. My belief is strong and some day I will probably succeed in creating a working strategy.
About the indicator:
While researching Ichimoku Kinko Hyo (thanks chaostrader69 for providing such invaluable knowledge) I came across the numbers that define ichimoku. The Tenkan-sen and Kijun-sen lines and even the cloud are based on these numbers and create market equilibrium. The market always wants to return to this equilibrium. As a pine scripter and curious individual I made this indicator to expand the Tenkan and Kijun lines to more of these ichimoku number periods.
Ofcourse this creates a mess of an indicator especialy when combined with the real ichimoku which is already too much info to grasp and apply correctly for most traders. I can not recommend any strategy with this indicator and that is why I want to deliver this simple script to the public. Opinions and trading theorys regarding these lines are very welcome.
As you can see by the chart on the publication of this script the lines where nice and open and not crossing eachother in a clear uptrend. While when it was trading sideways the lines did not show direction at all and where close to eachother and crossing. Thx for taking the time to read this and possibly giving feedback. Feedback on the colors/line thickness is also welcome as I want my indicators to be beautiful!

Ichimoku [xdecow]The Ichimoku Kinko Hyo (Ichimoku Cloud) is a popular indicator / system.
In this version you will have a panel that shows the main signs of this system.
Each signal can have its status as bullish (weak, neutral or strong), consolidation and bearish (weak, neutral or strong).
Signals
Kijun-Sen Cross
Occurs when the price closes above/below the Kijun-sen.
Weak Bullish: Occurs below the Kumo.
Weak Bearish: Occurs above the Kumo.
Bullish/Bearish Neutral: Occurs inside the Kumo.
Strong Bullish: Occurs above the Kumo.
Strong Bearish: Occurs below the Kumo.
TK Cross
Occurs when the Tenkan-sen crosses the Kijun-sen.
Weak Bullish: Occurs when the crossing is below the Kumo.
Weak Bearish: Occurs when the crossing is above the Kumo.
Bullish/Bearish Neutral: Occurs when the crossing is inside the Kumo.
Strong Bullish: Occurs when the crossing is above the Kumo.
Strong Bearish: Occurs when the crossing is below the Kumo.
Chikou Span Cross
Occurs when the Chikou Span crosses the price.
Weak Bullish: Occurs when current price is below the Kumo.
Weak Bearish: Occurs when current price is above the Kumo.
Bullish/Bearish Neutral: Occurs when current price is inside the Kumo.
Strong Bullish: Occurs when current price is above the Kumo.
Strong Bearish: Occurs when current price is below the Kumo.
Kumo Breakout
Occurs when the price closes above/below the Kumo.
Kumo Twist
Occurs when the Senkou Span A crosses the Senkou Span B ahead.
Weak Bullish: Occurs when current price is below the Kumo.
Weak Bearish: Occurs when current price is above the Kumo.
Bullish/Bearish Neutral: Occurs when current price is inside the Kumo.
Strong Bullish: Occurs when current price is above the Kumo.
Strong Bearish: Occurs when current price is below the Kumo.
In addition, Senkou Span B turns golden when it is flat and the cloud is lighter when it is thin (default is half the average of the last 610).

Ichimoku all signalsIchimoku Cloud All Signals!
This indicator shows all Ichimoku Cloud signals for (entering/exiting/confirming/or even staying) in a position.
you can choose a signal related to your strategy and use it.
you can choose which signals to be shown on the chart by changing the settings.
here are some examples of signals that you can get from this indicator:
Crossover/under conversion line & base line
Crossover/under lead line1 & lead line2
Crossover/under conversion line & lead line1
Crossover/under base line & lead line1
Crossover/under conversion line & lead line2
Crossover/under base line & lead line2
Crossover/under close & base line
Cloud Breakouts in both directions!
and 74 signals more !!!!

Ichimoku cross and kumo switch Indicator [Mehdihz]This script has both cross and switch indicators.
** For switch indicator without shift, use 1 for Displacement

Ichimoku breakoutIf you use Ichimoku Cloud strategies, this indicator is very useful for you!
This code indicates the candles that break the ichimoku cloud in both directions!
conversion line, base line and lagging span are disable by default, you can enable it from settings window.
green triangles under the candles with green backgrounds show break out the red clouds.
red triangles at the top of the candles with red backgrounds show break out the red clouds.
you can set alerts to be notified when an Ichimoku Cloud is broken.

[Kai]Ichimoku 一目均衡表LOG Computable Ichimoku clouds Ichimoku Kinko Hyo
Expected to be used on LOG scale
Please note that the value is calculated slightly smaller because it is calculated in LOG.
The usage seems to be the same as the normal Ichimoku clouds Ichimoku Kinko Hyo
* By default, LOG MODE is setting so if you need normal display, set it to FALSE.
LOG計算可能な]Ichimok clouds 一目均衡表です
LOGスケールでの使用を想定しています
LOG計算しているので値は若干小さめに算出されるので注意が必要です
使用方法は通常のIchimok clouds 一目均衡表と同じで良いと思われます
※デフォルトではLOG MODE設定になっていますので、通常の表示が必要な場合は設定でFALSEにしてください

BT CloudBT Cloud is a trading system with an advanced chart overlay showing a very reliable Trend Indicator based off Price, Trend, Momentum, and Market Structure.
Inspired by the Ichimoku Cloud, Parabolic SAR, and Exponential Moving Averages the BT Cloud removes the unnecessary fluff and focuses on the Golden Zone 0.618 to 0.50 Levels on the current time frame for typical RSI length (14) settings.
User should pay attention to where the cloud reverses directions. These areas are 50% ranges of significance and have a high chance of acting like target zones for support and resistance in the future.
This indicator will allow the user to make observations around how extended the trends against each other as well as serving as basis for divergence and trendline studies drawn in manually by the user. The oscillator will turn green/red as observable on the main chart overlay.

Ichimoku Buy & Sell SignalsIchimoku cloud with color coded circles to signal the cross of Tenkan and Kijun.
Japsian - Advanced Ichimoku Kinko HyoThis Script is giving additional options to Ichimoku Kinko Hyo. Mainly used by Japsian Traders.
Extra Benefits:
Additional Kumo's with shift function, comes with On/OFF Option.
Additional Kijun Sen with Shift Function, comes with On/OFF Option.
Additional Tenkan Sen with Shift Functions, comes with On/OFF Option.
Quality Line: you can add any value as per your choice, i suggest 63, it perform same as middle channel of Fibonacci, comes with On/OFF Option.
Direction Line: you can add any value as per your choice. i Suggest 216. it will provide clear long term trend and continuation when stays above and under Kumo. it creates powerful Level of Support and resistance, comes with On/OFF Option.
Adding Previous Day/Week/Month High & Low to Current Time.
Special Appreciation to Hooman, with his support i could create this advance Ichimoku indicator.

Kyushu Legs - Advanced Ichimoku Kinko Hyo TechniqueWhat is Kyushu Legs?
Kyushu Legs created by the open price of 9 previous weekly candle and current weekly close price.
P/s: This is the advanced Ichimoku Kinko Hyo technique by Master Goichi Hosoda
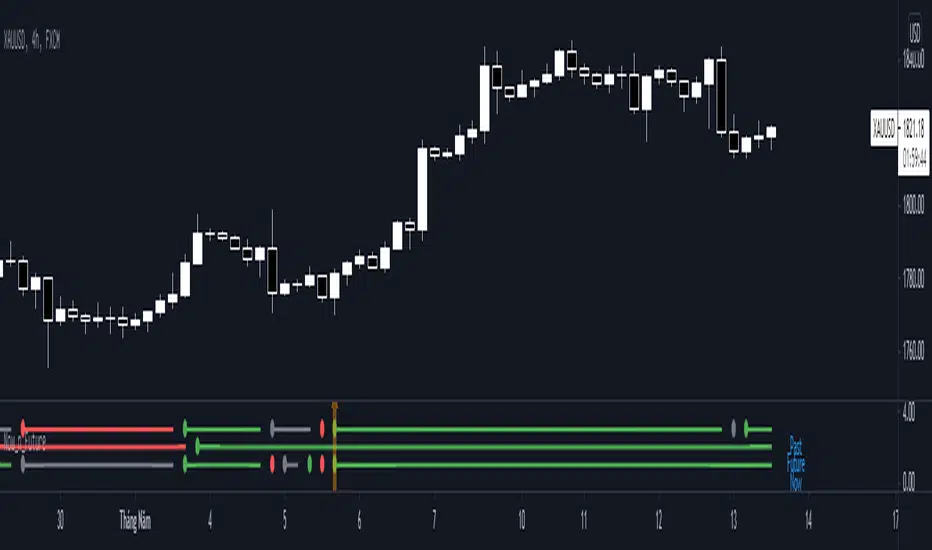
Now_n_FutureNow_n_Future base on Kumo cloud of Ichimoku Kinki Hyo system with detail below:
1. The Now Line
- When price moving above Kumo, color of now line is green.
- When price moving below Kumo, color of now line is red.
- When price moving inside Kumo, color of now line is gray.
- When price go into Kumo, now line appear gray dot.
- When price cross over Kumo, now line appear green dot.
- When price cross under Kumo, now line appear red dot.
2. The Future Line
- When Senkou Span A moving above Senkou Span B, color of future line is green.
- When Senkou Span A moving below Senkou Span B, color of future line is red.
- When Senkou Span A cross over Senkou Span B, future line appear green dot.
- When Senkou Span A cross under Senkou Span B, future line appear red dot.
3. Trading
- When color of both now line and future line is green, consider open Long position or close Short position.
- When color of both now line and future line is red, consider open Short position or close Long position.
IchiAlerts StudyIchimoku Alerts is an indicator born from the Ichimoku Cloud .
The Ichimoku Cloud is a collection of technical indicators that show support and resistance levels, as well as momentum and trend direction. It does this by taking multiple averages and plotting them on the chart. It also uses these figures to compute a cloud which attempts to forecast where the price may find support or resistance in the future.
We have combined several key elements of the Ichimoku Cloud to produce our unique Ichimoku Alerts indicator.
There is also a strategy version so you can backtest results if you so wish to, which I will also share on TradingView.
This indicator can be automated and adapted to fit other timeframes (I've managed to create a nice bot on the 5M timeframe with specific Ichimoku settings).
The Indicator will also print exit signals when the conversion line (blue line in the image) crossed the base line (white line in the image).
If these blue and white lines were to cross again while all other conditions of this indicator are still being met, it will fire a secondary long/short signal. The image above provides a perfect example of a primary short signal, followed by an exit signal, followed by a secondary short signal. In this instance, both signals were winning trades.
Settings within the study contain exactly the same settings you'd find in the standard Ichimoku cloud ...
- Recommended settings for Crypto are 20-60-120-30
When framing a trade after receiving a signal, you should....
- place your stop loss a the lowest cloud line (for longs) or the highest cloud line (for shorts). See image above for a short example
- Your Take profit target is yours to decide, but taking proper risk management is key, and I would advise to aim for a risk/reward ratio of 1:1.5
Hopefully I have covered the basics of this indicator. It's simple yet very effective at providing signals of changes in trend, and with the added bonus of being able to alert those changes, means you don't have to check multiple charts every hour or so!

Ichimoku Crypto Cloud 11-30-61A minor adjustment to the original Ichimoku Cloud, changing periods to reflect the 24/7 open market of cryptocurrency.
TENKAN: 11 - a week and a half
KIJUN: 30 - one month
SENKOU: 61 - two months
For a simpler visualization, I made the cloud limit lines and the Chikou line invisible by default.

Hosoda Cycles (24x7 mkt) {fmz}This script allows you to see on the chart which are the bars, including future ones, which correspond to the cycles of Goichi Hosoda, the inventor of Ichimoku Kinko Hyo.
This script is only suitable for 24x7 markets, it is not suitable for markets with closing times and weekends, or gap markets where trading is not active. In fact, the calculation of calendar times is used, not suitable for markets with closing times.
Use the settings to indicate what the start time of bar 1. The indicator will produce many vertical bars, even in addition to the end time of the graph.

Rosebud Trend [DepthHouse]Rosebud Trend Indicator uses complex range calculations to easily detect trend changes, critical support and resistance levels, and even aid in spotting reversals. The Critical Support & Resistance Zones are plotted via the red and green cloud. This cloud not only visually displays the expected trend direction but often acts as major support and resistance zones. The outer band measures the expected range in which the assets trades within over longer periods of time.
Users can switch the ‘Trend Sensitivity’ between ‘Low’ and ‘High’ to increase or decrease the rate at which the cloud changes.
By altering the S/R Band Thickness users can furthermore increase or decrease the rate at which a trend changes by altering the thickness of the cloud. I prefer to keep these settings at 0.55 , 0.382, or 0.236.
The bar colors are generated by a combination of Rosebuds primary function and our ATR AUTO Oscillator base functions. Users have 3 bar color options to select from: Simple, Complex, and Off .
Simple: Bars colors alternate between shades of red and green based on the trend direction and the ATR Auto strength. Stronger the shade, the stronger the trend.
Complex: This adds a few extra variables to the script which generates a more complex bar color display. Using this option, Rosebud will generate light red bars in a bull trend if downward movement is strong and vice versa in a bear trend. It also will generate a purple bar if the candle successfully closes above or below the Top & Bottom Range Bands; We call this a range break , and it could be an early sign of strong upward or downward movement.
Off: In case you like to keep things even simpler, this option hides all overlay bar colors.
Sample of Complex Bar Colors:
Bull, Bear signals along with Up and Down arrows are too based on a combination of our trend direction and ATR Auto Oscillator calculations.
Users have the option to adjust both bar color, and shape generation settings via:
Smoothed Signal Option: Turns advance smoothing on or off. On will reduce signal noise, while Off could land you that perfect bottom signal with a lower success rate.
Candlestick Length: Default factor for bar color and shape generation, higher the number the fewer signals that will generate.
Candlestick Smoothing: Default smoothing for the Candlestick Length
Signal Lookback: Adjust the factor at which Bull, Bear, Up, and Down. Lower this to 2 for more signals.
Cross Thresholds: The lower this number the easier it is for ‘Bull’, ‘Bear’, and over extended signals to generate; see image below:
*Users also have the option to hide all signal visuals via the 'Shapes' On/Off option.
Users have multiple built in Alerts to choose from:
Bullish Trend Change: When the critical cloud switches to Bullish
Bearish Trend Change: When the critical cloud switches to Bearish
Upper Range Break: When the price action closes above the Range Top
Lower Range Break: When the price action closes below the Range Bottom
Light Bullish Cross: Early bullish signal; also displayed by up arrows by default
Light Bearish Cross: Early bear signal: also displayed by down arrows by default
Verified Bullish Cross: Occurs when a Bull signal is generated.
Verified Bearish Cross: Occurs when a Bear signal is generated.
*Past performance is no guarantee of future results*
