Ichimoku Cloud w. Signals and AlertsIchimoku Cloud w. Signals and Alerts highlights when the Ichimoku signals a Bullish or Bearish move as well as the crosses of the Conversion Line and the Base Line both up and down.
The Bullish signals and Bearish signals fire when the following criteria is met:
Bullish Setup:
1. Price close over Lead Lines (26 periods ahead)
2. Green Cloud (26 Periods ahead)
4. Conversion Line above Base Line
Bearish Setup:
1. Price close under Lead Lines (26 periods ahead)
2. Red Cloud (26 Periods ahead)
4. Conversion Line below Base Line
The initial signal will fire when that criteria hits, once that criteria hits, background will fill either green or red behind the bars where the criteria still applies and will have no background color if above criteria doesn't apply.
Once the background fill disappears you should begin looking to set a stop or exit as the Ichimoku maybe reversing.
Be sure to still use Lagging Span and the price position to the cloud on where it actually is before entering/exiting positions even if a signal is fired.
I have also included the ability to add alerts to both the Conversion Line/Base Line crosses as well as the initial signals for the Bullish and Bearish Ichimoku signals. The alerts are configured to easily be added for a webhook to push to a Discord channel as well.
Works on all timeframes to signal general direction of move.
Ichimoku Cloud

Overlay Indicators (EMAs, SMAs, Ichimoku & Bollinger Bands)This is a combination of popular overlay indicators that are used for dynamic support and resistance, trade targets and trend strength.
Included are:
-> 6 Exponential Moving Averages
-> 6 Simple Moving Averages
-> Ichimoku Cloud
-> Bollinger Bands
-> There is also a weekend background marker ideal for cryptocurrency trading
Using all these indicators in conjunction with each other provide great confluence and confidence in trades and price targets.
An explanation of each indicator is listed below.
What Is an Exponential Moving Average (EMA)?
"An exponential moving average (EMA) is a type of moving average (MA) that places a greater weight and significance on the most recent data points. The exponential moving average is also referred to as the exponentially weighted moving average. An exponentially weighted moving average reacts more significantly to recent price changes than a simple moving average (SMA), which applies an equal weight to all observations in the period.
What Does the Exponential Moving Average Tell You?
The 12- and 26-day exponential moving averages (EMAs) are often the most quoted and analyzed short-term averages. The 12- and 26-day are used to create indicators like the moving average convergence divergence (MACD) and the percentage price oscillator (PPO). In general, the 50- and 200-day EMAs are used as indicators for long-term trends. When a stock price crosses its 200-day moving average, it is a technical signal that a reversal has occurred.
Traders who employ technical analysis find moving averages very useful and insightful when applied correctly. However, they also realize that these signals can create havoc when used improperly or misinterpreted. All the moving averages commonly used in technical analysis are, by their very nature, lagging indicators."
Source: www.investopedia.com
Popular EMA lookback periods include fibonacci numbers and round numbers such as the 100 or 200. The default values of the EMAs in this indicator are the most widely used, specifically for cryptocurrency but they also work very well with traditional.
EMAs are normally used in conjunction with Simple Moving Averages.
" What Is Simple Moving Average (SMA)?
A simple moving average (SMA) calculates the average of a selected range of prices, usually closing prices, by the number of periods in that range.
Simple Moving Average vs. Exponential Moving Average
The major difference between an exponential moving average (EMA) and a simple moving average is the sensitivity each one shows to changes in the data used in its calculation. More specifically, the EMA gives a higher weighting to recent prices, while the SMA assigns an equal weighting to all values."
Source: www.investopedia.com
In this indicator, I've included 6 popular moving averages that are commonly used. Most traders will find specific settings for their own personal trading style.
Along with the EMA and SMA, another indicator that is good for finding confluence between these two is the Ichimoku Cloud.
" What is the Ichimoku Cloud?
The Ichimoku Cloud is a collection of technical indicators that show support and resistance levels, as well as momentum and trend direction. It does this by taking multiple averages and plotting them on the chart. It also uses these figures to compute a "cloud" which attempts to forecast where the price may find support or resistance in the future.
The Ichimoku cloud was developed by Goichi Hosoda, a Japanese journalist, and published in the late 1960s.1 It provides more data points than the standard candlestick chart. While it seems complicated at first glance, those familiar with how to read the charts often find it easy to understand with well-defined trading signals."
More info can be seen here: www.investopedia.com
I have changed the default settings on the Ichimoku to suit cryptocurrency trading (as cryptocurrency is usually fast and thus require slightly longer lookbacks) to 20 60 120 30.
Along with the Ichimoku, I like to use Bollinger Bands to not only find confluence for support and resistance but for price discovery targets and trend strength.
" What Is a Bollinger Band®?
A Bollinger Band® is a technical analysis tool defined by a set of trendlines plotted two standard deviations (positively and negatively) away from a simple moving average (SMA) of a security's price, but which can be adjusted to user preferences.
Bollinger Bands® were developed and copyrighted by famous technical trader John Bollinger, designed to discover opportunities that give investors a higher probability of properly identifying when an asset is oversold or overbought."
This article goes into great detail of the complexities of using the Bollinger band and how to use it.
=======
This indicator combines all these powerful indicators into one so that it is easier to input different settings, turn specific tools on or off and can be easily customised.

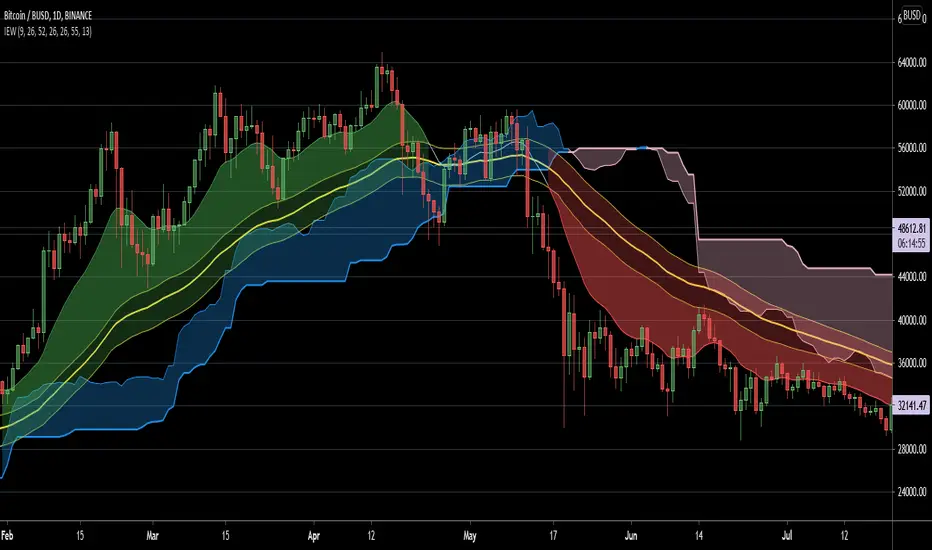
Ichimoku EMA WaveThis script combines a customizable Ichimoku Cloud/ EMA combination to provide a quick trend visualisation.
For example, long entries can be found when the green EMA wave rises above the Ichimoku cloud.
Combine it with some oscillators (like MACD) for good results.
Also, experimenting with a different "wavelength" (default 50) and/or EMA length (default10) for different securities is a good idea.
Script is free to use and to modify at ones liking.
Lower Time Frame ScalperThis indicator is meant to identify lower timeframe momentum shifts in Forex pairs by using simple moving averages and the Kijun Sen indicator around key psychological levels.
Alert functionality for buy and sell conditions have also been built in to allow the trader time away from charts.

3SMA + Ichimoku 2leadlineThis indicator simultaneously displays two lines, which are the leading spans of the Ichimoku Kinko Hyo, and three simple moving averages.
To make it easier to distinguish between the simple moving average line and the line of the Ichimoku Kinko Hyo, the simple moving average line is set to level 2 thickness by default.
Also, the color of Reading Span 1 in the Ichimoku Kinko Hyo has been changed from green to lime to improve color visibility.
I (author of this indicator) use this indicator especially as a simple perspective on the cryptocurrency BTC / USD(USDT).
If this indicator is a problem, moderators don't know about tradingview beginners.
" Visibility " should be a high-priority item not only for indicators but also for graph requirements.
Visibility is one of the most important factors for investors who have to make instant decisions in one minute and one second.
The purpose of this indicator is to display two leading spans that are easily noticed in the Ichimoku cloud and three simple moving averages whose set values can be changed.
This is because chart analysis often uses a combination of a simple moving average of three periods and two lead spans of the Ichimoku cloud.
Also, in chart analysis, green is often displayed with the same thickness on both the moving average line and the Ichimoku cloud.
Therefore, if the moving average line and the Ichimoku cloud often use the same green color, the visibility will drop. Therefore, the green color of Ichimoku cloud was changed to lime color by default.
Tradingview beginners often refer only to the two lines of the leading span of Ichimoku Cloud. Therefore, we decided not to draw lines that are difficult to use.
Many Tradingview beginners don't know that you can change the thickness of the indicator .
Therefore, this indicator shows by DEFAULT the three commonly used simple moving averages that are thickened by one step at the same time.
Also, since the same green color is often used for the Ichimoku cloud and the moving average line, the green color of the preceding span of the Ichimoku cloud is changed to lime color by default.
The originality of this indicator is that it enhances " visibility " so that novice tradingview users will not be confused on the chart screen.
The lines other than the preceding span of the Ichimoku cloud are not displayed, and the moving average line is level 2 thick so that the user can easily see it.
This indicator not only combines a simple moving average and Ichimoku cloud, but also improves "visibility" by not incorporating lines that are difficult to see from the beginning and making it only the minimum display, making it easy for beginners to understand. The purpose is to do.
If any of the other TradingView indicators already meet the following, acknowledge that this indicator is not original.
・Display 3 simple moving averages at the same time
・For visibility, the thickness of the simple moving average line is set to level 2 from the beginning.
・A setting that does not dare to draw lines other than the lead span of Ichimoku cloud.
・Make the moving average line and the Ichimoku cloud line different colors and thicknesses from the beginning.

Ichimoku Kinkō HyōThe Ichimoku Kinko Hyo is an trading system developed by the late Goichi Hosoda (pen name "Ichimokusanjin") when he was the general manager of the business conditions department of Miyako Shinbun, the predecessor of the Tokyo Shimbun. Currently, it is a registered trademark of Economic Fluctuation Research Institute Co., Ltd., which is run by the bereaved family of Hosoda as a private research institute.
The Ichimoku Kinko Hyo is composed of time theory, price range theory (target price theory) and wave movement theory. Ichimoku means "At One Glace". The equilibrium table is famous for its span, but the first in the equilibrium table is the time relationship.
In the theory of time, the change date is the day after the number of periods classified into the basic numerical value such as 9, 17, 26, etc., the equal numerical value that takes the number of periods of the past wave motion, and the habit numerical value that appears for each issue is there. The market is based on the idea that the buying and selling equilibrium will move in the wrong direction. Another feature is that time is emphasized in order to estimate when changes will occur.
In the price range theory, there are E・V・N・NT calculated values and multiple values of 4 to 8E as target values. In addition, in order to determine the momentum and direction of the market, we will consider other price ranges and ying and yang numbers.
If the calculated value is realized on the change date calculated by each numerical value, the market price is likely to reverse.
転換線 (Tenkansen) (Conversion Line) = (highest price in the past 9 periods + lowest price) ÷ 2
基準線 (Kijunsen) (Base Line) = (highest price in the past 26 periods + lowest price) ÷ 2
It represents Support/Resistance for 16 bars. It is a 50% Fibonacci Retracement. The Kijun sen is knows as the "container" of the trend. It is prefect to use as an initial stop and/or trailing stop.
先行スパン1 (Senkou span 1) (Lagging Span 1) = {(conversion value + reference value) ÷ 2} 25 periods ahead (26 periods ahead including the current day, that is)
先行スパン2 (Senkou span 2) (Lagging Span 2) = {(highest price in the past 52 periods + lowest price) ÷ 2} 25 periods ahead (26 periods ahead including the current day, that is)
遅行スパン (Chikou span) (Lagging Span) = (current candle closing price) plotted 26 periods before (that is, including the current day) 25 periods ago
It is the only Ichimoku indicator that uses the closing price. It is used for momentum of the trend.
The area surrounded by the two lagging span lines is called a cloud. This is the foundation of the system. It determines the sentiment (Bull/Bear) for the insrument. If price is above the cloud, the instrument is bullish. If price is below the cloud, the instrument is bearish.
-
The wave theory of the Ichimoku Kinko Hyo has the following waves.
All about the rising market. If it is the falling market, the opposite is true.
I wave rise one market price.
V wave the market price that raises and lowers.
N wave the market price for raising, lowering, and raising.
P wave the high price depreciates and the low price rises with the passage of time. Leave either.
Y wave the high price rises and the low price falls with the passage of time. Leave either.
S wave A market in which the lowered market rebounds and rises at the previous high level.
There are the above 6 types but the basis of the Ichimoku Kinko Hyo is the N wave of 3 waves.
In Elliott wave theory and similar theories, basically there are 5 waves but 5 waves are a series of 2 and 3 waves N, 3 for 7 waves, 4 for 9 waves and so on.
Even if it keep continuing, it will be based on N wave. In addition, since the P wave and the Y wave are separated from each other, they can be seen as N waves from a large perspective.
-
There are basic E・V・N・NT calculated values and several other calculation methods for the Ichimoku Kinko Hyo. It is the only calculated value that gives a concrete value in the Ichimoku Kinko Hyo, which is difficult to understand, but since we focus only on the price difference and do not consider the supply and demand, it is forbidden to stick to the calculated value alone.
(The calculation method of the following five calculated values is based on the rising market price, which is raised from the low price A to the high price B and lowered from the high price B to the low price C. Therefore, the low price C is higher than the low price A)
E calculated value The amount of increase from the low price A to the high price B is added to the high price B. = B + (BA)
V calculated value Adds the amount of decline from the high price B to the low price C to the high price B. = B + (BC)
N calculated value The amount of increase from the low price A to the high price B is added to the low price C. = C + (BA)
NT calculated value Adds the amount of increase from the low price A to the low price C to the low price C. = C + (CA)
4E calculated value (four-layer double / quadruple value) Adds three times the amount of increase from the low price A to the high price B to the high price B. = B + 3 × (BA)
Calculated value of P wave The upper price is devalued and the lower price is rounded up, and the price range of both is the same.
Calculated value of Y wave The upper price is rounded up and the lower price is rounded down, and the price range of both is the same.

IKH Signals v2Hi,
I'm happy to release this new update after few weeks working.
Fixes
Fix kumo break-out of Chiku span and close price
Fix buy trigger and strong buy trigger
Improvement
Signals take now the kumo thickness and kumo angle
Signals does not trigger on doji candles
Multi time frame validation is now available
I hope this fixes and new features will improve the signals for you too.
Let me know if you find strange behavior or possible improvments.
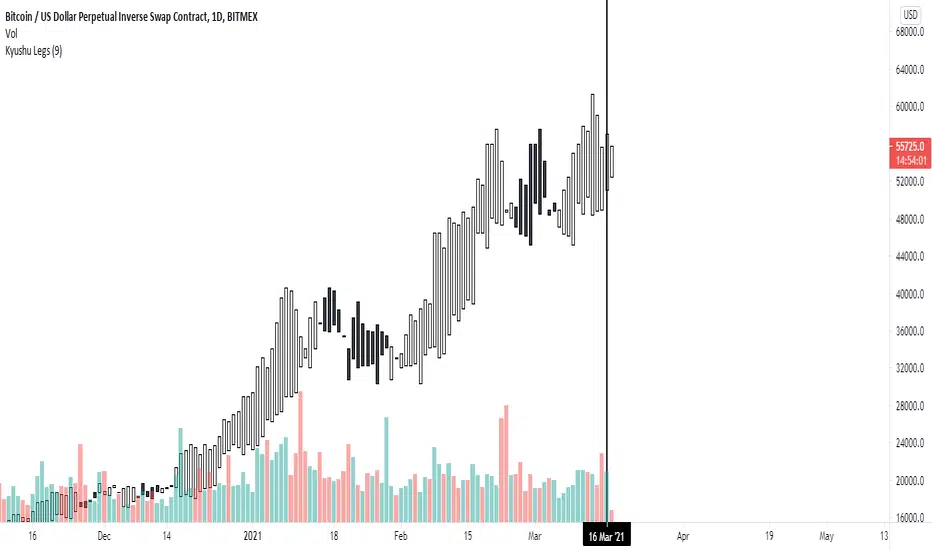
Ichimoku by HosodaWritten from scratch Ichimoku indicator, based on original calculations from Hosoda books. All formulas are exactly the same as Hosoda put them in his books, it contains additionally analysis from Higher Timeframe allowing to display Chikou trend, Kijun and Senkou-span B which are crucial in determining trend. It also contains overlay of Kyushu Legs. This is initial version of script and will be contanstly improved.
Some Ichimoku scripts have basic bugs in calculations and I ensure that formulas in this indicator are fully correct in relation to formulas provided by Hosoda.

Kyushu LegsKyushu Legs is part of the Ichimoku strategy. Kyushu Legs shows new candle bars which help to find a change of trend.
Legs Kyushu is created every candle based on close 9 candles before the actual open candle. Also, there is a possibility of changing the settings of counting the Legs Kyushu.
Colors change based on trend: the white candles show that the market is bullish, black candles that the market is bearish.
source of the code:
Ichimoku + 2 base linesIchimoku + 2 base line
This indicator is a combination of Ichimoku cloud indicator with two base lines.
The first base line is the same as the Ichimoku default settings but the baseline 2 indicates an average of 108 candles in the past and it acts as a strong support and resistance level.
How to use this indicator?
You can use this indicator to see if a break out is true or is a false break. For example if the price broke up the Ichimoku cloud and base line 2 is above the price, it will probably react to that area but if it's below the price, it is a good opportunity to buy. (for sell/short position it is in the opposite way the base line 2 should be above the price)
If you want to trade in support zones base line 2 (108) is a very good area that you can wait for a good candlestick pattern to enter a position.
Caution: before using this indicator please back test it and if the results were good enough, use it as a confirmation.

Multi Timeframe Silent IchimokuMulti Timeframe Silent Ichimoku
Is an upgrade on my previous Silent Ichimoku indicator witch attempts to filter out the noise from the Ichimoku indicator By only coloring the bars
Green if the Ichimoku spots an uptrend
Red if Ichimoku spots a downtrend
And Gray if Ichimoku spots consolidation
This Indicator adds the ability to filter out some bad signals by taking the Ichimoku from the higher time frame into consideration and providing a visual back test
Huge shout out to fareidzulkifli for the Quick Backtest Framework Awesome tool to add to your framework


LTF Signal with KTS ConfirmationLTF Signal with Ichimoku KTS Confirmation
If you cant to learn more about ichimoku and KTS strategy from Forex Kei trader.
This indicator is based in multiple indicators. I will try to explain how it works.
Input
The only input is the major trend resolution. This is for Ichimoku and KTS trend confirmation
Signals
This script provide sell or buy signals provided on some condition explained just below
Mandatory conditions
Ichimoku KTS : kumo up, SSA or SSB up and kijun up or kumo down, SSA or SSB down and kijun down
RSI or Accumulation/Distribution should be rising or falling
Price should be moving up or down
Price should have break previous 6 candles high or low
2 optional conditions explained below
optional conditions
EMA 9 should have crossed EMA 21
Price should have crossed SMA 50
Stochastic 30 10 10 should have gold cross
Price should have cross vwap
The signals are triggered if all mandatory conditions are filled and at least 2 optional conditions

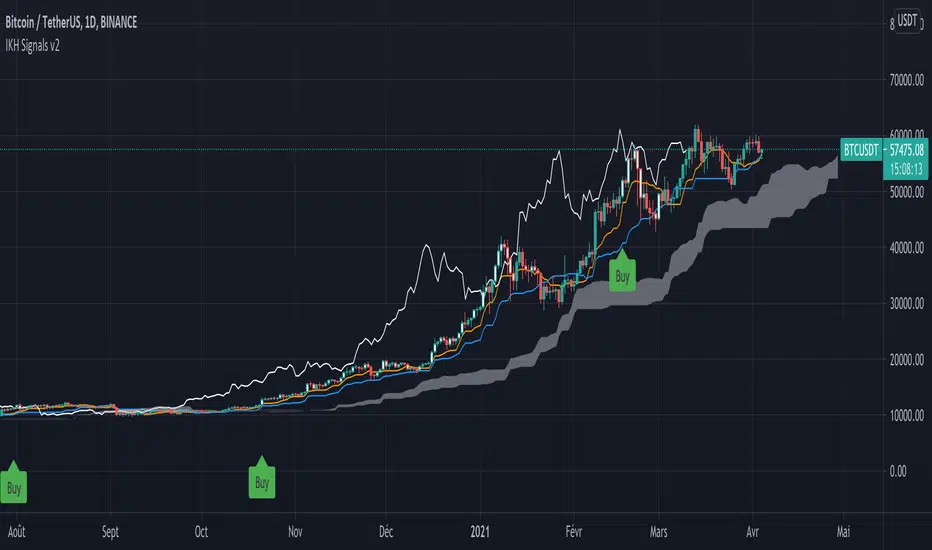
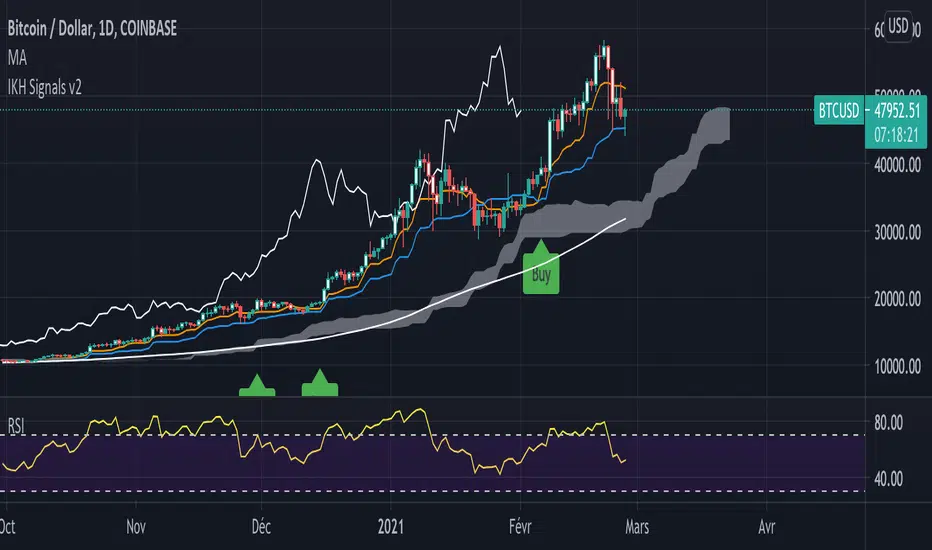
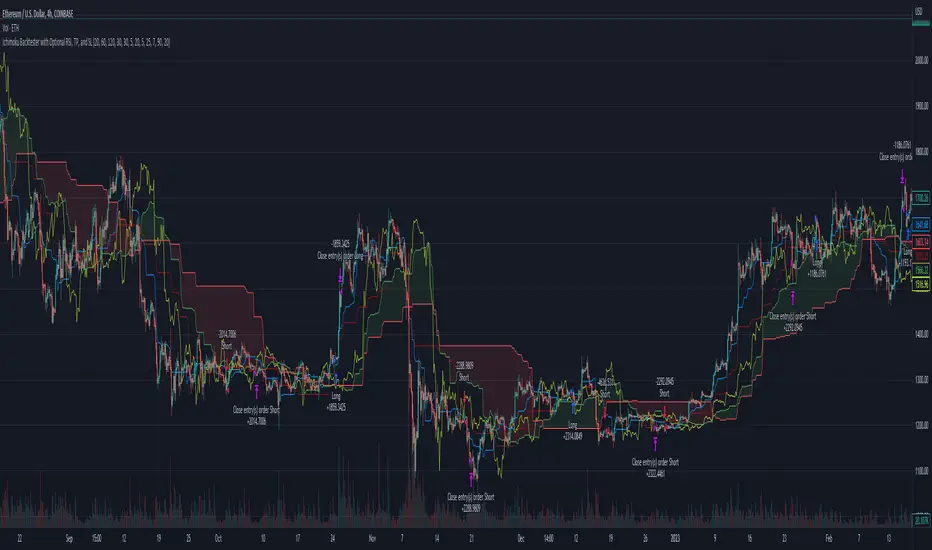
IKH Signals v2Ichimoku Kinko Hyo Signals
This script show signals based on my understanding in Ichimoku Kinko Hyo and is an evolution of this script
Instead of using my own functions, I use now the ones provided by pine script
/!\ Please do not follow signals blindly and always make your own analysis /!\
Signals explanation
Buy : Price above kumo, tenkan above kijun, chikou span above candles and kumo and price break previous 9 candles high
Strong Buy : Is a Sanyaku Kouten and can show a potential reverse in current tendance
Sell : Price below kumo, tenkan below kijun, chikou span below candles and kumo and price break previous 9 candles low
Strong Sell : Is a Sanyaku Gyakuten and can show a potential reverse in current tendance
Exit : Show a potential time to take profit based on previous Sell, Strong Sell, Buy, or Strong Buy signal
Buy Colored bard : bar a colored between a buy signal and an buy exit signal, based on this conditions : kumo up, SSA or SSB up and kijun up
Sell Colored bard : bar a colored between a sell signal and an sell exit signal, based on this conditions : kumo down, SSA or SSB down and kijun down
How to use it
When a signal is triggered
A signal ( strong or not ) show a new entry point. You can start looking for an entry in lower timeframe according to the signal direction.
A colored bar means that the price is pushing in a direction according to the previous signals, It's a good moment to look for an entry in lower timeframes.
Alerts
You can configure alerts for Strong buy, buy, Strong sell, sell and both exit signals
Silent IchimokuSilent Ichimoku
attempts to filter out the noise from the Ichimoku indicator By only coloring the bars
Green if the Ichimoku spots an uptrend
Red if Ichimoku spots a downtrend
And Gray if Ichimoku spots consolidation

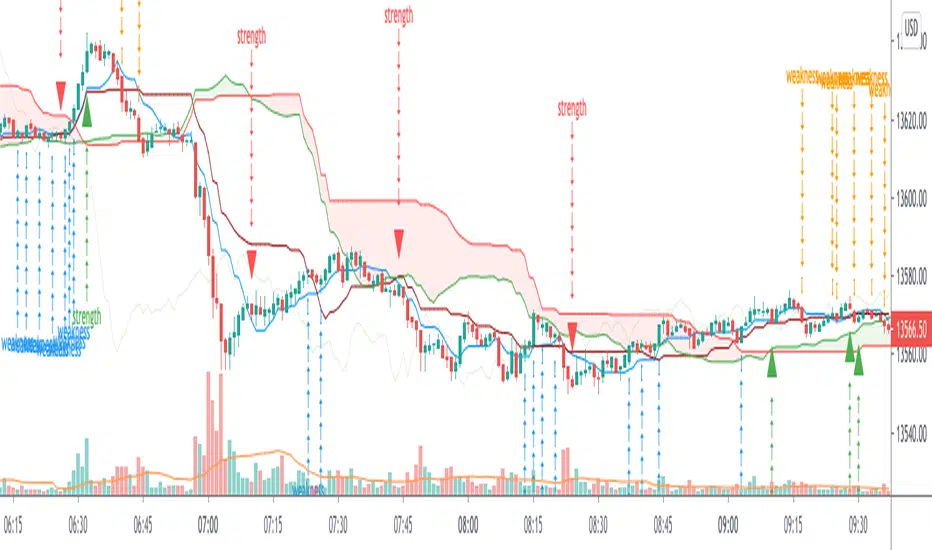
Ichimoku Trader ToolkitThe Ichimoku Cloud
is a collection of technical indicators that show support and resistance levels, as well as momentum and trend direction. It does this by taking multiple averages and plotting them on the chart. It also uses these figures to compute a "cloud" which attempts to forecast where the price may find support or resistance in the future. The Ichimoku cloud was developed by Goichi Hosoda, a Japanese journalist, and published in the late 1960s.
It provides more data points than the standard candlestick chart. While it seems complicated at first glance, those familiar with how to read the charts often find it easy to understand with well-defined trading signals.
The Ichimoku Cloud is useful for day traders and others who need to make quick decisions. The cloud is often paired with other technical indicators, such as the Relative Strength Index , in order for traders to get a complete picture of resistance and support. Many traders will also look out for crossovers in order to determine when trends have reversed.
Ichimoku cloud trading requires a lot of self-discipline. This is because you have to wait for the best trade signals.
What is this Ichimoku Trader Toolkit ?
Since Ichimoku is a reliable Indicator, but its very populated on charts, Its bit complicated to find the Sign of Strength {SOS} and Sign of Weaknesses {SOW} at first glance,
The Toolkit is an attempt to make Ichimoku much more Intutive to trade and visualize the potential SOS and SOW early in the charts
What timeframes can it be used?
Any Timeframe
Provision for Alerts
Strength_alerts
Weakness_alerts
All_Alerts
How can you get access?
Private message me only, use comment box for constructive comments
Ichimoku BaselineVersion 1.0 with some possible updates in the future.
Based on Ichimoku Cloud, this indicator pulls information about Tenkan, Kijun, as well as the Cloud Spans to calculate an immediate to short-term level of support or resistance, depending on whether price is above or below it.
Breaking across the line can be a good indicator of when to be long or short on the market, as well as a good way to have a "Baseline" to filter out other signals.
By default it is set to a modest 5 bar displacement/offset. Feel free to experiment with this value.
Enjoy!

Ichimoku LiteIchimoku Kinko Hyo (often called Ichimoku Cloud) is a technical analysis method and trading system developed by Hosoda Goichi in 1935 and first published in 1975 under the pen-name Ichimoku Sanjin. The indicator shows the overall market state and reveals the equilibrium point of the price movement. The key idea of developing this indicator is to know the presence of the market. However, most of the default setting of this indicator is difficult to its elaborate visual presentation. Here, I modify the indicator by removing the lagging span and applying a lower color contrast of the cloud. This indicator can be combined with the turbulence indicator to provide a better confirmation of breakout signals.

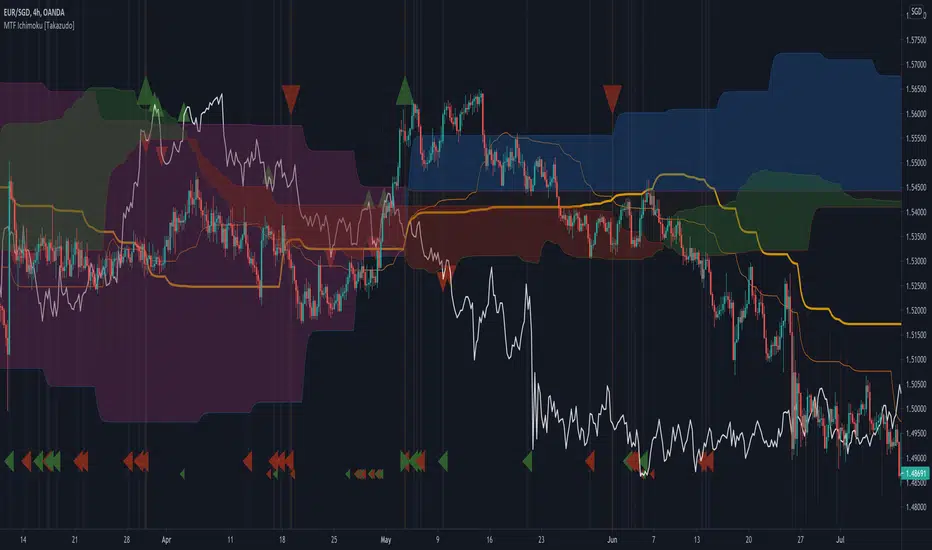
MTF Ichimoku Signal [Takazudo]A multi timeframe Ichimoku Signal indicator. This indicator shows the status of each Ichimoku Signals.
1. TK-Cross
Tenkan-Sen & Kijun-Sen cross status
2. Future Kumo
The newest Kumo color
3. Kumo & Current Relation
The relation between current price & Kumo.
4. Kumo & Chikou-Span Relation
The relation between Kumo & Chikou-Span.
5. Chikou-Span & Candle Cross
Chikou-Span & Candle cross status

Ichimoku Basic AlertsStarted with Ichimoku Kinko Hyo by Mizuki32. Converted to study and added alerting and cloud confirmation.
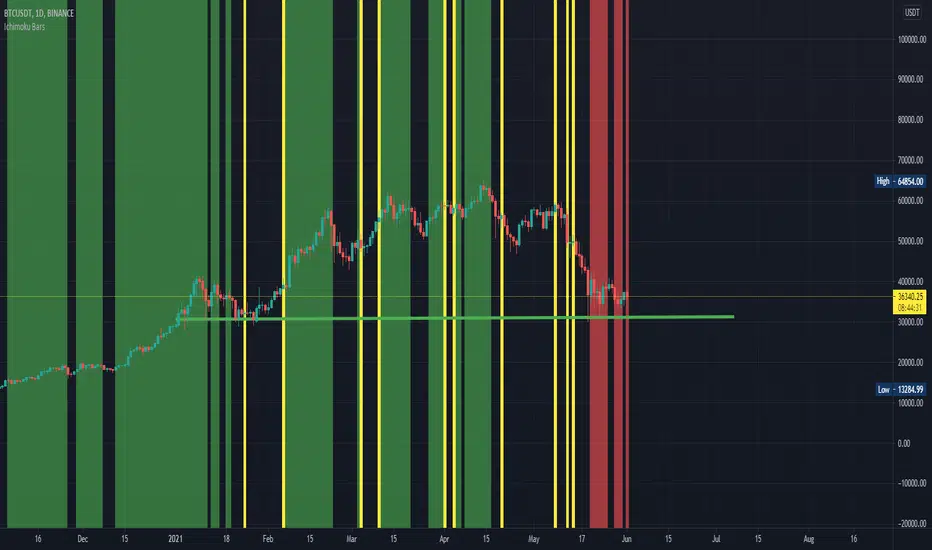
Ichimoku BarsThis script follows off the principles of the Ichimoku Cloud indicator. The green zones display optimal time to buy according to the Ichimoku model. The red zones show optimal time to sell according to the Ichimoku model inverse. The yellow zones show where the conversion line meets the base line (potential up or down movement at this point). Feel free to contact me to fix any problems or add additional info.
MTF Ichimoku [Takazudo]- A multi time frame Ichimoku with messy hint highlights.
- Most of MTF Ichimoku scripts doesn't handle Chikou-span's place correctly. This script does.
- This script was made to refer the 1day timeframe Ichimoku in lower timeframes.
- I use 1day timeframe mainly. But my entry is always in 4h or 1h timeframe.
OANDA:USDJPY
Ichimoku with shift (Pink)Hello traders you can easy shift cloud and chikou span(Apply positive and negative shifts)
Kind regards Ehsan(pinklove)
