VIX Implied MovesKey Features:
Three Timeframe Bands:
Daily: Blue bands showing ±1σ expected move
Weekly: Green bands showing ±1σ expected move
30-Day: Red bands showing ±1σ expected move
Calculation Methodology:
Uses VIX's annualized volatility converted to specific timeframes using square root of time rule
Trading day convention (252 days/year)
Band width = Price × (VIX/100) ÷ √(number of periods)
Visual Features:
Colored semi-transparent backgrounds between bands
Progressive line thickness (thinner for shorter timeframes)
Real-time updates as VIX and ES prices change
Example Calculation (VIX=20, ES=5000):
Daily move = 5000 × (20/100)/√252 ≈ ±63 points
Weekly move = 5000 × (20/100)/√50 ≈ ±141 points
Monthly move = 5000 × (20/100)/√21 ≈ ±218 points
This indicator helps visualize expected price ranges based on current volatility conditions, with wider bands indicating higher market uncertainty. The probabilistic ranges represent 68% confidence levels (1 standard deviation) derived from options pricing.
Implied-volatility

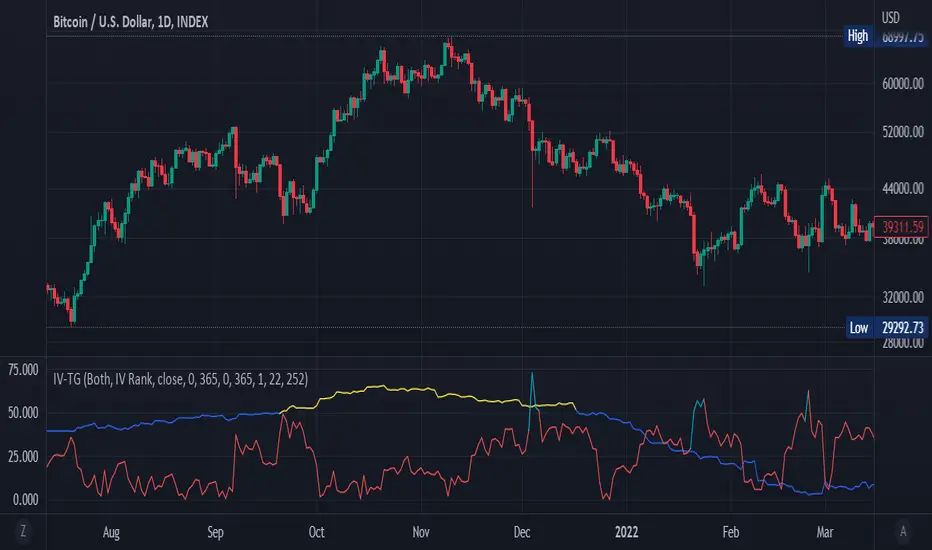
Implied Volatility Suite (TG Fork)Displays the Implied Volatility, which is usually calculated from options, but here is calculated indirectly from spot price directly, either using a model or model-free using the VIXfix.
The model-free VIXfix based approach can detect times of high volatility, which usually coincides with panic and hence lowest prices. Inversely, the model-based approach can detect times of highest greed.
Forked and updated by Tartigradia to fix some issues in the calculations, convert to pinescript v5 and reverse engineered to reproduce the "Implied Volatility Rank & Model Free IVR" indicator by the same author (but closed source) and allow to plot both model-based and model-free implied volatilities simultaneously.
If you like this indicator, please show the original author SegaRKO some love: