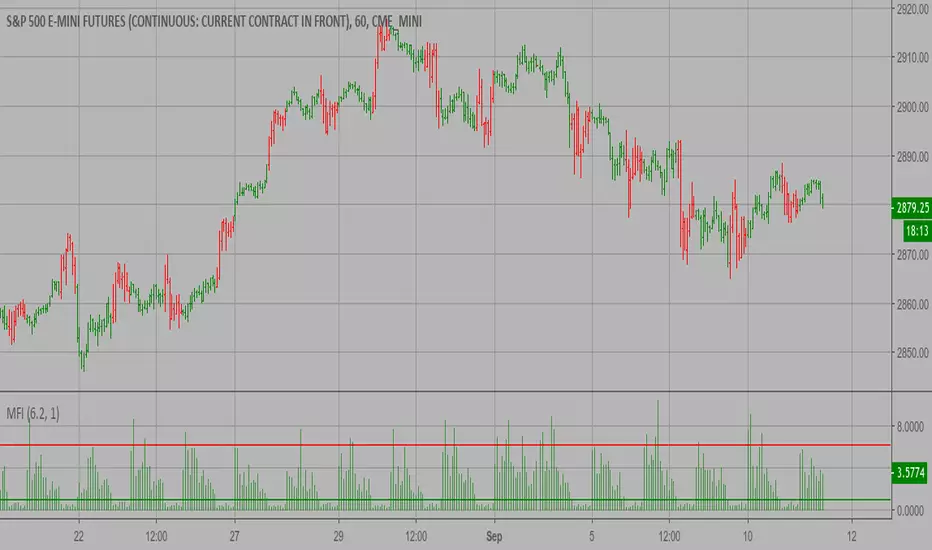
Market Facilitation Index (MFI) Strategy The Market Facilitation Index is an indicator that relates price range to
volume and measures the efficency of price movement. Use the indicator to
determine if the market is trending. If the Market Facilitation Index increased,
then the market is facilitating trade and is more efficient, implying that the
market is trending. If the Market Facilitation Index decreased, then the market
is becoming less efficient, which may indicate a trading range is developing that
may be a trend reversal.
WARNING:
- This script to change bars colors.
Index
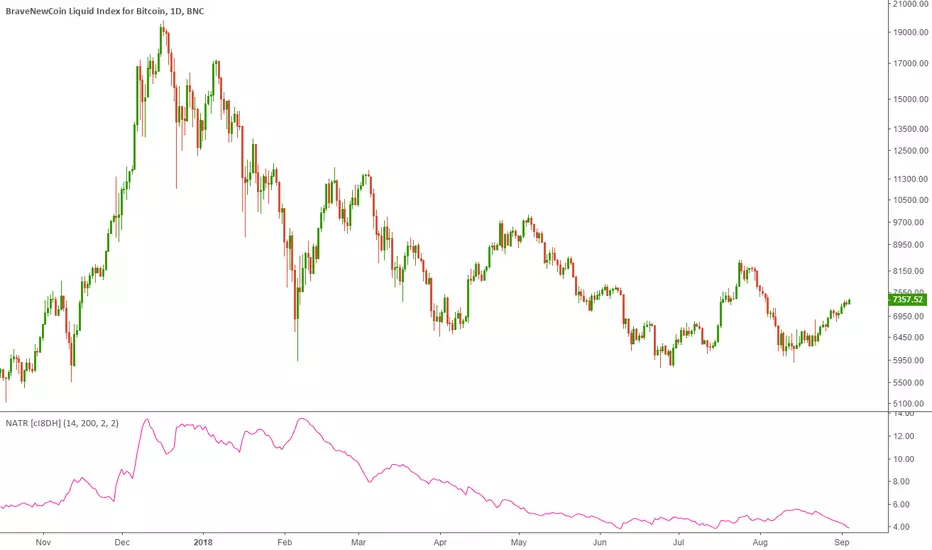
Normalized Average True Range (NATR) (Volatility) [cI8DH]As you can see in the chart below, regular ATR is not useful for long term analysis. Normalizing it, fixes the issue. This indicator can be used to measure absolute volatility. It has a built-in stochastic as well for relative volatility. ATR counts high and low in the equation unlike Bolinger Band Width.
Stochastic:
OJLJ Synthetic CAD IndexThis script uses information of the principal CAD pairs to create an Index:
(X). We can see a difference between the CAD INDEX force that has decrease a lot and it means that CAD will raise again, making AUDCAD to go down
(Y). The AUDCAD chart has problems with it trend but we can be more confident about the trend if we look at the CAD INDEX trend were we can see a down trend
The mathematic methodology is private, but it uses percentile changes to be calculated and I have made some tests to make sure that results work perfectly fine, If you want to know more about the calculation or the test I have made, please send me a message
This indexes offer a way to:
+ Measure changes in an economy without being compared with another as the Forex pairs do
+ Analyze macroeconomic variables in the exchange rate of a determinate economy
+ Use candles instead of lines
+ The script have an input option were you can decide if use wicks or not (Not recomendable)
+ White color means it goes up while red means it goes down
+ The script works perfectly with all the time frames
+ Itcan be used with all the Forex pairs that include CAD
Because of all the data used to be calculated this script normally compile after 10-20 seconds
I thought a lot about it and I did a lot of tests, Technical Indicators don’t work the same way that Forex, this index were created and published principaly for users who have more interest in the Fundamental analysis but It can be useful for everyone
Do you like this Index or have any Ideas ? Please let me know with a comment :)

OJLJ Sintetic EUR IndexThis script uses information of the principal EUR pairs to create an Index:
(). Look at the increase in the EUR INDEX, it is very good and stable while the EURCHF pair is having problems
(X). While EURCHF goes down slowly, we can see that the real EUR force is not growing but it is not going down, is just stable
(Y). The EURCHF goes down rapidly, but we dont see the same effect on the EURCHF chart, this means that the CHF force increase is not the enough strong to make the EUR INDEX to go down
The mathematic methodology is private, but it uses percentile changes to be calculated and I have made some tests to make sure that results work perfectly fine, If you want to know more about the calculation or the test I have made, please send me a message
This indexes offer a way to:
+ Measure changes in an economy without being compared with another as the Forex pairs do
+ Analyze macroeconomic variables in the exchange rate of a determinate economy
+ Use candles instead of lines
+ The script have an input option were you can decide if use wicks or not (Not recomendable)
+ White color means it goes up while red means it goes down
+ The script works perfectly with all the time frames
+ Itcan be used with all the Forex pairs that include USD
Because of all the data used to be calculated this script normally compile after 10-20 seconds
I thought a lot about it and I did a lot of tests, Technical Indicators don’t work the same way that Forex, this index were created and published principaly for users who have more interest in the Fundamental analysis but It can be useful for everyone
Do you like this Index or have any Ideas ? Please let me know with a comment :)
OJLJ Sintetic USD IndexThis script uses information of the principal USD pairs to create an Index:
(A). USDCAD chart is going up very fast, but If we see the USD INDEX we can see that the dollar is not doing the same.
(X). While USDCAD chart goes up with problems making investors to be afraid of a change the USD INDEX shows a normal and very stable increase
(Y). The USDCAD chart shows an importante decrease but after some time it goes to the initial position, the USD INDEX dont go down because the dollar force is the same, this means that the canadian dollar force has increase too
The mathematic methodology is private, but it uses percentile changes to be calculated and I have made some tests to make sure that results work perfectly fine, If you want to know more about the calculation or the test I have made, please send me a message
This indexes offer a way to:
+ Measure changes in an economy without being compared with another as the Forex pairs do
+ Analyze macroeconomic variables in the exchange rate of a determinate economy
+ Use candles instead of lines
+ The script have an input option were you can decide if use wicks or not (Not recomendable)
+ White color means it goes up while red means it goes down
+ The script works perfectly with all the time frames
+ Itcan be used with all the Forex pairs that include USD
Because of all the data used to be calculated this script normally compile after 10-20 seconds
I thought a lot about it and I did a lot of tests, Technical Indicators don’t work the same way that Forex, this index were created and published principaly for users who have more interest in the Fundamental analysis but It can be useful for everyone
Do you like this Index or have any Ideas ? Please let me know with a comment :)

Sintetic Index Creation (USD, CAD, EUR)To be able to have access to my script please get in contact with me, is for free and IF you ask you will have access and also I will send a document with more information about the mathematic methodology (Is only in Spanish)
In the chart the first one is an USD index, the second a CAD index and the last is the EUR index
This script uses information of the following pairs to create an Index:
("FX:EURCAD"), ("FX:GBPCAD"), ("FX:NZDCAD"), ("FX:AUDCAD"), ("FX:USDCAD") // CAD
("FX:USDCAD"), ("FX:USDJPY"), ("FX:USDCHF"), ("FX:USDMXN"), ("FX:USDSEK") // USD
("FX:EURNZD"), ("FX:EURGBP"),("FX:EURJPY"), ("FX:EURCHF"), ("FX:EURUSD") // EUR
The mathematic methodology is private, but it uses percentile changes to be calculated
This indexes offer a way to:
+ Analyze macroeconomic variables in the exchange rate of a determinate economy
+ Measure changes in an economy without being compared with another as the Forex pairs do
+ The script have an input option were 1 creates an USD index, 2 creates a CAD index and 3 creates an EUR index
+ White color means it goes up while red means it goes down
+ The script works perfectly with all the time frames
Because of all the data used to be calculated this script normally compile after 20-30 seconds, the index is created as candles but is important to say that it only represent the open and close values because plot the high and low values is very hard and the script could use 3 or 4 times more to compile as it could have errors in calculation too
I thought a lot about it and I did a lot of tests, Technical Indicators don’t work on this index, this index were created and published for users who have more interest in the Fundamental analysis

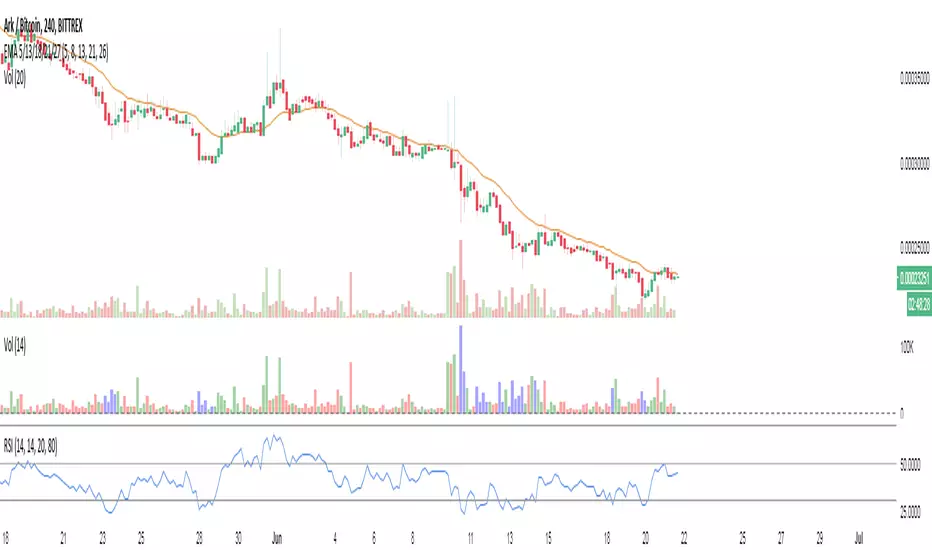
Relative Strength Index Multi Time frame RSII am always checking RSI on 1hr, 4Hr and Day RSI.
Having to switch is annoying so wrote this little script to show RSI on upto 5 time frames.
The green bold line is the current time frame, and you can change the other 4 to what you prefer.
If one time frame is over sold or overbought you can change the back to indicated a buy or sell etc.
Anyway thought I would share it.
If you like it, please click the like button.

One Shot Multiview Volume Index by letsplayantsThe theory supporting the indicator is as follows.
1. Set the volume index based on the closing price of positive and negative trading days, respectively.
2. Identify the intersection of each volume index and find the volume index of the positive trading day as the buying point when it overtakes the volume index of the negative trading day.
지표를 뒷받침하는 이론은 다음과 같습니다.
1. 긍정적, 부정적 매매일의 종가를 기준으로 각각 볼륨 인덱스를 설정한다.
2. 각각의 볼륨익덱스의 교차점을 파악하여 긍정적 매매일의 볼륨인덱스가 부정적 매매일의 볼륨인덱스를 추월할 때 매수 시점으로 파악한다.

Inverted Yield Curve with VIX Fear IndexUS 2 year and US 10 year comparison, inverted yield curve with VIX. I use this on a weekly chart with 2 moving averages, the 40 week (ma200 daily) and the 520 week (10 year median).
The bottom histogram is the VIX and the plot is the yield curve. When the VIX is above a certain level (you can set it in settings) and the ýield curve is close to or at inversion the background goes red.
The last seven recessions were preceded by an inverted yield curve. Here I combined the two main fear indexes, the VIX and the run for safe US treasuries (Inverted Yield Curve).
This is preset to the 2 year and 10 year US bond, weekly, and the normal VIX ticker but you can set it to whatever you like.
Published with source code for anyone to modify. Please comment below if you do so! This is the second in a series of indicators I intend to publish as a package of economic recoverty/recession symptom indicators.
Follow me for updates, next one up is commodities with dr Copper and oil!

SMI-VIX-SPY-NDX-Index
This script offers an SMI index of VIX, SPY, and NDX. Rather than overlaying VIX, NDX and SPY on the same chart.
It's much easier to see the correlation between VIX's price and NDX / SPY price in this manner.
Thanks to Buckkets & William Blau for the TSI smoothing method.

Kripto Index (KRIN) [WOZDUX]Created cryptocurrency index in the image and likeness of the Dow Jones. for this we have created a virtual cryptoperthite. This portfolio was formed on 7-08-2014, when allegedly purchased for 1 thousand dollars of each cryptocurrency. On that date, make a certain quantity amount of cryptocoins depending on the value. If bought 5 coins, then spent 5 thousand dollars. In the future, we calculate the current value of this portfolio and divide by 5000 to get a parameter showing how much the value of this crypto-portfolio has dared.
I used two dates. The first date is August 7, 2014 and 5 coins were used, the second date is January 1, 2015 and 6 coins were used.
The green line corresponds to the first date and the blue line corresponds to the second date. Thus, we obtain two variants of the crypto index.
With this crypto index ( abbreviated name-KRIN), you can observe the aggregate price movement of the crypto community.

Volume/Rsi Overbought/oversoldI present you my last indicator. A volume indicator that indicates overbought and oversold based on the rsi, I chose the rsi because the most used surment, this indicator allows you to identify the overbought and oversold areas of the rsi with the colors blue (oversold) and orange (overbought ) on the volume indicator! Hoping that you are useful
Security Tracker - BronzeThis Indicator will be the most simple form of this code, with Silver and Gold versions to come.
Tracked Security - BTCUSD in this example but can be changed anything.
Index - Current Security / Tracked Security
Inverse Index - (1 / Index)
(Current Security = ETHUSD in this example)
Works across all periods and Securities.
Can format lines and colours, but won't be appropriate to plot all three lines at once.
Easily see currency pair without cluttering up your chart or requiring another chart (especially for members with free subscriptions).
Can be BTC vs SNP...if you wanted, something which you couldn't find in the standard list.
I have experimented with several combinations, but if there are any issues, let me know.

Commodity Channel Index Plus (CCI+)Same CCI you love, but with a candle highlighter, control over Overbought & Oversold Line placement, and Alert Conditions for Overbought & Oversold and Recoveries, built right in.
Set the Overbought/Oversold Lines anywhere you want... use them to create CCI+ Alerts.

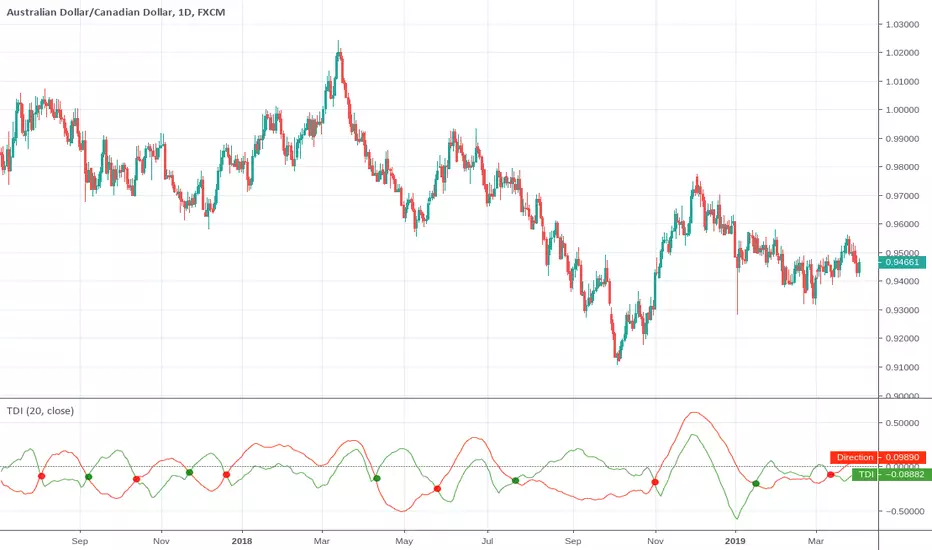
Traders Dynamic Index Pro by YardleyRosetteThis is an excellent indicator thanks to the code author LazyBear!
I have modified to a more appealing colors visually representing market condition.
2 Backgrounds
Uptrend/Sell: Uptrend above Orange line, Sell potential area.
Downtrend/Buy: Downtrend under Orange line, Buy potential area.
I have modified by adding previously unrecognized upper and lower channels of support/resistance zones within Traders Dynamic Index which will be of great use in previously confusing situations.
The Traders Dynamic Index, observes trend direction , market strength , and market volatility .
To be used by the "elite", the Pro accounts.
Multiple Time Frames are ABSOLUTELY required. I'm sorry for those who aren't. I can refer you who don't, to try out KK_Traders Dynamic Index Higher Timeframe (by Kurbelklaus).
Multiple Time Frames are necessary or else technical analysis using this one chart alone will give false reasoning as I have witnessed a few who do attempt to use this time machine, including me when I had not used multiple time frame charts since I did not have the PRO account.
Problems, for example low time frame indicates 'overbought' yet higher time frame indicates it had been oversold. Which are you to agree with? The higher time frame absolutely.
In this condition though an overall retracement will very likely occur in the short-term.
Here is my clever explanation of the rules:
Use of time frames: Traders' choice of combination.
For example, 180, 90, and 45 minute charts may be useful for example with Bitcoin
You can see what may confuse others. Apparently rising as a buy signal for having green line cross up from below orange line, but 90 minute time frame thanks to this support/ resistance channel coded within T.D.I. can be observed as an alerting condition. Then observing 45 minute time frame notice the blue lines ("Bands") are 'squeezing' the other components you can then expect a breakout , and if its in the overbought side, at least above 56, and the 240 time frame can identify current downtrend... you know how to connect the data given by the charts: Ranging Overbought in a downtrend will breakout. 1) Overbought in downtrend: Sell, 2) Ranging to breakout, set entry order according to pattern. With probability on your side, you can set a sell stop under the tricky uptrend line when all others are wondering what will happen, you are ahead.
According to range scalping: Great Scalping
Only if orange (MBL) line steady within upper and lower midlines 40 and 60
Long, when green and red line are under 44 with green crossing over red.
The green line is above the red line
The green line is above the orange line
Short, when green and red line are above 56 with red crossing over green.
The green line is below the red line
The green line is below the orange line
Close when opposite signal is about to occur

Trend Detection IndexTrend Detection Index indicator script.
This indicator was originally developed by M.H. Pee (Stocks & Commodities V. 19:10 (54-61): Trend Detection Index).
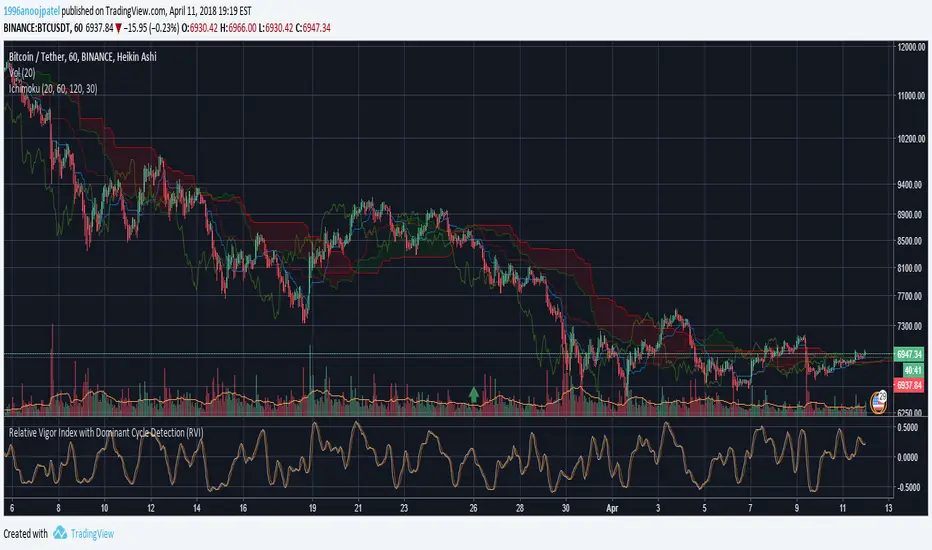
Relative Vigor Index with Dominant Cycle Detection (RVI)Relative Vigor Index with Dominant Cycle Detection. As Ehler's mentioned, fixed length look back is inherently flawed when it is possible to extract a length from a dominant price cycle. may be less effective if signal to noise ratio is greater than 2, but that usually would not happen at >5m candles, and honestly shouldn't be looking at RV(igor)I when price is moving sideways.
Read just like an RVGI, but adjusted to the current time frame. To reduce noise, changing to heiken ashi will help with signals as well. Let me know if there are improvements!
Made for JD, the OG.
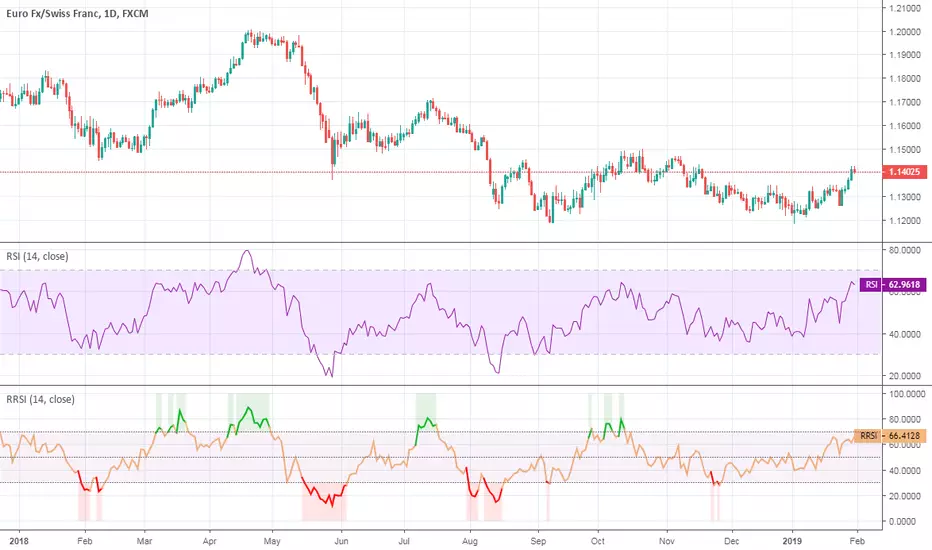
Rapid RSIRapid RSI indicator script. This indicator was originally developed by Ian Copsey (Stocks & Commodities V. 24:10 (16-23): Forex Focus).
Relative Momentum IndexRelative Momentum Index indicator script. This indicator was originally developed by Roger Altman (Stocks & Commodities V. 11:2 (57-60)).
RMI with momentum period of 1 will be equal to an RSI when they have the same period and source price.

Intraday Momentum IndexIntraday Momentum Index indicator script. This indicator was originally developed by Tushar Chande.

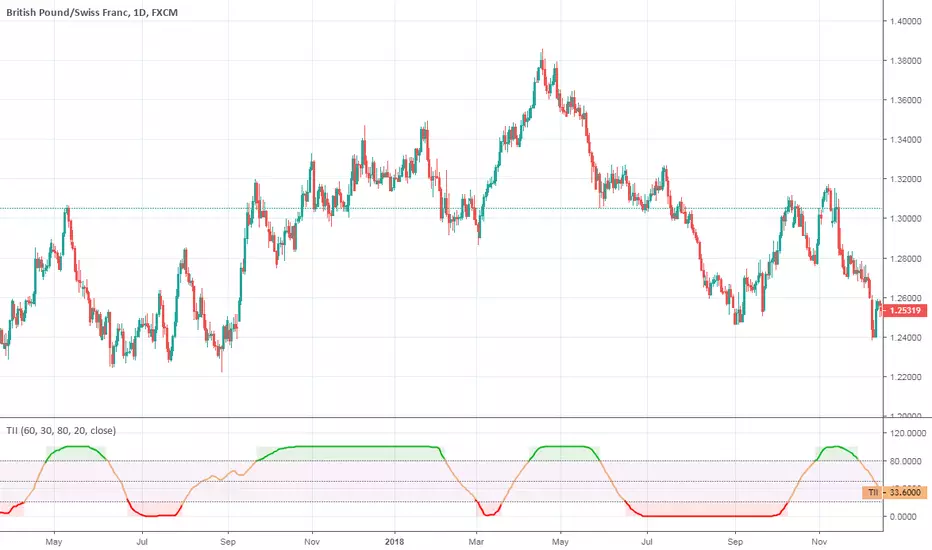
Trend Intensity IndexTrend Intensity Index indicator script. This indicator was originally developed by M. H. Pee (06/2002 issue of Stocks and Commodities Magazine)
Normalized Relative Vigor IndexThis is the Relative Vigor Index indicator just multiplied by 100 to have non-zero integer part

Perfomance index The Performance indicator or a more familiar term, KPI (key performance indicator),
is an industry term that measures the performance. Generally used by organizations,
they determine whether the company is successful or not, and the degree of success.
It is used on a business’ different levels, to quantify the progress or regress of a
department, of an employee or even of a certain program or activity. For a manager
it’s extremely important to determine which KPIs are relevant for his activity, and
what is important almost always depends on which department he wants to measure the
performance for. So the indicators set for the financial team will be different than
the ones for the marketing department and so on.
Similar to the KPIs companies use to measure their performance on a monthly, quarterly
and yearly basis, the stock market makes use of a performance indicator as well, although
on the market, the performance index is calculated on a daily basis. The stock market
performance indicates the direction of the stock market as a whole, or of a specific stock
and gives traders an overall impression over the future security prices, helping them decide
the best move. A change in the indicator gives information about future trends a stock could
adopt, information about a sector or even on the whole economy. The financial sector is the
most relevant department of the economy and the indicators provide information on its overall
health, so when a stock price moves upwards, the indicators are a signal of good news. On the
other hand, if the price of a particular stock decreases, that is because bad news about its
performance are out and they generate negative signals to the market, causing the price to go
downwards. One could state that the movement of the security prices and consequently, the movement
of the indicators are an overall evaluation of a country’s economic trend.
