Time Anchored Intraday High/Low TrendlineOftentimes, intraday trendlines that are started at specific times, e.g. 8:00am or market open 9:30am, are well respected throughout the trading day.
This indicator draws up tp 3 intraday trendlines that are anchored at user defined times, respectively at the corresponding candle's high and low points.
From there, the line*s xy2 are connected in a way that all following candles are enclosed.
Intraday
Know your Monthly, Weekly, Daily LevelsThis script will show monthly, weekly and daily (with or without pre market) levels on your intraday chart. You can chose what values of the corresponding candles (high, low, close) should be included.
Please consider following limitations:
1. Maximum of 500 drawing objects per chart
To make sure the most relevant levels are shown, values are sorted based on the latest close value before levels > 500 are cut off.
2. Lookback history
The max lookback history is limited by the currently selected timeframe. E.g. on a 5min timeframe, 20000 bars (Premium Plan) result in approx. 5 months of lookback period, meaning you may want to have a 30 min or higher chart open to get a complete picture of levels, while trading on a lower timeframe.
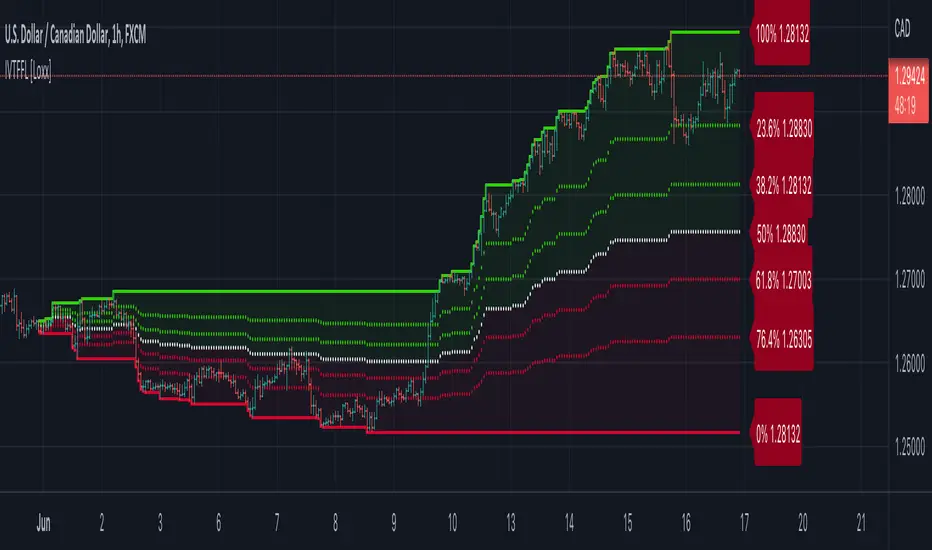
Intra-variety Timeframe Floating Fibonacci Levels [Loxx]Intra-variety Timeframe Floating Fibonacci Levels is an intraday, intraweek, and intramonth indicator to be used for scalping on lower timeframes. The indicator paints the developing fibonacci retracement levels as they change overtime over the selected intra-variety timeframe chosen. This indicator acts as another way to gauge support and resistance levels.
What Are Fibonacci Retracement Levels?
Fibonacci retracement levels—stemming from the Fibonacci sequence—are horizontal lines that indicate where support and resistance are likely to occur.
Each level is associated with a percentage. The percentage is how much of a prior move the price has retraced. The Fibonacci retracement levels are 23.6%, 38.2%, 61.8%, and 78.6%. While not officially a Fibonacci ratio, 50% is also used.
The indicator is useful because it can be drawn between any two significant price points, such as a high and a low. The indicator will then create the levels between those two points.
Suppose the price of a stock rises $10 and then drops $2.36. In that case, it has retraced 23.6%, which is a Fibonacci number. Fibonacci numbers are found throughout nature. Therefore, many traders believe that these numbers also have relevance in financial markets.
Fibonacci retracement levels were named after Italian mathemetician Leonardo Pisano Bigollo, who was famously known as Leonardo Fibonacci. However, Fibonacci did not create the Fibonacci sequence. Fibonacci, instead, introduced these numbers to western Europe after learning about them from Indian merchants. Fibonacci retracement levels were formulated in Ancient India between 450 and 200 BCE.
Details
-Change Fibonacci levels
-Select day, week, or month timeframe
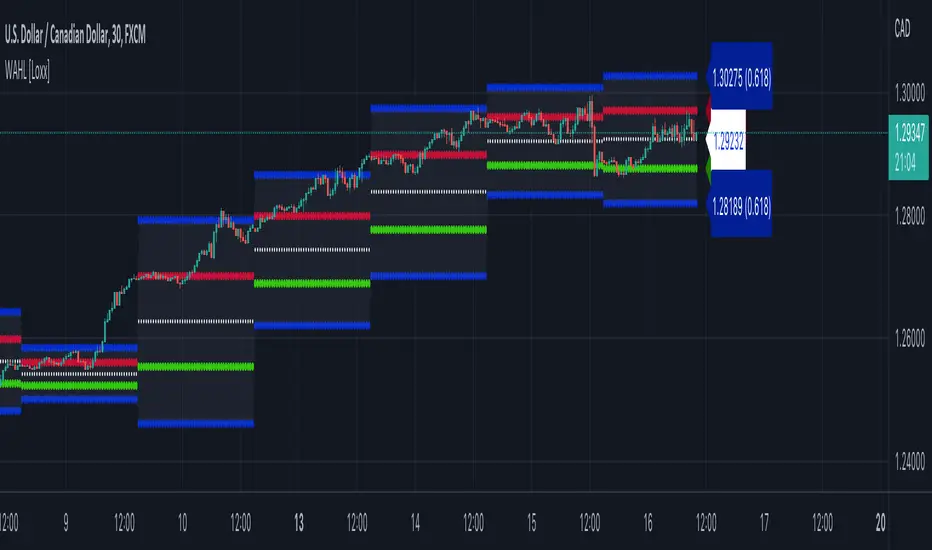
Waddah Attar Hidden Levels [Loxx]Waddah Attar Hidden Levels is a dynamic indicator of support of resistance built by Ahmad Waddah Attar
Details
-Uses data from the Daily time frame only
-Used for intraday trading, restricted to timeframes 1 hour and below
-Best Time Frames 15, 30, 60 minutes
-Draws support and resistance lines on chart inside a boundary of fibonacci levels
How to use Waddah Attar Hidden Levels
-Breakout trading indicator
-Buy at the broken red line, or insert pending buy order
-Sell at the broken green line, or insert pending buy order
-Take profit/Stop-loss at blue lines
Intrabar Polarity DivergencesTradingview Pinescript just introduced a new exciting ability to get intrabars candle information from a higher time frame chart!
This indicator is based on Tradingview example but with enhanced capabilities to show the percentage of intrabars opposite bars with the ability to display the mid-day candle close price drawn by a blue line.
This indicator can show you that in some cases a GREEN candle on the daily chart, for example, can have more red candles in a lower time frame. which may or may not indicate on a change of direction :)
This is an ongoing experiment and I plan to release more indicators based on these new pinescript capabilities.
Like if you like and Follow to stay updated!

Intraday Candle Finder (Works on all Markets!!!) Todays scripts is for the INTRADAY Traders who would use a timeframe setup like (3m,5m,10,15m)
This script is a candle filter for Pulllbacks, Rally Candle, Hammers.
Ive added a new condition = RSI Overbought for the Rally Candle and Oversold for the Pullback to eliminate weak candles.
Also there is a ema filter if you want to only use the pullbacks above '50ema' etc...
Rules
1) Price action must be in place before we look for the signals
2) Trade in high probably areas such as Demand and Supply zones /// Support and Resistance zones
3) Dont trade Pullbacks when sentiment is Bearish
4) Dont trade Rallys when sentiment is Bullish
Pullback candle on INTRADAY TIMEFRAME
This was taken from ADA/USDT 31/05/2022 (Recent)
10M chart
Forex Example
Rally Candle on INTRADAY TIMEFRAME
This was taken from AXS/USDT 31/05/2022 (Recent)
Forex Example
How to trade this candles.
Stop loss = ATR *1 minimum
Take Profit = RR of either 4/5 when the market is trending // When the market is ranging - look to key levels for take profit
Im open to ideas to improve this script for the INTRADAY Traders as I'm more of a Swing Trader
If you enjoy this script please leave a like and comment as your support is much appreciated.

FCPO IntradayThis script is specially developed for the reference of Crude Palm Oil Futures ( CPO ) market traders.
Before using this script, traders need to know a few important things, namely:
1. Use of this script is limited to the Crude Palm Oil Futures ( CPO ) market only;
2. The appropriate time-frame for the purpose of using this script is 30 minutes.
Procedures for using indicators.
1. The line on the trading day will only be known after the first candle is completed, i.e. at 10:59:59 am;
2. Then, key in order.
Entry.
The recommended max Entry is once Long and once Short only on the same day.
Long.
1. Traders can only make a purchase when the market price hits the green line;
2. If traders hold a long position, traders can make a sale to close the long position when the price hits the blue line.
Short.
1. Traders can only make a sale when the market price hits the red line;
2. If traders hold a short position, traders can make a purchase to close the short position when the price hits the orange line.

Shinohara Intensity Ratio (SIR)Shinohara Intensity Ratio (SIR) - the indicator
This indicator is used to make clear the intensity of the trend. It shows the possible trend of the price. If the price is in an uptrend or in a downtrend, the indicator shows when you can buy or sell or get out. A good example can be seen in the chart with natural gas, a few days earlier it was already seen that a trend reversal was imminent. Shinohara indicator has already indicated it a few days before.
SIR preset
Period: last 26 periods
Strong ratio: green line "GL"
Weak ratio: red line "RL"
What shows you SIR indicator
It has two lines. The strong ratio line is colored in green and the weak ratio line in red.
When the "GL" is above the "RL", this is the indication of price is an uptrend. When the "RL" is above the "GL", it indicates the price in the downtrend.
The increasing of ratio is the sign of trend intensity is increasing. In the high value of the SIR indicator trend reversal may soon.
SIR indicator line is around 100, this indicating the intensity of the price is average.
SIR line is above 120, the intensity of starting a strong trend
SIR line is above 200 or more this indication of the extreme intensity of the trend
Using Strategy
Buy Signal: "GL" is rising above the 120 and the "RL" is below the 100 level
Sell Signal: "RL" is rising above the 120 level and the "GL" is below 100 level
When the "GL" & "RL" (both lines) are rising above 120 or more then you should avoid taking any position
You can take profit or close your position, if the indicator line moving above the 200 level, then you should alert. If the price trend starts reversing, then you can close your position.

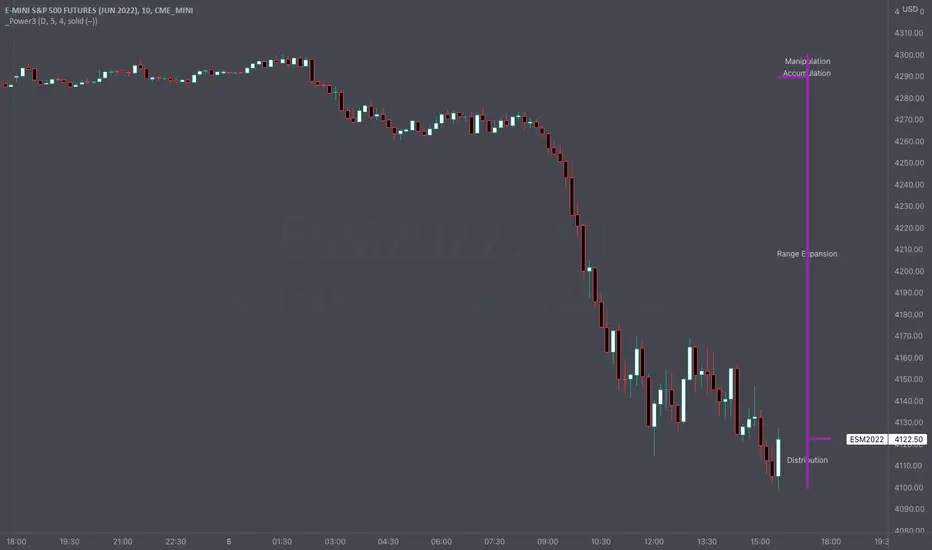
Intraday Power 3 VisualDescription
This indicator draws a dynamic "Open High Low Close" type visual on intraday charts so the trader can easily keep track of the daily/weekly movement. This indicator was inspired by the Inner Circle Trader’s (ICT) “Power 3” concept, which is Accumulation, Manipulation, and Distribution of price on a daily timeframe.
Visual
This indicator plots the chosen timeframes opening price along with a live line for the current price. This makes it very easy to identify the daily/weekly range along it’s open. And the user can combine this indicator with my other indicator “Futures Exchange Sessions” to plot the midnight EST & 8:30 AM EST lines to get a great summation of over night price action.
Inputs and Style
In the Input section the user can dynamically switch between Daily and Weekly timeframes. Built in ability to move the entire Visual to the right makes preventing indicator overlap a breeze. All of the lines can be configured: color, style, and width. Independently toggle ON/OFF the Power 3 labels (Accumulation, Manipulation, Range Extension, Distribution) and can change labels color. The labels dynamically move and switch positions based upon bear or bull daily/weekly range.
Special Notes
The Futures market is open 23/5. It is closed everyday for 1-hour at 5pm EST and closed over the weekends. Because this Intraday Power 3 Visual is drawing in the 'future' on the users TradingView chart, when the visual is close or in a time when the market is closed, the visual doesn't behave properly. This is because TradingView doesn't display times when the Market is closed, thus the drawings cannot be displayed during those times. There is nothing wrong with the script. Please wait until the Market is open and the visual will be drawn normally.
This indicator is intended for use in the Futures Market
Session TPO Market ProfileIntroduction
Wikipedia: A Market Profile is an intra-day charting technique (price vertical, time/activity horizontal) devised by J. Peter Steidlmayer, a trader at the Chicago Board of Trade (CBOT), ca 1959-1985. Steidlmayer was seeking a way to determine and to evaluate market value as it developed in the day time frame. The concept was to display price on a vertical axis against time on the horizontal, and the ensuing graphic generally is a bell shape--fatter at the middle prices, with activity trailing off and volume diminished at the extreme higher and lower prices. In this structure he recognized the 'normal', Gaussian distribution he had been introduced to in college statistics.
Important : The market profile tool is designed to be used on the 30min timeframe, however, you can modify its parameters and use it on lower timeframes (15/10/5min)
This indicators displays the following information
Session open
TPO
Value area calculation zone
POC
Highlight of Single prints
Session High/Low
The current price (TPO Profile is often used isolated without any candlesticks on it)
Parameters
Session beginning configuration (not coded with a session input yet)
Number of candles to use for calculation (default 13 for a single session)
Extend yesterday's levels (VAH/VAL/POC)
Show/Hide Market profile calculation area (background color)
Bars number (number of rows that will be used to draw the profile)
Show/Hide TPO's
TPO Colors customization (For in/out of VA, VAL/VAH/POC/High/Low levels and single prints)
Show/Hide High/Low levels
Show/Hide VAL/VAH/POC Levels as lines
Enable/Disable Single prints highlighting
Value area size (as percent)
Show/Hide current price (corresponding to a line scaled on the "close" price)
Additional Notes
Each session is drawn when the day is over
To use as much space as possible, TPO's are not directly drawn on the area of their calculation (which can be confusing if you use candlesticks directly over it)
This script will probably be updated in the future (especially concerning its implementation which is a bit spaghetti coded for now) .
If you have interesting suggestions about new features that are usual within market profile tools and missing from this script , don't hesitate to suggest it.

Session LevelsThis indicator plots important session (intraday) levels for the day. It plots high and low of previous day, week, month, 52 week and all time. Also plots the vix range which shows the daily expected trading range of the instrument. These levels acts as important support/resistance for the day.
For example, if price closes above previous day, week, or month high/low it indicates bullish sentiment and vice versa for bearish.
Vix Range plots top, center, bottom line for expected trading range for the day. It is calculated based on the volatility index selected (NSE:India VIX is used by default).

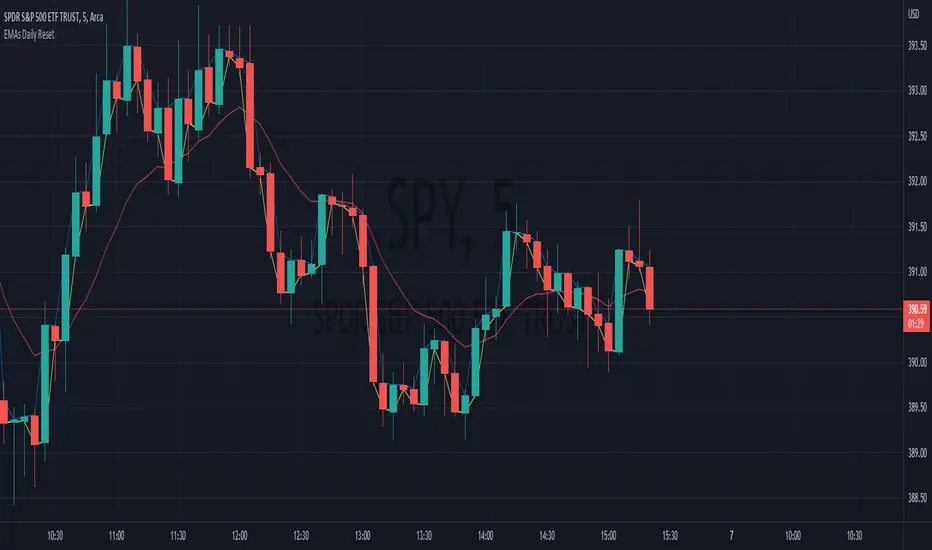
EMAs Daily ResetThis indicator displays 3 EMAs that recalculate every day.
This is useful for intraday trading by removing the bias of the previous day's ema price. This ensures your EMAs stay near the most current price action.
Note: If your length is larger than the number of bars in the day, your EMAs will not have time to properly catch up in the day.
Strat Magnitude LinesHave you ever wished you could easily see the daily magnitude line of a Strat Combo while on a smaller timeframe intraday chart? This indicator allows you to do that and much more!
Description
This indicator does two simple things, but it does them very well. The first thing it does is draw a small horizontal line at the magnitude level of a Strat Setup (a potential Strat Combo before the last candle has formed) on the daily chart. This is intended to help the user easy ascertain how much magnitude distance (distance between trigger line and magnitude line) of a potential Strat Combo the night before when the user is searching for trades to play the next trading day. If the last two candles on a daily chart form the first two bars of a Strat Combo, then this indicator display a horizontal line where the ultimate magnitude would be if the next trading day a Strat Combo was formed. This helps the trader gauge whether there is sufficient magnitude that makes it worth it to even consider trading the next day.
The second and most important thing this indicator does is display the daily magnitude line while the user is in a smaller timeframe managing their trade. This helps the user have an easily identifiable line to show where to take full or partial profit at. There is no need to keep track of manually drawn lines or the hassle of letting your charts get cluttered with lines that the user forgot to delete. This indicator finds potential Strat Combos (aka Strat Setups) and dynamically draws horizontal lines for the user and removes them when they are no longer in use. The user can focus on taking profit and making money and leave the hassle to the indicator.
Inputs & Style
All four lines (two daily lines and two intraday lines) can be independently configured. Each lines color, line style, and width can be adjusted. To turn “off” a line change the opacity to 0%.
Automatic daily magnitude line on intraday chart
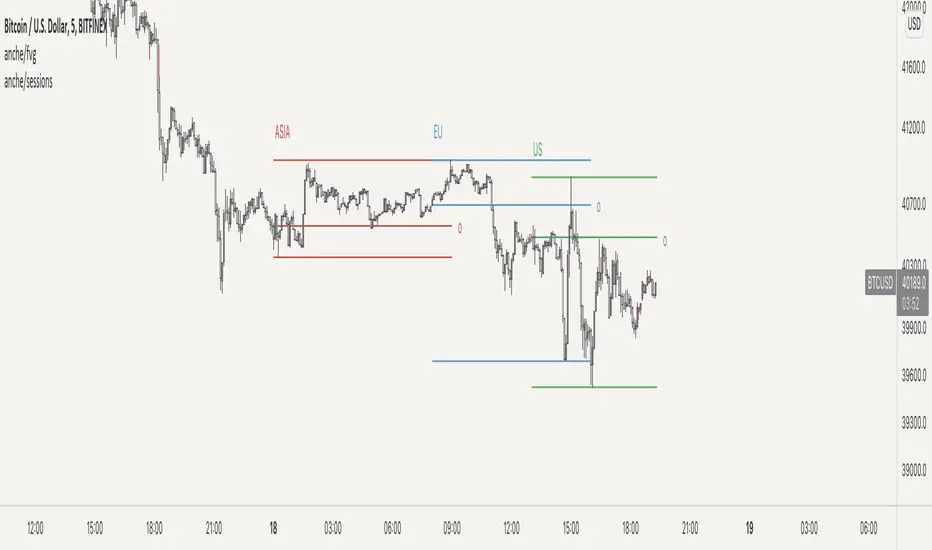
Market Sessions (including extended hours) by Anche█ MARKET SESSIONS BY ANCHE
this script allows you to define up to 4 different sessions and plot those on your chart. It makes it easy to see when these sessions started and ended and what the price level is when the session opened. It's for example beneficial to see when sessions overlap, because at those times there might be more volume , because more people are active within a market.
█ CONCEPTS
• plotting these sessions onto a chart can help you see overlap of 2 or more sessions. An overlap means more market participants, which can hint to an increase in volume .
• when the indicator shows all historic sessions, you can spot certain trends, for example that an asian market is generally more bearish and EU more bullish , or vice versa.
█ FEATURES
• up to 4 sessions
• customisable session labels
• customisable session times
• extended hours (on/off)
• timezone sync
• show past sessions
█ VISUAL FEATURES
• session plotted by top + bottom line or a box
• show session open
• customisable colors per session
• customisable lines (width/style/color)
• different visual settings for extended hours
• customisable label sizes
Anna-LysaEspecially useful when using it for stocks in intraday screening for daytrading.
This gives you quick information about the volatility at the moment when you look at the stock.
The current range of the last candles (adjustable) is calculated so that you can stop based on the Vola.
In addition, the daily volume and daily range are calculated in the table and what is left of the average.
So that you can adjust your ideas for the movement in order to take profit. No matter what the timeframe, you can see how the volume compares to that of the previous few candles and thus anticipate the most likely breakout.
Then the most relevant day trading levels ( Premarkets, Lastday high/lows and some Ma´s ) are shown so that you can get a very fast overview of the stock at the moment.
All levels and labels and colors are adjustable or hidden in the settings.

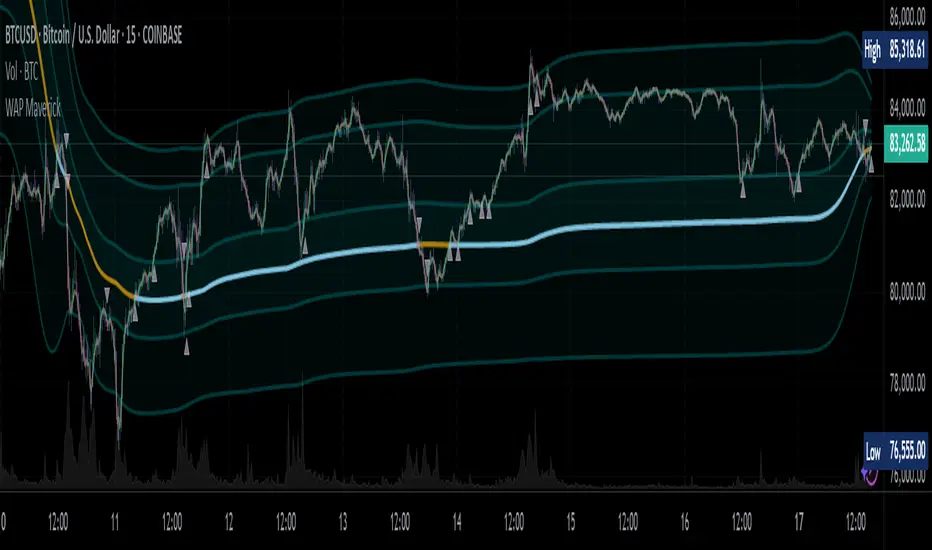
WAP Maverick - (Dual EMA Smoothed VWAP) - [mutantdog]Short Version:
This here is my take on the popular VWAP indicator with several novel features including:
Dual EMA smoothing.
Arithmetic and Harmonic Mean plots.
Custom Anchor feat. Intraday Session Sizes.
2 Pairs of Bands.
Side Input for Connection to other Indicator.
This can be used 'out of the box' as a replacement VWAP, benefitting from smoother transitions and easy-to-use custom alerts.
By design however, this is intended to be a highly customisable alternative with many adjustable parameters and a pseudo-modular input system to connect with another indicator. Well suited for the tweakers around here and those who like to get a little more creative.
I made this primarily for crypto although it should work for other markets. Default settings are best suited to 15m timeframe - the anchor of 1 week is ideal for crypto which often follows a cyclical nature from Monday through Sunday. In 15m, the default ema length of 21 means that the wap comes to match a standard vwap towards the end of Monday. If using higher chart timeframes, i recommend decreasing the ema length to closely match this principle (suggested: for 1h chart, try length = 8; for 4h chart, length = 2 or 3 should suffice).
Note: the use of harmonic mean calculations will cause problems on any data source incorporating both positive and negative values, it may also return unusable results on extremely low-value charts (eg: low-sat coins in /btc pairs).
Long version:
The development of this project was one driven more by experimentation than a specific end-goal, however i have tried to fine-tune everything into a coherent usable end-product. With that in mind then, this walkthrough will follow something of a development chronology as i dissect the various functions.
DUAL-EMA SMOOTHING
At its core this is based upon / adapted from the standard vwap indicator provided by TradingView although I have modified and changed most of it. The first mod is the dual ema smoothing. Rather than simply applying an ema to the output of the standard vwap function, instead i have incorporated the ema in a manner analogous to the way smas are used within a standard vwma. Sticking for now with the arithmetic mean, the basic vwap calculation is simply sum(source * volume) / sum(volume) across the anchored period. In this case i have simply applied an ema to each of the numerator and denominator values resulting in ema(sum(source * volume)) / ema(sum(volume)) with the ema length independent of the anchor. This results in smoother (albeit slower) transitions than the aforementioned post-vwap method. Furthermore in the case when anchor period is equal to current timeframe, the result is a basic volume-weighted ema.
The example below shows a standard vwap (1week anchor) in blue, a 21-ema applied to the vwap in purple and a dual-21-ema smoothed wap in gold. Notably both ema types come to effectively resemble the standard vwap after around 24 hours into the new anchor session but how they behave in the meantime is very different. The dual-ema transitions quite gradually while the post-vwap ema immediately sets about trying to catch up. Incidentally. a similar and slower variation of the dual-ema can be achieved with dual-rma although i have not included it in this indicator, attempted analogues using sma or wma were far less useful however.
STANDARD DEVIATION AND BANDS
With this updated calculation, a corresponding update to the standard deviation is also required. The vwap has its own anchored volume-weighted st.dev but this cannot be used in combination with the ema smoothing so instead it has been recalculated appropriately. There are two pairs of bands with separate multipliers (stepped to 0.1x) and in both cases high and low bands can be activated or deactivated individually. An example usage for this would be to create different upper and lower bands for profit and stoploss targets. Alerts can be set easily for different crossing conditions, more on this later.
Alongside the bands, i have also added the option to shift ('Deviate') the entire indicator up or down according to a multiple of the corrected st.dev value. This has many potential uses, for example if we want to bias our analysis in one direction it may be useful to move the wap in the opposite. Or if the asset is trading within a narrow range and we are waiting on a breakout, we could shift to the desired level and set alerts accordingly. The 'Deviate' parameter applies to the entire indicator including the bands which will remain centred on the main WAP.
CUSTOM (W)ANCHOR
Ever thought about using a vwap with anchor periods smaller than a day? Here you can do just that. I've removed the Earnings/Dividends/Splits options from the basic vwap and added an 'Intraday' option instead. When selected, a custom anchor length can be created as a multiple of minutes (default steps of 60 mins but can input any value from 0 - 1440). While this may not seem at first like a useful feature for anyone except hi-speed scalpers, this actually offers more interesting potential than it appears.
When set to 0 minutes the current timeframe is always used, turning this into the basic volume-weighted ema mentioned earlier. When using other low time frames the anchor can act as a pre-ema filter creating a stepped effect akin to an adaptive MA. Used in combination with the bands, the result is a kind of volume-weighted adaptive exponential bollinger band; if such a thing does not already exist then this is where you create it. Alternatively, by combining two instances you may find potential interesting crosses between an intraday wap and a standard timeframe wap. Below is an example set to intraday with 480 mins, 2x st.dev bands and ema length 21. Included for comparison in purple is a standard 21 ema.
I'm sure there are many potential uses to be found here, so be creative and please share anything you come up with in the comments.
ARITHMETIC AND HARMONIC MEAN CALCULATIONS
The standard vwap uses the arithmetic mean in its calculation. Indeed, most mean calculations tend to be arithmetic: sma being the most widely used example. When volume weighting is involved though this can lead to a slight bias in favour of upward moves over downward. While the effect of this is minor, over longer anchor periods it can become increasingly significant. The harmonic mean, on the other hand, has the opposite effect which results in a value that is always lower than the arithmetic mean. By viewing both arithmetic and harmonic waps together, the extent to which they diverge from each other can be used as a visual reference of how much price has changed during the anchored period.
Furthermore, the harmonic mean may actually be the more appropriate one to use during downtrends or bearish periods, in principle at least. Consider that a short trade is functionally the same as a long trade on the inverse of the pair (eg: selling BTC/USD is the same as buying USD/BTC). With the harmonic mean being an inverse of the arithmetic then, it makes sense to use it instead. To illustrate this below is a snapshot of LUNA/USDT on the left with its inverse 1/(LUNA/USDT) = USDT/LUNA on the right. On both charts is a wap with identical settings, note the resistance on the left and its corresponding support on the right. It should be easy from this to see that the lower harmonic wap on the left corresponds to the upper arithmetic wap on the right. Thus, it would appear that the harmonic mean should be used in a downtrend. In principle, at least...
In reality though, it is not quite so black and white. Rarely are these values exact in their predictions and the sort of range one should allow for inaccuracies will likely be greater than the difference between these two means. Furthermore, the ema smoothing has already introduced some lag and thus additional inaccuracies. Nevertheless, the symmetry warrants its inclusion.
SIDE INPUT & ALERTS
Finally we move on to the pseudo-modular component here. While TradingView allows some interoperability between indicators, it is limited to just one connection. Any attempt to use multiple source inputs will remove this functionality completely. The workaround here is to instead use custom 'string' input menus for additional sources, preserving this function in the sole 'source' input. In this case, since the wap itself is dependant only price and volume, i have repurposed the full 'source' into the second 'side' input. This allows for a separate indicator to interact with this one that can be used for triggering alerts. You could even use another instance of this one (there is a hidden wap:mid plot intended for this use which is the midpoint between both means). Note that deleting a connected indicator may result in the deletion of those connected to it.
Preset alertconditions are available for crossings of the side input above and below the main wap, alongside several customisable alerts with corresponding visual markers based upon selectable conditions. Alerts for band crossings apply only to those that are active and only crossings of the type specified within the 'crosses' subsection of the indicator settings. The included options make it easy to create buy alerts specific to certain bands with sell alerts specific to other bands. The chart below shows two instances with differing anchor periods, both are connected with buy and sell alerts enabled for visible bands.
Okay... So that just about covers it here, i think. As mentioned earlier this is the product of various experiments while i have been learning my way around PineScript. Some of those experiments have been branched off from this in order to not over-clutter it with functions. The pseudo-modular design and the 'side' input are the result of an attempt to create a connective framework across various projects. Even on its own though, this should offer plenty of tweaking potential for anyone who likes to venture away from the usual standards, all the while still retaining its core purpose as a traders tool.
Thanks for checking this out. I look forward to any feedback below.
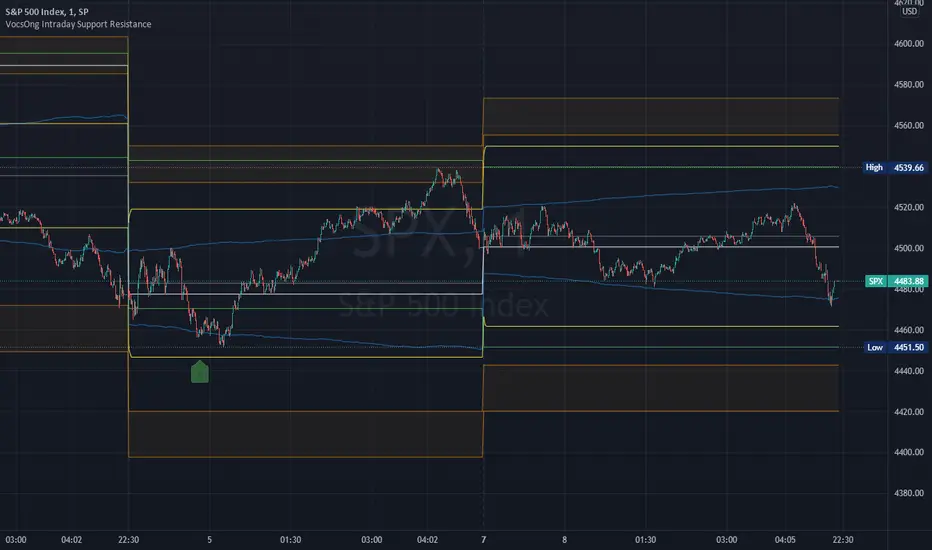
VocsOng Intraday Support ResistanceOverview
This indicator is meant for intraday trading, mainly designed for SPX . The main purpose of this indicator is to mark out the key levels of support and resistance for intraday.
There are 9 main support and resistance that forms this intraday support resistance indicator.
1. Today's Open
Today's open is often a neglected area because by default change percentage is always based on yesterday close. So having a line drawn for today's open is the very starting point.
2. Yesterday Close
3. Yesterday High
4. Yesterday Low
Yesterday Close, High, Low are important intraday trading areas, it is very common that price action resist at this area.
5. Past 4 Days Calculated Estimated High (YesterdayClose + (EstimatedRange/2) :: EstimatedRange = Nearest day x0.4, followed by 0.3, 0.2, 0.1)
6. Past 4 Days Calculated Estimated Low (YesterdayClose - (EstimatedRange/2) :: EstimatedRange = Nearest day x0.4, followed by 0.3, 0.2, 0.1)
This is a calculated estimated high/low range based on past 4 days range. Weighing the nearest day heaviest of 40%, followed by 30%, 20%, 10%.
This calculated high/low area apparently also act as good support and resistance area sometimes.
7. Expected Move High (YesterdayClose + VIX/100 * SquareRoot(1/365))
8. Expected Move Low (YesterdayClose - VIX/100 * SquareRoot(1/365))
This is the formula used to calculate expected move LIVE based on current VIX. This is based from today's open.
9. 1.5% to 2% from SPX Open today
This marks out a zone where SPX is 1.5% to 2% away from today's open. This gives a general guide on a fix percentage change based on today's open.
Statistically, SPX close within 1.5% change from today's open 93.18% of the time in the past 10 years.
How I use them?
First to note, this indicator works best on 1 minute chart. Other timeframe might not be that accurate.
All these are intraday support and resistance. They can be simply use as support and resistance by default.
In addition to that, 7,8,9 are also used as overbought/oversold indicator because they are centered to today's open.
As SPX move towards 7,8,9, it shows how overbought or oversold it is.
I use this indicator with SPX 0 dte options trading.
So as SPX approaches the oversold area, and near any of the support, I will sell a 30 wide put credit spread at 5 delta away or $1 target credit.
This trade entry goes together with a bracket take profit (80%) and stop loss (200%) OCO order.
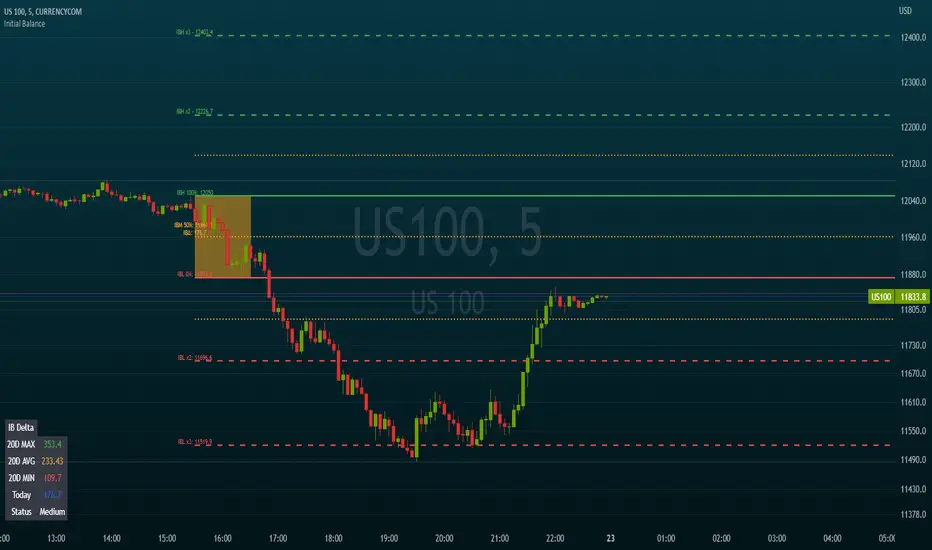
Initial BalanceThis script calculates and draws the initial balance price levels which can be really interesting for intraday activities.
Note: Obviously, you need to wait for the calculation period to finish in order to see your daily levels
The tool includes the following options
Customization of the session used to calculate the initial balance (default 0930-1030)
Show/Hide the calculation period (as a background color)
Show/Hide extra levels (report the IBH-IBL delta above and under the IB area)
Show/Hide intermediate levels (displays 50% price levels in the IB and extra areas)
Show labels (Display levels names as well as their price on corresponding lines)
Levels names:
- IBH (Initial Balance High)
- IBH (Initial Balance Low)
- IBM (Initial Balance Middle)
- IBH x2
- IBL x2
Default colors are green for high levels, red for low levels, and orange for intermediate levels
Extend levels (extends the current levels to left/right/both/none sides of the chart)
MILK (My Intraday Lazy Kit)I made this script to group information considered useful in forex day trading, of course it can be used on crypto or other markets.
First of all, feel free to suggest any improvement/new feature you would consider interesting for such an use. This is not especially a final version and I'm sure other relevant information can be added in this tool.
Current features are the following
An international clock showing time and session status (open/closed) for 5 different cities. You can modify it in parameters.
Drawings of previous days/weeks open/high/low/close prices, which will be often used as supports and resistances zones.
The Clock shows
City
Time (with a bgcolor corresponding to the "period" of the day (Morning, Afternoon, Evening, Night)
Session status (Cyan when the corresponding session is open, blue when it's closed)
Price levels names are
YTD-H : Yesterday's high
YTD-L : Yesterday's low
YTD-C : Yesterday's close
YTD-O : Yesterday's open
PWH : Previous week high
PWL : Previous week low
PWO : Previous week open
PWC : Previous week close
Levels width and colors can be modified.
You can also enable/disable the clock, and daily or weekly levels in the options panel.
Nothing more to say for now, I mainly integrated information I like to have, but I'll probably add new features in it if I get some.

RVI Relative Volume IntradayRVI Relative Volume Intraday is a simple label next to the last bar that shows the relative volume as a percentage of the ratio of today's volume to the average volume for the same intraday time period of the last five days. Useful for break-out intraday strategies.

Intraday Volume Spikes HeatmapHello friends,
Here's something truly special for intraday traders: this script identifies and visualizes abnormal volume activity clusters throughout the trading day, giving you an instant overview of when the market gets unusually active. It's designed specifically for intraday charts with volume data available.
No setups, no guesswork — just plug it in and see where volume truly spikes.
🛠 How It Works
The indicator divides the trading session into a 60×24 grid — minutes across the horizontal axis and hours down the vertical one.
It tracks each bar's volume (or price spread, or relative change — depending on your selected metric) and highlights the frequency of abnormal activity using a smooth color heatmap.
You can analyze the full chart history or focus on a specific date range.
All the data is neatly displayed in a customizable on-chart table, allowing you to instantly spot intraday periods with heightened trading activity.
🔥 Key Features
Pine Script V6 — optimized and refactored for performance and maintainability
Detects abnormal volume activity — instantly see where volume spikes most often within the day
4 analytical modes — Volume Amount, Volume % Change, High/Low Spread, and Price % Change
Configurable analysis window — use entire chart history or a specific date range
Overlay Mode — display the heatmap directly on your chart or in a separate panel
Customizable appearance — fine-tune colors, borders, text, and layout
17 professional color palettes — including Viridis, Inferno, Magma, and Plasma
Time zone offset support — align analysis with your local time if needed
📸 Visual Examples
Viridis palette
Inferno palette
If you'd like access or have any questions, feel free to reach out to me directly via DM.
👋 Good luck and happy trading!
Script a pagamento


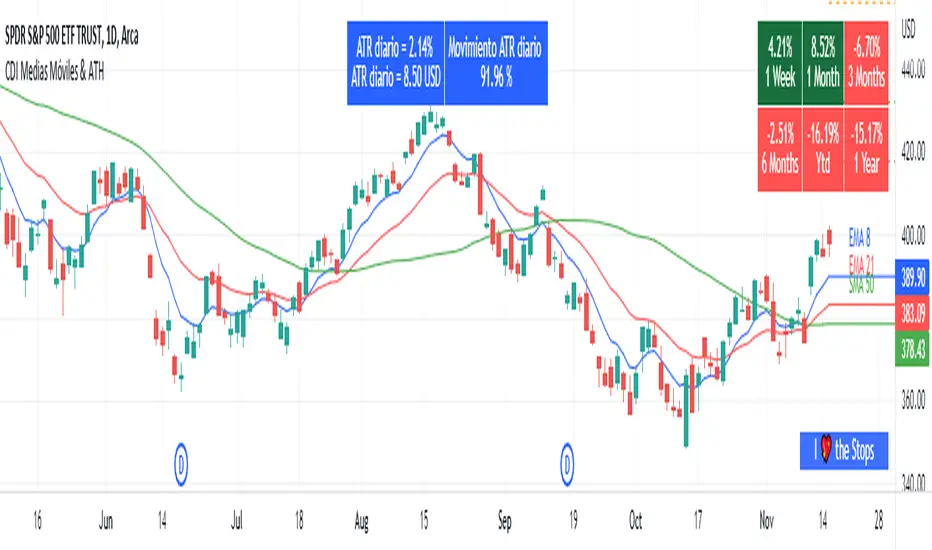
Moving Average and PerformanceThis indicator combines several tools that are used daily for analysis:
The performance of the action we are seeing.
The percentage of retracement the stock has made from its all time high.
Possibility of using up to four exponential or simple moving averages in the length we want.
It allows to see or not the levels of four moving averages in daily temporality.
This indicator is unique since it allows you to see in real time the performance of the Stock or ETF that is being analyzed, which allows you to make a timely decision for short, medium or long-term investments.
If you are doing scalping, swing, or intraday trading, you can see the retracement it has made from the ATH (3, 5, 10 or 13%) which can become Supports or Resistances where the price can rebound, Likewise, the levels of the moving averages in 1D temporality can be observed at the same time, which are usually dynamic supports or resistances and it can also be observed in the same temporality of the chart four moving averages that the trader can configure in the length that you deem convenient to improve your analysis and make decisions as quickly as possible.
Este indicador es único ya que permite ver en tiempo real el rendimiento de la Acción o ETF que se está analizando, lo cual permite tomar una decisión oportuna para las inversiones a corto, mediano o largo plazo.
Si se está haciendo trading tipo scalping, swing, o intradía, se puede observar el retroceso que ha hecho desde el ATH (3, 5, 10 o 13%) el cual puede convertirse en Soportes o Resistencias en donde el precio puede hacer rebotes, así mismo se pueden estar observando al mismo tiempo los niveles de las medias móviles en temporalidad de 1D, los cuales usualmente son Soportes o resistencias dinámicas y también se puede observar en la misma temporalidad del gráfico cuatro medias móviles que el trader puede configurar en la longitud que crea conveniente para mejorar su análisis y tomar decisiones lo más rápido posible.