[TheMandalor] Invert or Mirror Chart SUPPORT RESSISTANTThis is a new idea to find supports and resistant’s for any charts.
What is the concept of this indicator:
1. It is used close and inverted it on chart
2. When the real chart and the inverted chart is crossing together several times, this point will be important on this concept that means the price will care about this point again and again.
3. When you draw a horizontal line as support and resistance check it with this indicator too, if your support and resistance is touched with inverted chart, it will be more important than normal support/ resistance.
4. This indicator has plot candle too, it means you can compare regular chart with the inverted one at same time if you need.
Here is the steps:
1. When you add the indicator to your chart it will add your ticker as inverted.
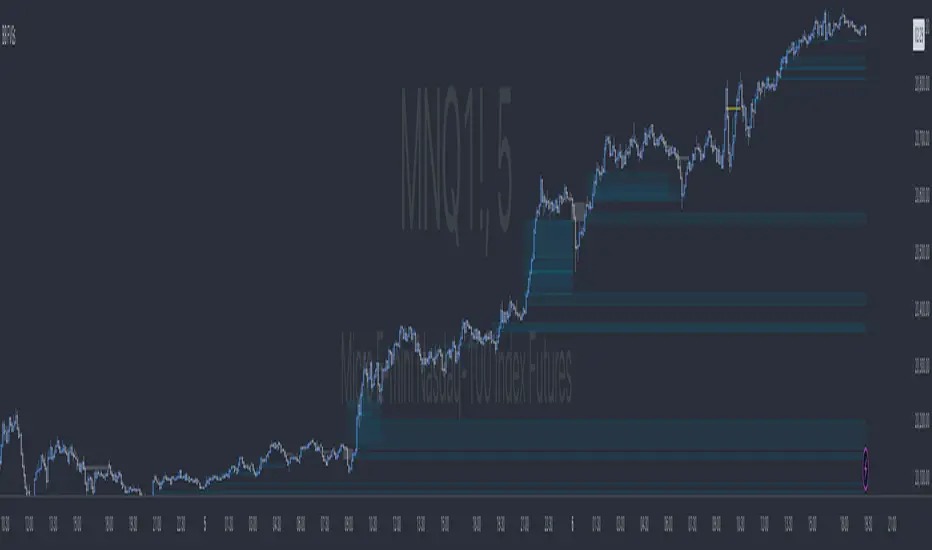
2. Change your chart type to line chart.
3. Fix your scale in both sides left and right (the indicator's side is on the left).
4. Now you must have two type of line charts, one is yours (The blue one) and one is plotted with this indicator (The purple one).
5. Draw a horizontal line where these two lines have more crossing at the middle of chart, this line will be a powerful line later.
6. Find other more crossed points and draw horizontal line for them too.
7. Now you can see these indicator's support and resistant’s, now you can remove the indicator and watch how the price will touch, reverse, or stay on your new type of support and resistant’s lines.
PS: I have added candle plotting too if you need it.
Inverted

BB MTF FVGs & First PresentedBB MTF FVGs with First Presented FVG Highlight
The BB MTF FVGs with First Presented FVG Highlight indicator is an advanced trading tool designed to help users identify and monitor Fair Value Gaps (FVGs) across multiple timeframes, offering traders deep insight into market structure and liquidity imbalances. With the ability to track up to three distinct timeframes (e.g., 1-minute, 1-hour, and 1-day), this indicator provides a comprehensive multi-level perspective, helping traders recognize critical support and resistance areas based on liquidity gaps. Additionally, it highlights the first FVG that presents after a specific time each day, making it especially useful for traders who prioritize session starts or key time-based market activity.
_________________________________________________________________________________
Key Features
1. Multi-Timeframe FVG Detection on Three Levels:
• Track FVGs on three user-defined timeframes for a robust view of liquidity gaps across intraday, intermediate, and higher timeframes. For instance, you could set up 1-minute, 1-hour, and 1-day timeframes to capture the market’s behavior from granular intraday action to daily structural gaps. Each timeframe is fully customizable, and users can enable or disable individual levels as needed.
2. Price Action-Driven FVG Status Analysis:
• The indicator continuously monitors price action to assess the state of each FVG. FVGs are dynamically styled based on their status:
• Untouched: FVGs with solid borders indicate that price has not yet traded into the gap.
• Mitigated: If price partially fills or “mitigates” an FVG, its borders turn dotted, providing visual feedback that the gap has seen some interaction.
• Inverted: When an FVG is fully invalidated by price moving completely through it, the border is removed, signaling the inversion. This real-time analysis gives traders instant feedback on the status of each FVG, helping them quickly assess active, mitigated, or invalidated zones.
3. Highlighting the First FVG After a Specified Time:
• A unique feature that highlights the first FVG presented after a specified time (e.g., 9:30 AM) each day, making it easy for traders to focus on session-based FVGs that could impact market direction. This feature is especially valuable for those tracking the opening range or specific session periods.
4. Configurable FVG Extension Options:
• The indicator offers flexible settings to control how long each FVG remains extended across the chart. Users can choose to extend until the first mitigation, until full mitigation, until inversion, or opt for no extension. This allows traders to adjust FVG visibility duration based on their strategy and trading style.
_________________________________________________________________________________
Customizable User Inputs
The BB MTF FVGs with First Presented FVG Highlight indicator includes various customization options for a personalized experience:
• Three Configurable Timeframes for FVG Tracking:
• Timeframe 1: Primary timeframe, like 1 minute, to capture short-term gaps.
• Timeframe 2: Secondary timeframe, such as 1 hour, to observe intraday market structure.
• Timeframe 3: Higher timeframe, like 1 day, to track major gaps with a longer-term impact. Each timeframe is independently customizable, allowing users to tailor their multi-timeframe FVG setup to fit their trading approach.
• Session-Based First FVG Highlighting:
• Highlight Type: Select whether to highlight only the first FVG presented after the defined time, display it with other FVGs, or turn off the highlight feature.
• Start and End Time for First Highlighted FVG: Specify the start and end time (e.g., 9:30 AM to 10:30 AM) for highlighting the first FVG, enabling a session-focused approach.
• Plotting Control for Forming FVGs:
• Forming FVG Display: Enable or disable forming FVGs for each timeframe, allowing traders to track potential gaps as they start to appear before confirmation.
• Color and Style Customization:
• FVG Colors: Define colors for long and short FVGs on each timeframe for visual clarity. Additionally, set the highlight color for the first FVG to make it stand out.
• Border Styling Based on FVG Status: The indicator’s dynamic border styling provides a clear visual status for each FVG:
• Solid borders for untouched FVGs.
• Dotted borders for mitigated FVGs.
• Borderless display for inverted FVGs.
• Flexible FVG Extension Duration:
• Choose the extension behavior for FVGs based on preferred criteria: extending until first mitigation, keeping them until fully mitigated, extending until inversion, or selecting no extension. This flexibility is ideal for traders who want to adapt FVG visibility to specific conditions.
_________________________________________________________________________________
Technical Details
This indicator leverages precise, real-time calculations to monitor price interactions with each FVG, ensuring clarity and accuracy across multiple timeframes without duplicate or redundant displays. It offers traders a powerful way to track liquidity gaps at various market levels with the added benefit of immediate visual feedback on gap status.
Inverted ProjectionThe "Inverted Projection" indicator calculates the Simple Moving Average (SMA) and draws lines representing an inverted projection. The indicator swaps the highs and lows of the projection to provide a unique perspective on price movement.
This indicator is a simple study that should not be taken seriously as a tool for predicting future price movements; it is purely intended for exploratory purposes.

Backwards price projection - few bars ahead reverse chartEver wondered what the chart would look like if it's flipped upside down and flipped horizontally into the future? The idea is that when there is a trend, a repeating pattern tends to occur. Going backwards and projecting that movement into the future can supposedly show what the future price will be.
Somehow I haven't found anyone try it like this and I am currently trying to find a way to use a reversed moving average or plot of some kind to project further ahead. TV at the moment does not allow offsets on candle plot(as far as I know) and I am only allowed a certain number of plots to go on the chart, so I put as many price moves ahead as I could to project the future price. It's a bit sloppy with all those forced plots but it gets the job done. I'll see if I can improve it with a moving average or something and possibly make a strategy out of it in the future.


Inverted Yield Curve with VIX Fear IndexUS 2 year and US 10 year comparison, inverted yield curve with VIX. I use this on a weekly chart with 2 moving averages, the 40 week (ma200 daily) and the 520 week (10 year median).
The bottom histogram is the VIX and the plot is the yield curve. When the VIX is above a certain level (you can set it in settings) and the ýield curve is close to or at inversion the background goes red.
The last seven recessions were preceded by an inverted yield curve. Here I combined the two main fear indexes, the VIX and the run for safe US treasuries (Inverted Yield Curve).
This is preset to the 2 year and 10 year US bond, weekly, and the normal VIX ticker but you can set it to whatever you like.
Published with source code for anyone to modify. Please comment below if you do so! This is the second in a series of indicators I intend to publish as a package of economic recoverty/recession symptom indicators.
Follow me for updates, next one up is commodities with dr Copper and oil!

Custom Time Frame, Inverse Price CapabilityAt it again. This time I've added to the custom time frame indicator an inversion capability. This way you can look at the inverse price of custom time frames, again without having to go pro!
I use it too look at downtrends with the same bias as I do uptrends. Unfortunately usually to look at the inverse on timeframes anything other than the 1D chart you need a pro account, but not with this indicator!
Enjoy.

Candlestick Patterns Identified (updated 3/11/15)I decided to republish this one without the trend filter and with all the major symbols active. This will allow for all the patterns to show up.
Due to 15 different candlestick formations in this one script, it will be difficult to turn off the last few due to screen size. You can turn off individual patterns on the settings screen.
I have everything spelled out except the hammer and inverted hammer. They are "H" and "IH" respectively on the charts. They show up so often that they cluttered the charts.
The default script has: Doji, Evening Star, Morning Star, Shooting Star, Hammer, Inverted Hammer, Bearish Harami, Bullish Harami, Bearish Engulfing, Bullish Engulfing, Piercing Line, Bullish Belt, Bullish Kicker, Bearish Kicker, Hanging man, and Dark Cloud Cover. You can turn off what you don't like. The Piercing Line, Bullish Belt, and the Kickers will usually show up better in the daily charts.
I recommend watching videos with Stephen Bigalow to get a feel for how to trade these. You will want to add an 8 EMA to your chart with his setups. Enjoy.
If you want the old version: Take a look at the related ideas below.
