US Market Long Horizon Momentum Summary in one paragraph
US Market Long Horizon Momentum is a trend following strategy for US index ETFs and futures built around a single eighteen month time series momentum measure. It helps you stay long during persistent bull regimes and step aside or flip short when long term momentum turns negative.
Scope and intent
• Markets. Large cap US equity indices, liquid US index ETFs, index futures
• Timeframes. 4h/ Daily charts
• Default demo used in the publication. SPY on 4h timeframe chart
• Purpose. Provide a minimal long bias index timing model that can reduce deep drawdowns and capture major cycles without parameter mining
• Limits. This is a strategy. Orders are simulated on standard candles only
Originality and usefulness
• Unique concept or fusion. One unscaled multiple month log return of an external benchmark symbol drives all entries and exits, with optional volatility targeting as a single risk control switch.
• Failure mode addressed. Fully passive buy and hold ignores the sign of long horizon momentum and can sit through multi year drawdowns. This script offers a way to step down risk in prolonged negative momentum without chasing short term noise.
• Testability. All parameters are visible in Inputs and the momentum series is plotted so users can verify every regime change in the Tester and on price history.
• Portable yardstick. The log return over a fixed window is a unit that can be applied to any liquid symbol with daily data.
Method overview in plain language
The method looks at how far the benchmark symbol has moved in log return terms over an eighteen month window in our example. If that long horizon return is positive the strategy allows a long stance on the traded symbol. If it is negative and shorts are enabled the strategy can flip short, otherwise it goes flat. There is an optional realised volatility estimate on the traded symbol that can scale position size toward a target annual volatility, but in the default configuration the model uses unit leverage and only the sign of momentum matters.
Base measures
Return basis. The core yardstick is the natural log of close divided by the close eighteen months ago on the benchmark symbol. Daily log returns of the traded symbol feed the realised volatility estimate when volatility targeting is enabled.
Components
• Component one Momentum eighteen months. Log of benchmark close divided by its close mom_lookback bars ago. Its sign defines the trend regime. No extra smoothing is applied beyond the long window itself.
• Component two Realised volatility optional. Standard deviation of daily log returns on the traded symbol over sixty three days. Annualised by the square root of 252. Used only when volatility targeting is enabled.
• Optional component Volatility targeting. Converts target annual volatility and realised volatility into a leverage factor clipped by a maximum leverage setting.
Fusion rule
The model uses a simple gate. First compute the sign of eighteen month log momentum on the benchmark symbol. Optionally compute leverage from volatility. The sign decides whether the strategy wants to be long, short, or flat. Leverage only rescales position size when enabled and does not change direction.
Signal rule
• Long suggestion. When eighteen month log momentum on the benchmark symbol is greater than zero, the strategy wants to be long.
• Short suggestion. When that log momentum is less than zero and shorts are allowed, the strategy wants to be short. If shorts are disabled it stays flat instead.
• Wait state. When the log momentum is exactly zero or history is not long enough the strategy stays flat.
• In position. In practice the strategy sits IN LONG while the sign stays positive and flips to IN SHORT or flat only when the sign changes.
Inputs with guidance
Setup
• Momentum Lookback (months). Controls the horizon of the log return on the benchmark symbol. Typical range 6 to 24 months. Raising it makes the model slower and more selective. Lowering it makes it more reactive and sensitive to medium term noise.
• Symbol. External symbol used for the momentum calculation, SPY by default. Changing it lets you time other indices or run signals from a benchmark while trading a correlated instrument.
Logic
• Allow Shorts. When true the strategy will open short positions during negative momentum regimes. When false it will stay flat whenever momentum is negative. Practical setting is tied to whether you use a margin account or an ETF that supports shorting.
Internal risk parameters (not exposed as inputs in this version) are:
• Target Vol (annual). Target annual volatility for volatility targeting, default 0.2.
• Vol Lookback (days). Window for realised volatility, default 63 trading days.
• Max Leverage. Cap on leverage when volatility targeting is enabled, default 2.
Usage recipes
Swing continuation
• Signal timeframe. Use the daily chart.
• Benchmark symbol. Leave at SPY for US equity index exposure.
• Momentum lookback. Eighteen months as a default, with twelve months as an alternative preset for a faster swing bias.
Properties visible in this publication
• Initial capital. 100000
• Base currency. USD
• Default order size method. 5% of the total capital in this example
• Pyramiding. 0
• Commission. 0.03 percent
• Slippage. 3 ticks
• Process orders on close. On
• Bar magnifier. Off
• Recalculate after order is filled. Off
• Calc on every tick. Off
• All request.security calls use lookahead = barmerge.lookahead_off
Realism and responsible publication
The strategy is for education and research only. It does not claim any guaranteed edge or future performance. All results in Strategy Tester are hypothetical and depend on the data vendor, costs, and slippage assumptions. Intrabar motion is not modeled inside daily bars so extreme moves and gaps can lead to fills that differ from live trading. The logic is built for standard candles and should not be used on synthetic chart types for execution decisions.
Performance is sensitive to regime structure in the US equity market, which may change over time. The strategy does not protect against single day crash risk inside bars and does not model gap risk explicitly. Past behavior of SPY and the momentum effect does not guarantee future persistence.
Honest limitations and failure modes
• Long sideways regimes with small net change over eighteen months can lead to whipsaw around the zero line.
• Very sharp V shaped reversals after deep declines will often be missed because the model waits for momentum to turn positive again.
• The sample size in a full SPY history is small because regime changes are infrequent, so any test must be interpreted as indicative rather than statistically precise.
• The model is highly dependent on the chosen lookback. Users should test nearby values and validate that behavior is qualitatively stable.
Legal
Education and research only. Not investment advice. You are responsible for your own decisions. Always test on historical data and in simulation with realistic costs before any live use.
Investing

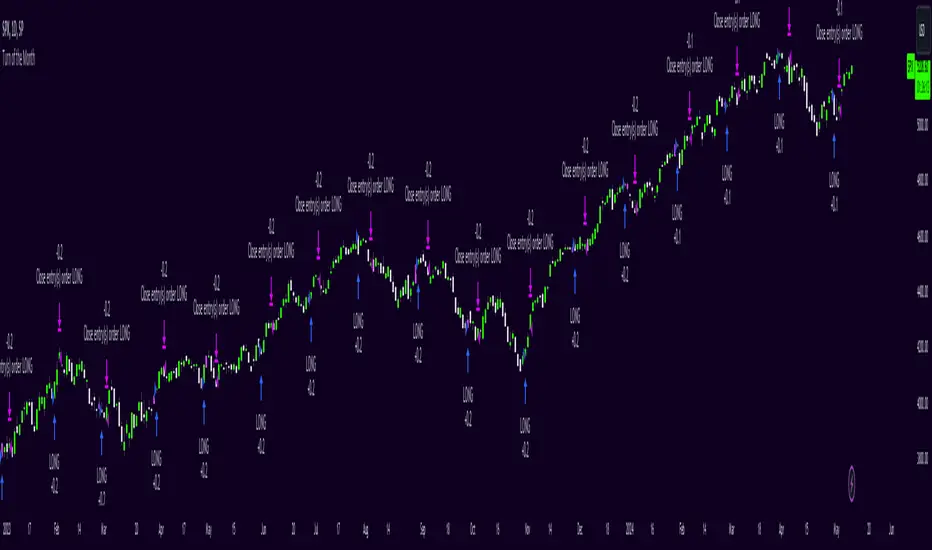
Turn of the Month Strategy [Honestcowboy]The end of month effect is a well known trading strategy in the stock market. Quite simply, most stocks go up at the end of the month. What's even better is that this effect spills over to the next phew days of the next month.
In this script we backtest this theory which should work especially well on SP500 pair.
By default the strategy buys 2 days before the end of each month and exits the position 3 days into the next month.
The strategy is a long only strategy and is extremely simple. The SP500 is one of the #1 assets people use for long term investing due to it's "9.8%" annualised return. However as a trader you want the best deal possible. This strategy is only inside the market for about 25% of the time while delivering a similar return per exposure with a lower drawdown.
Here are some hypothesis why turn of the month effect happens in the stock markets:
Increased inflow from savings accounts to stocks at end of month
Rebalancing of portfolios by fund managers at end of month
The timing of monthly cash flows received by pension funds, which are reinvested in the stock market.
The script also has some inputs to define how many days before end of the month you want to buy the asset and how long you want to hold it into the next month.
It is not possible to buy the asset exactly on this day every month as the market closes on the weekend. I've added some logic where it will check if that day is a friday, saturdady or sunday. If that is the case it will send the buy signal on the end of thursday, this way we enter on the friday and don't lose that months trading opportunity.
The backtest below uses 4% exposure per trade as to show the equity curve more clearly and because of publishing rules. However, most fund managers and investors use 100% exposure. This way you actually risk money to earn money. Feel free to adjust the settings to your risk profile to get a clearer picture of risks and rewards before implementing in your portfolio.
Balance of Power Heikin Ashi Investing Strategy Balance of Power Heikin Ashi Investing Strategy
This is a swing strategy designed for investment help.
Its made around the Balace of Power indicator, but has been adapted on using the Monthly Heikin Ashi candle from the SPY asset in order to be used with correlation for US Stock/ETF/Index Markets.
The BOP acts as an oscilallator showing the power of a bull trend when its positive and a bearish trend when its in negative. At the same time we can spot reversals, based on the percentiles ( 99/1)
The rules for entry :
For long : The 99 percentile is ascending, and we are either in a positive value (>0), or we crossed the bottom place ( -0.35)
For short : the 99 and 1 percentile are descending, and we are either in a negative value(<0), or we crossed down the top place ( 0.6)
If you have any questions please let me know !

Automated Bitcoin (BTC) Investment Strategy from Wunderbit Automated Bitcoin (BTC) Investment Strategy from Wunderbit Trading
This strategy is designed for the automated long-term investment in Bitcoin. The BTC investment strategy is primarily suitable for long-term investors who want to increase the percentage of their investments through timely trading long-term transactions. The main feature is the difference from the indicator of long-term investment. Based on their statistics, this figure is 2 times less. That is, if we just bought Bitcoin and held it, we would receive 2 times less than if we applied the BTC Investment strategy.
This strategy uses the intersection of the triple exponential moving average and the least squares moving average. We also control the profit you will make during an uptrend by implementing a trailing stop based on the ATR indicator.
This is a spot market-only strategy and can be used primarily for long-term investors. The strategy is designed to create an automatic version of investing using a webhook.
Automation allows you to safely ignore the state of your portfolio and exclude emotions.
In order to create a cryptocurrency bot for this strategy, you need to:
1. Create alerts and link the URL to the webhook.
2. Connect the TradingView strategy with automated trading service.

Buy and Hold entry finder StrategyHello everyone!
I proudly present the backtest Strategy Script for my "Buy and Hold entry finder" Script.
It basically shows you the outcome, if you would use my indicator in the past.
The buy signals are limited to 1 order per month.
Order Size: Allows you to choose, how much money you want to invest per month. (Please consider, it will only invest an x amount per Order, but it will not stack the amount you did not invest in an previous month ) (Example in my indicator)
Pyramiding: Just regulates, how often you can open an position.
Commission: Here you can set how much it will cost to open an position at your broker.
I coded a feature that allows you to set a Start Date and an End Date for your backtest. In the end of the backtest the script closes all positions.
If you got any question, feel free to ask in the comments or send me a message.
Sincerely, RS Titan.

Mean Reversion w/ Bollinger BandsThis is a more advanced version of my original mean reversion script.
It employs the famous Bollinger Bands.
This robot will buy when price falls below the lower Bollinger Band, and sell when price moves above the upper Bollinger Band.
I've only tested it on the S&P 500, though you could try it out on other assets to see the backtest performance.
During the recent COVID-19 bear market drop, it produced several buy signals on the S&P which I followed, and made some nice gains so far.
I still think this would make a better investing strategy (buy undervalued / sell over-valued), rather than a trading strategy.
I use this robot for my long term portfolio.

Investing - Weekly EMA's mapped to Daily ChartWhen there isn't enough time in your day to day-trade, yet you want to utilise all the technical analysis skills you have... why not make a long term investing or swing trading indicator set to help you along the way!
So I did....
When it comes to long term investing and swing trading, I often find the weekly 12/26/52 EMA's do a great job in capturing the main market swings from bull to bear.
However, I like to use the Daily chart to see the candle patterns and shapes with more detail and divergences often show up better on the daily chart.
So I have decided to combine the two!
I have basically taken the EMA 12/26/52 from the weekly and transferred them over to the daily (mathematically they are not exact, but for me they are close enough).
I have also developed a simple scale in / scale out strategy for using these exponential moving averages. It isn't as simple as buying in on each signal, however I use my own special strategy to take advantage of the alerts.
Enjoy!

Try to go long at a moving averageA simple experimental strategy that tries to go long at a moving average bounce / support level, and looks for upside.
