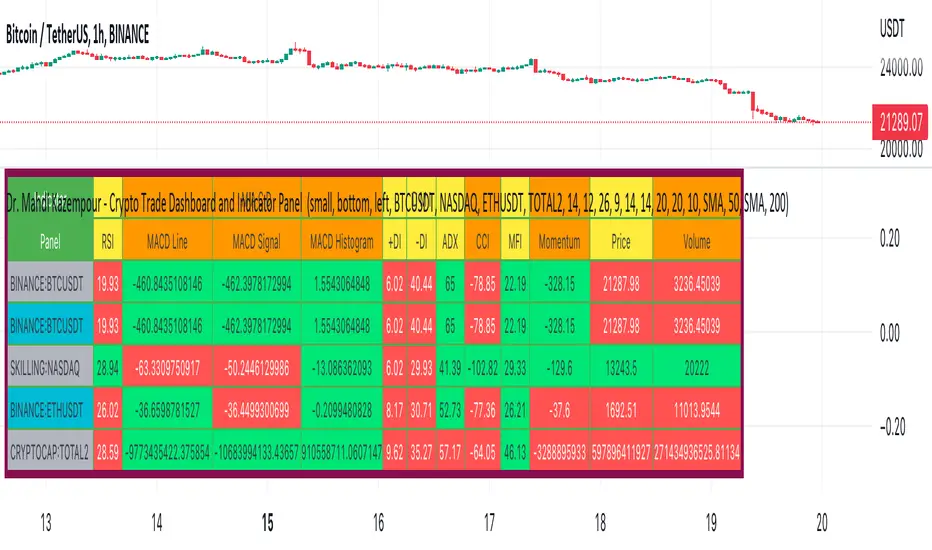
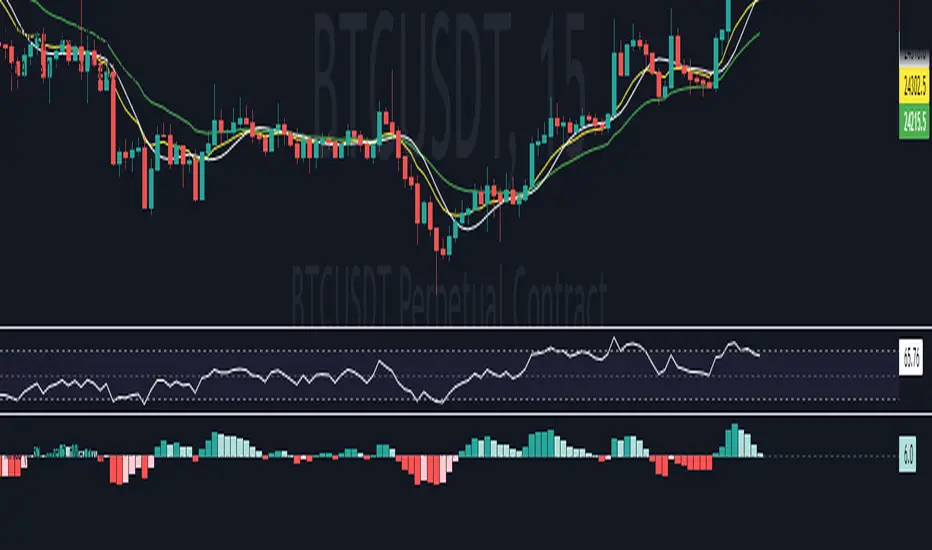
Dr. Mahdi Kazempour - Crypto Trade Dashboard and Indicator PanelA great panel for crypto traders all in one table:
Price, Volume, RSI, MACD, ADI, MOM
1) current symbol
2) BTCUSDT
3) NASDAQ
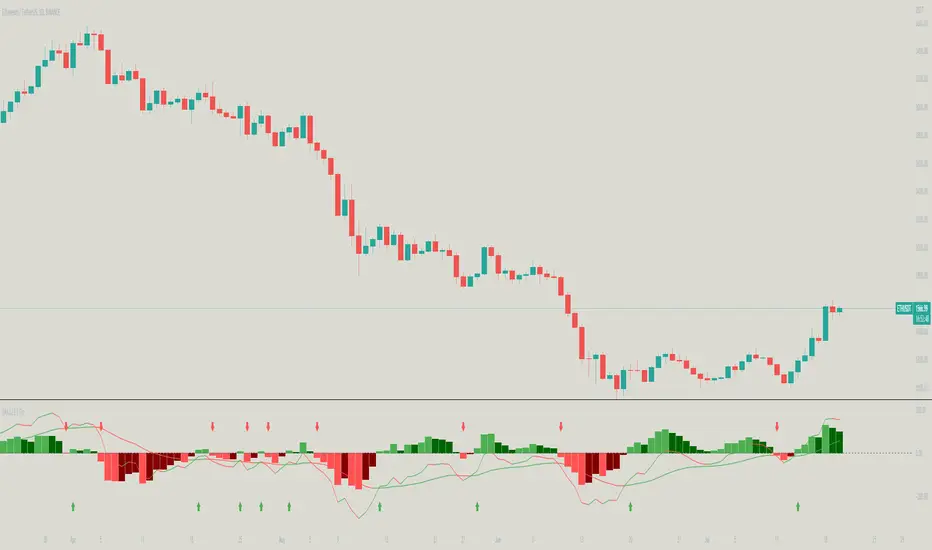
4) ETHUSDT
5) TOTAL2
K-macd
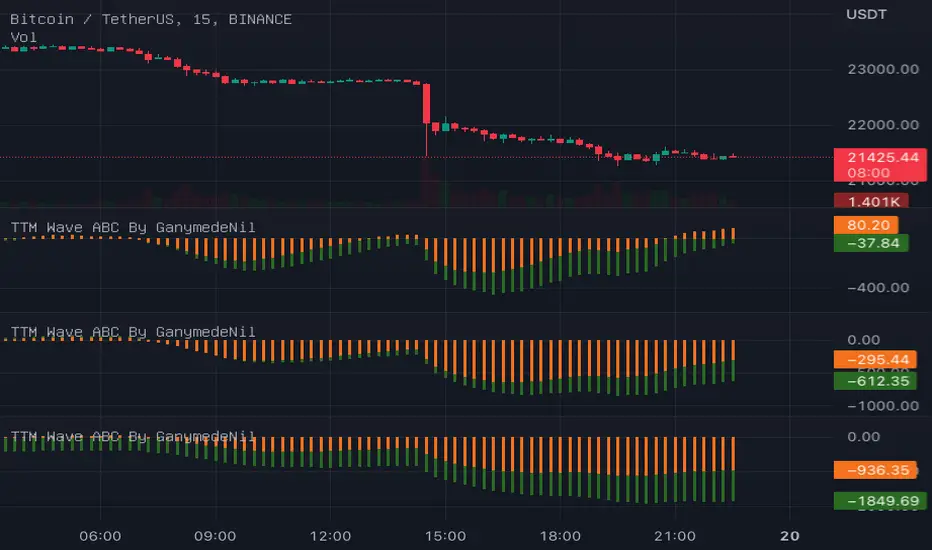
TTM Wave ABC By GanymedeNilTo facilitate the production of an open source version of the strategy TTM Wave ABC
MTF MACD BarOVERVIEW
This indicator shows MACD(Moving Average Convergence/Divergence) is up or down, represented by a bar. This indicator is compatible with MTF.
CONCEPTS
What do you want to know about market analysis?
Do you want a hard analysis? You can look for it.
All I want to know is whether the commonly known technical analysis is 'UP' or 'DOWN'.
All I want to know is whether the current market price is going up or down. Not only for the current, but also for the monthly, weekly, and daily status.
I want to make a decision in a moment. Without even thinking about it.
That is why I created a color-coded bar indicator to show the status.
No need to frown anymore.
DETAILS
You need more information about MACD, click here.
tradingview.com
MACD histogram Green ⇒ Bar is green.
MACD histogramRed ⇒ Bar is red.

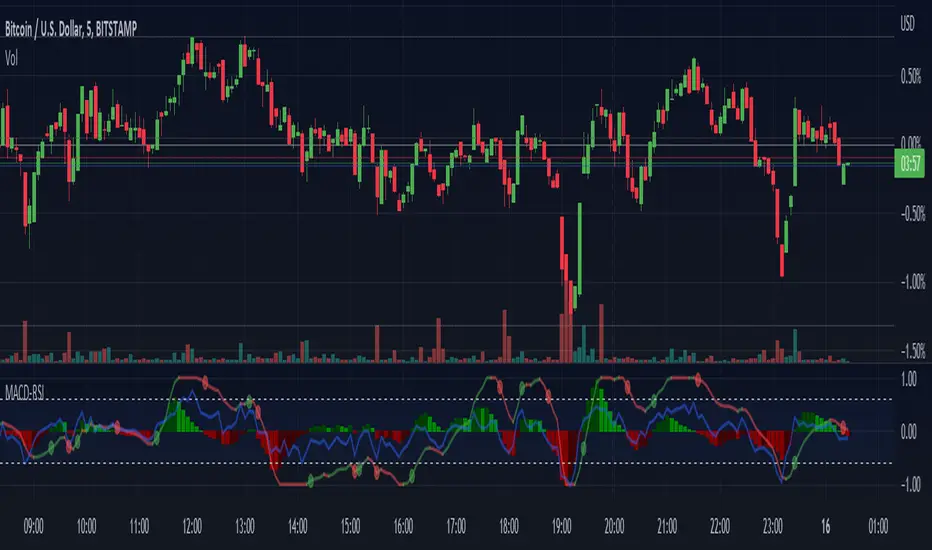
Normalized MACD with RSI [bkeevil]This indicator normalizes the MACD and RSI indicators to a range between -1.0 and 1.0 so they can be displayed together on the same chart to save screen real-estate.
While the MACD is a good indicator to detect trend changes, in some circumstances (such as a sideways range market) it can give false signals. The MACD is more likely to give a false signal when the RSI indicator is close to the centerline than if the RSI is signaling an overbought or oversold condition. Thus the RSI indicator and MACD indicator are commonly used together.
I have included a few features found in other MACD indicators that I have found helpful:
MACD line changes color if it is rising or falling
Dots at the MACD line to signal crossovers
The MACD signal line is hidden it by default as the information it contains is redundant. Hiding the signal line makes the indicator less busy.
EMA 21 + MacD + RSI + Alma
Setting
EMA 21 = Green
EMA 9 = yellow
MacD = 5 35 5
RSI = 10
Alma 20 0.8 8
RULES
Long:
1. EMA 9 below 21
2. RSI above 50 from Oversold
3. Macd Solid green
4. SL @ ALMA
5. Conditional buy limit order @ top wick
6. 1:3 RR
Short:
1. EMA 9 above 21
2. RSI below 50 from Overbought
3. Macd Solid red
4. SL @ ALMA
5. Conditional sell limit order @ bottom wick
6. 1:3 RR
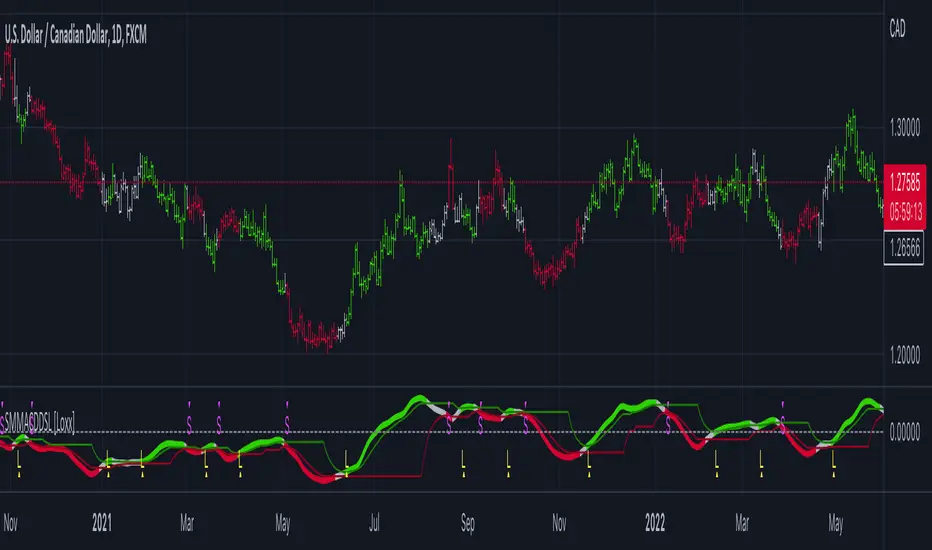
Smoother Momentum MACD w/ DSL [Loxx]Smoother Momentum MACD w/ DSL uses two different EMA calculations to derive momentum and then calculates the MACD between those momentum outputs. This indicator uses a variation of Discontinued Signal Lines for the breakout/breakdown/reversal signals . There are three different signal types: middle, levels, and slope. I've also added alerts and signals. The discontinued signal lines can be smoothed using EMA or Fast EMA.
What are DSL Discontinued Signal Line?
A lot of indicators are using signal lines in order to determine the trend (or some desired state of the indicator) easier. The idea of the signal line is easy : comparing the value to it's smoothed (slightly lagging) state, the idea of current momentum/state is made.
Discontinued signal line is inheriting that simple signal line idea and it is extending it : instead of having one signal line, more lines depending on the current value of the indicator.
"Signal" line is calculated the following way :
When a certain level is crossed into the desired direction, the EMA of that value is calculated for the desired signal line
When that level is crossed into the opposite direction, the previous "signal" line value is simply "inherited" and it becomes a kind of a level
This way it becomes a combination of signal lines and levels that are trying to combine both the good from both methods.
In simple terms, DSL uses the concept of a signal line and betters it by inheriting the previous signal line's value & makes it a level.
Included:
Loxx's Expanded Source Types
Alerts
Signals
Bar coloring
Other momentum indicators
CFB-Adaptive Velocity Histogram
Variety-Filtered, Squeeze Moving Averages
William Blau Ergodic Tick Volume Indicator (TVI)
DB MACD TTM SQZ HistogramDB MACD TTM SQZ Histogram
What does the indicator do?
The DB MACD TTM SQZ Histogram combines the MACD with the TTM Squeeze into a single histogram. Traders may use the "Multiplier" settings to weight MACD vs. TTM SQZ. The MACD will default have a multiplier value of 2 vs. 1 for TTM SQZ. The reasoning behind the default 2:1 multiplier is to allow the faster MACD to have a strong hand in the histogram. In addition to the histogram, the indicator will display a red dot when a BB/KC squeeze (TTM SQZ) is present. The TTM SQZ uses a length of 20, BB m-factor of 2, and KC m-factor of 1.5 to match the "Mastering the Trade" squeeze. The histogram is calculated by taking the MACD histogram and the TTM SQZ histogram and first standardizing them into reasonable decimal percentages. Once standardized, each decimal percentage is then multiplied by the individual multiplier. Finally, the two values are summed into the combined histogram value. The end result is a standardized weighted combination of the MACD (faster) with the TTM SQZ (slower) histogram.
How should this indicator be used?
The DB ETHUSD MMA Indicator should be combined with other indicators as a secondary visual indicator or market buy/sell periods. The indicator is not meant to replace the MACD or TTM SQZ. Analyzing the MACD and TTM SQZ wave patterns individually is extremely useful. The indicator allows the trader to quickly obtain a combined analysis of the two indicators with a predetermined preference (multiplier) towards one vs. the other.
In other words, the indicator is very helpful when the MACD and TTM SQZ are conflicting in providing market direction. Those familiar with MACD or TTM SQZ histograms recognize there are four periods in the full cycle; growing below zero line, growing above zero line, falling above zero line, and falling below zero line. Typically a trader would look for buying opportunities when the cycle is showing "growing below zero line." and sell when the price reaches the "falling above zero line." The qualification of the wave pattern of the four periods must be reviewed before trades. If the wave is choppy, then alternative timeframes should be reviewed. Think of wake on a lake or ocean waves. Choppy is unpredictable but smooth waves are more predictable.
The red dot on the zero line would indicate that a squeeze is present in the current timeframe, building pressure. The red dot does not indicate a pressure release of up or down. Instead, it simply means the spring is being compressed. When a squeeze is present, pressure builds and may release in either direction. You can combine this indicator with BB and KC on the plot with BB (20 len, 2 m-factor) and KC (20 len, 1.5 m-factor). You can review the BB/KC outer bands to see possible breakout resistance or support when a squeeze is on. If the price is outside the BB/KC outer banks, move to a higher timeframe.
Does the indicator include any alerts?
Not Yet. Perhaps in the Future (If Desired)
Enjoy!

Ultimate Custom MTF ScreenerThis indicator will allow you to make your custom TradingView MTF screener without coding. Add it to the chart, select up to 10 instruments, 4 timeframes, and 4 indicators, and the screener will do the rest for you. The indicator will form a lovely table with all values and highlighted signals.
The screener is highly customizable, and you can choose its position on the chart, sorting, order of the columns, and colors for the tables. You can easily change parameters for all supported indicators and their signals.
Currently, there are 21 different custom indicators available. Current list of indicators:
Average Directional Index (ADX) - displaying the value of ADX and checking if it's higher than the threshold
Average True Range (ATR) - showing the value of ATR
Awesome Oscillator (AO) - displaying the value of AO and highlighting positive/negative values.
Bollinger Bands (BB) - showing if the price is above/below/in the channel.
Breakout Pivots - Displaying when the price is below/above the most recent pivot low/high.
Commodity Channel Index (CCI) - shows the last CCI value and highlights overbought/oversold values.
Directional Movement Index (DMI) - Up/Down signal (+DI above or below -DI)
Donchian Channel (DC) - showing if the price is above/below/in the channel.
Heikin Ashi Count (HAC) - What is the current Heikin Ashi candle color and for how long was this color?
Historical Volatility (HV) - Current value of Historical Volatility
Keltner Channel (KC) -showing if the price is above/below/in the channel.
Moving Average Convergence Divergence (MACD) - Up/Down signal (MACD above / below signal)
Moving Average Crossover (MA Cross) - Displaying MA crosses signals (SMA, EMA, WMA, HMA, VWMA, SMMA, DEMA, VWAP supported)
Moving Average Distance (MA DIST) - Displaying distance to the MA (SMA, EMA, WMA, HMA, VWMA, SMMA, DEMA, VWAP supported)
Parabolic Stop and Reverse (PSAR) - Up or Down
Relative Strength Index (RSI) - Displaying the last RSI value and highlighting overbought/oversold values.
Stochastic (STOCH) - Displaying the last Stochastic value and highlighting overbought/oversold values.
Stochastic RSI (STOCH RSI) - Displaying the last Stochastic RSI value and highlighting overbought/oversold values.
SuperTrend - Current state of the SuperTrend.
Trailing Stop-Loss (TSL) - Up or Down
True Strength Index (TSI) - Displaying the last TSI value and highlighting overbought/oversold values.
We're already working on adding a few more supported indicators. If you have any ideas about the indicators you want to see in our screener, contact us, and we'll consider them.
Disclaimer
Please remember that past performance may not be indicative of future results.
Due to various factors, including changing market conditions, the strategy may no longer perform as well as in historical backtesting.
This post and the script don’t provide any financial advice.

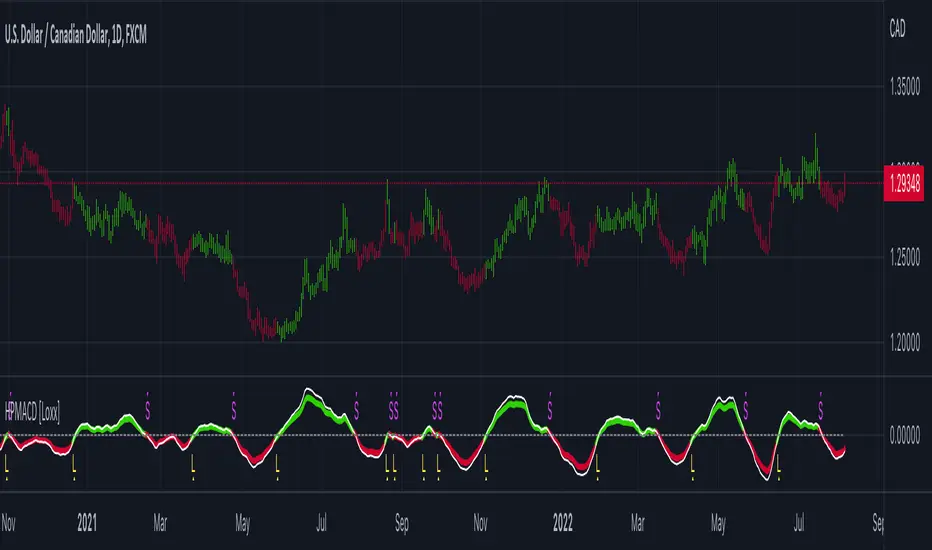
Hodrick-Prescott MACD [Loxx]Hodrick-Prescott MACD is a MACD indicator using a Hodrick-Prescott Filter.
What is Hodrick–Prescott filter?
The Hodrick–Prescott filter (also known as Hodrick–Prescott decomposition) is a mathematical tool used in macroeconomics, especially in real business cycle theory, to remove the cyclical component of a time series from raw data. It is used to obtain a smoothed-curve representation of a time series, one that is more sensitive to long-term than to short-term fluctuations. The adjustment of the sensitivity of the trend to short-term fluctuations is achieved by modifying a multiplier Lambda.
The filter was popularized in the field of economics in the 1990s by economists Robert J. Hodrick and Nobel Memorial Prize winner Edward C. Prescott, though it was first proposed much earlier by E. T. Whittaker in 1923.
There are some drawbacks to use the HP filter than you can read here: en.wikipedia.org
Included
Bar coloring
3 types of signals
Alerts
Loxx's Expanded Source Types
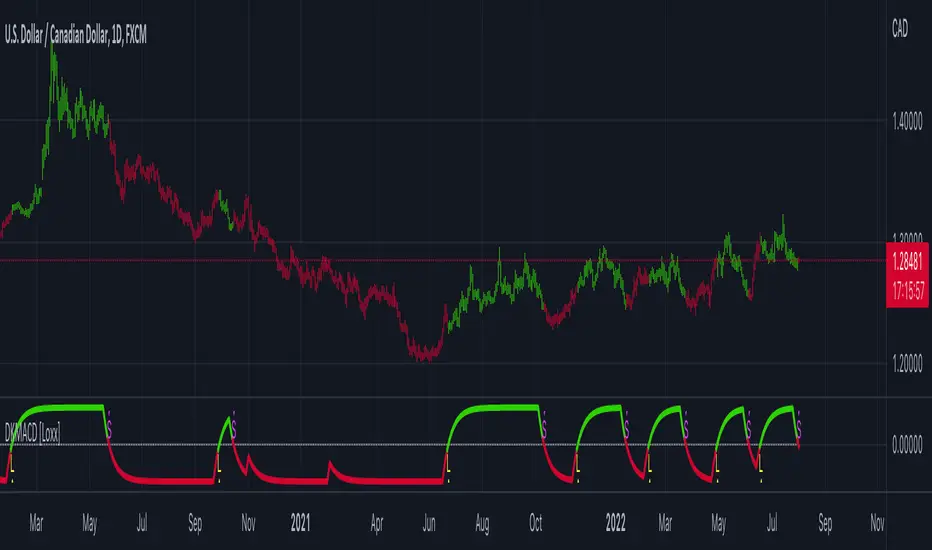
Digital Kahler MACD [Loxx]Digital Kahler MACD is a MACD indicator that uses an extreme noise reduction algorithm by Philipp Kahler. For our purposes here, we call it Digital Kahler.
What is Digital Kahler?
From Philipp Kahler's article for www.traders-mag.com, August 2008. "A Classic Indicator in a New Suit: Digital Stochastic"
Digital Indicators
Whenever you study the development of trading systems in particular, you will be struck in an extremely unpleasant way by the seemingly unmotivated indentations and changes in direction of each indicator. An experienced trader can recognise many false signals of the indicator on the basis of his solid background; a stupid trading system usually falls into any trap offered by the unclear indicator course. This is what motivated me to improve even further this and other indicators with the help of a relatively simple procedure. The goal of this development is to be able to use this indicator in a trading system with as few additional conditions as possible. Discretionary traders will likewise be happy about this clear course, which is not nerve-racking and makes concentrating on the essential elements of trading possible.
How Is It Done?
The digital stochastic is a child of the original indicator. We owe a debt of gratitude to George Lane for his idea to design an indicator which describes the position of the current price within the high-low range of the historical price movement. My contribution to this indicator is the changed pattern which improves the quality of the signal without generating too long delays in giving signals. The trick used to generate this “digital” behavior of the indicator. It can be used with most oscillators like RSI or CCI.
First of all, the original is looked at. The indicator always moves between 0 and 100. The precise position of the indicator or its course relative to the trigger line are of no interest to me, I would just like to know whether the indicator is quoted below or above the value 50. This is tantamount to the question of whether the market is just trading above or below the middle of the high-low range of the past few days. If the market trades in the upper half of its high-low range, then the digital stochastic is given the value 1; if the original stochastic is below 50, then the value –1 is given. This leads to a sequence of 1/-1 values – the digital core of the new indicator. These values are subsequently smoothed by means of a short exponential moving average. This way minor false signals are eliminated and the indicator is given its typical form.
Included:
Bar coloring
Signals
Alerts
Loxx's Expanded Source Types
Loxx's Moving Averages
MACDV DASHBOARDFrom Riliza MACD-V Volatility Normalisation and another knowledge I am just her follower, Try to make dashboard to study the market for my self.
Rev00
- MACDV with momentum
-Still need to optimize and revise many thing.
-Any wrong could you please help feed back , Not much experience.

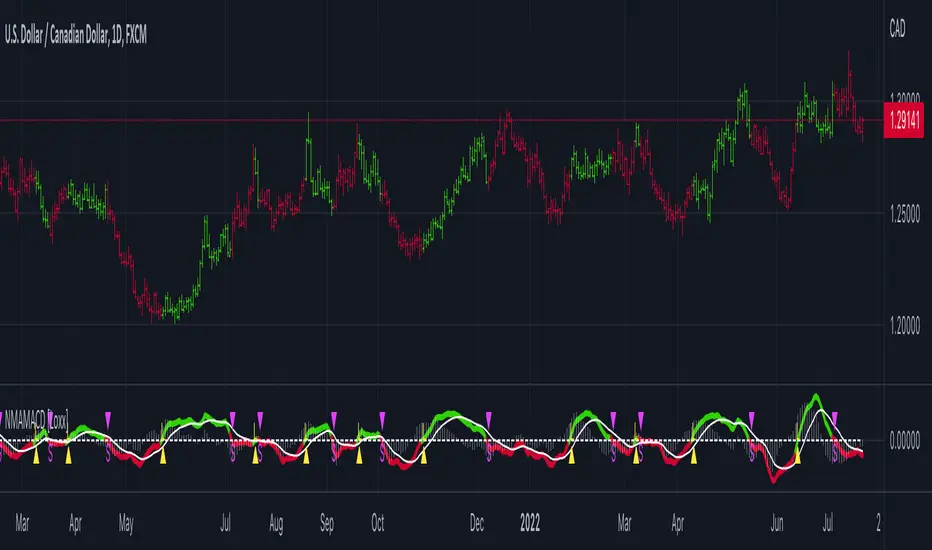
Nyquist Moving Average (NMA) MACD [Loxx]Nyquist Moving Average (NMA) MACD is a MACD indicator using Nyquist Moving Average for its calculation.
What is the Nyquist Moving Average?
A moving average outlined originally developed by Dr . Manfred G. Dürschner in his paper "Gleitende Durchschnitte 3.0".
In signal processing theory, the application of a MA to itself can be seen as a Sampling procedure. The sampled signal is the MA (referred to as MA.) and the sampling signal is the MA as well (referred to as MA). If additional periodic cycles which are not included in the price series are to be avoided sampling must obey the Nyquist Criterion.
It can be concluded that the Moving Averages 3.0 on the basis of the Nyquist Criterion bring about a significant improvement compared with the Moving Averages 2.0 and 1.0. Additionally, the efficiency of the Moving Averages 3.0 can be proven in the result of a trading system with NWMA as basis.
What is the MACD?
Moving average convergence divergence (MACD) is a trend-following momentum indicator that shows the relationship between two moving averages of a security’s price. The MACD is calculated by subtracting the 26-period exponential moving average (EMA) from the 12-period EMA.
The result of that calculation is the MACD line. A nine-day EMA of the MACD called the "signal line," is then plotted on top of the MACD line, which can function as a trigger for buy and sell signals. Traders may buy the security when the MACD crosses above its signal line and sell—or short—the security when the MACD crosses below the signal line. Moving average convergence divergence (MACD) indicators can be interpreted in several ways, but the more common methods are crossovers, divergences, and rapid rises/falls.
Included
Bar coloring
2 types of signal output options
Alerts
Loxx's Expanded Source Types
MACD + RSI with Trade SignalsThis indicator by default comes with the MACD shown but can be switched to show the RSI instead. Settings for each indicator can also be customized as well as Buy/Sell signals given based on pull back crossovers that follow the 200 EMA of the price Chart. There's an above/below middle fill option you can use but I tend not to but I know some traders like to see when an oscillator is above/below the middle and use it as a trend diretion. By the way, the fourth setting for the MACD (which is 2 by default) is the size of the histogram.
Buy Signal = Price is above the 200 EMA. Current or previous MACD or RSI line is/was below middle line and now crossed above the signal line.
Sell Signal = Price is below the 200 EMA. Current or previous MACD or RSI line is/was above middle line and now crossed below the signal line.
There are alerts for each signal as well (MACD and RSI, both buy and sell).
Feel free to leave a comment regarding issues or suggestions for this indicator or ideas for the next one I should do :)

Fisher Transform of MACD w/ Quantile Bands [Loxx]Fisher Transform of MACD w/ Quantile Bands is a Fisher Transform indicator with Quantile Bands that takes as it's source a MACD. The MACD has two different source inputs for fast and slow moving averages.
What is Fisher Transform?
The Fisher Transform is a technical indicator created by John F. Ehlers that converts prices into a Gaussian normal distribution.
The indicator highlights when prices have moved to an extreme, based on recent prices. This may help in spotting turning points in the price of an asset. It also helps show the trend and isolate the price waves within a trend.
What is Quantile Bands?
In statistics and the theory of probability, quantiles are cutpoints dividing the range of a probability distribution into contiguous intervals with equal probabilities, or dividing the observations in a sample in the same way. There is one less quantile than the number of groups created. Thus quartiles are the three cut points that will divide a dataset into four equal-size groups (cf. depicted example). Common quantiles have special names: for instance quartile, decile (creating 10 groups: see below for more). The groups created are termed halves, thirds, quarters, etc., though sometimes the terms for the quantile are used for the groups created, rather than for the cut points.
q-Quantiles are values that partition a finite set of values into q subsets of (nearly) equal sizes. There are q − 1 of the q-quantiles, one for each integer k satisfying 0 < k < q. In some cases the value of a quantile may not be uniquely determined, as can be the case for the median (2-quantile) of a uniform probability distribution on a set of even size. Quantiles can also be applied to continuous distributions, providing a way to generalize rank statistics to continuous variables. When the cumulative distribution function of a random variable is known, the q-quantiles are the application of the quantile function (the inverse function of the cumulative distribution function) to the values {1/q, 2/q, …, (q − 1)/q}.
What is MACD?
Moving average convergence divergence ( MACD ) is a trend-following momentum indicator that shows the relationship between two moving averages of a security’s price. The MACD is calculated by subtracting the 26-period exponential moving average ( EMA ) from the 12-period EMA .
Included:
Zero-line and signal cross options for bar coloring, signals, and alerts
Alerts
Signals
Loxx's Expanded Source Types
35+ moving average types

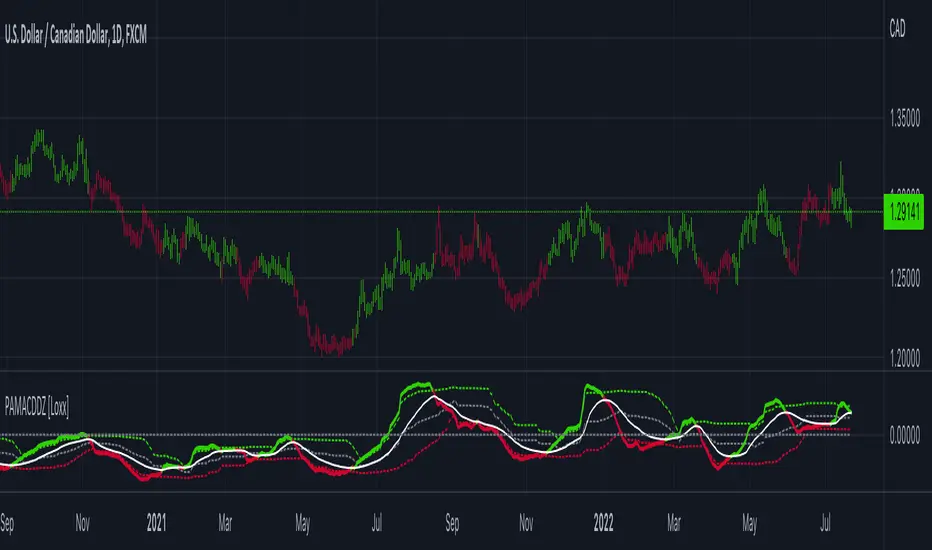
PA-Adaptive MACD w/ Variety Levels [Loxx]PA-Adaptive MACD w/ Variety Levels is a Phase Accumulation Adaptive MACD with both floating and quantile levels. This is tuned for Forex. You'll have to adjust the Phase Accumulation Cycle settings to work for crypto and stock markets.
What is MACD?
Moving average convergence divergence ( MACD ) is a trend-following momentum indicator that shows the relationship between two moving averages of a security’s price. The MACD is calculated by subtracting the 26-period exponential moving average ( EMA ) from the 12-period EMA .
What is the Phase Accumulation Cycle?
The phase accumulation method of computing the dominant cycle is perhaps the easiest to comprehend. In this technique, we measure the phase at each sample by taking the arctangent of the ratio of the quadrature component to the in-phase component. A delta phase is generated by taking the difference of the phase between successive samples. At each sample we can then look backwards, adding up the delta phases.When the sum of the delta phases reaches 360 degrees, we must have passed through one full cycle, on average.The process is repeated for each new sample.
The phase accumulation method of cycle measurement always uses one full cycle’s worth of historical data.This is both an advantage and a disadvantage.The advantage is the lag in obtaining the answer scales directly with the cycle period.That is, the measurement of a short cycle period has less lag than the measurement of a longer cycle period. However, the number of samples used in making the measurement means the averaging period is variable with cycle period. longer averaging reduces the noise level compared to the signal.Therefore, shorter cycle periods necessarily have a higher out- put signal-to-noise ratio.
Included:
Zero-line and signal cross options for bar coloring, signals, and alerts
Alerts
Signals
Loxx's Expanded Source Types
4 moving average types
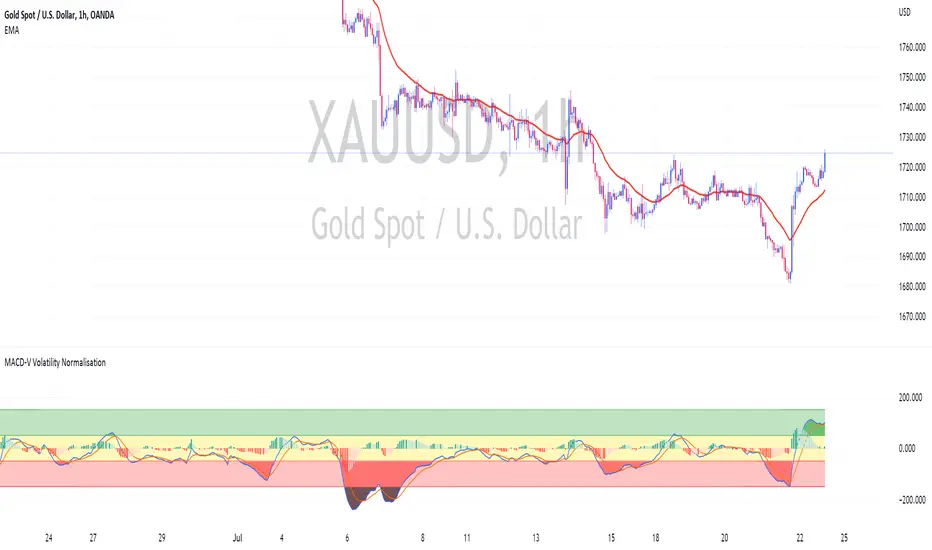
MACD-V Volatility NormalisationUsing MACD-V by Alex Spiroglou (CMT) Method
Calculation MACD-V = * 100
While
⚠️MACD-V >150 - Risk
📈MACD-V between 50 - 150 : Rallying or Retracing📈
〰️MACD-V between -50 - 50 : Ranging (Sideway) 〰️
↪️MACD-V between -150 - -50 : Rebounding or Reversing ↪️
⚠️MACD-V <150 - Risk ⚠️
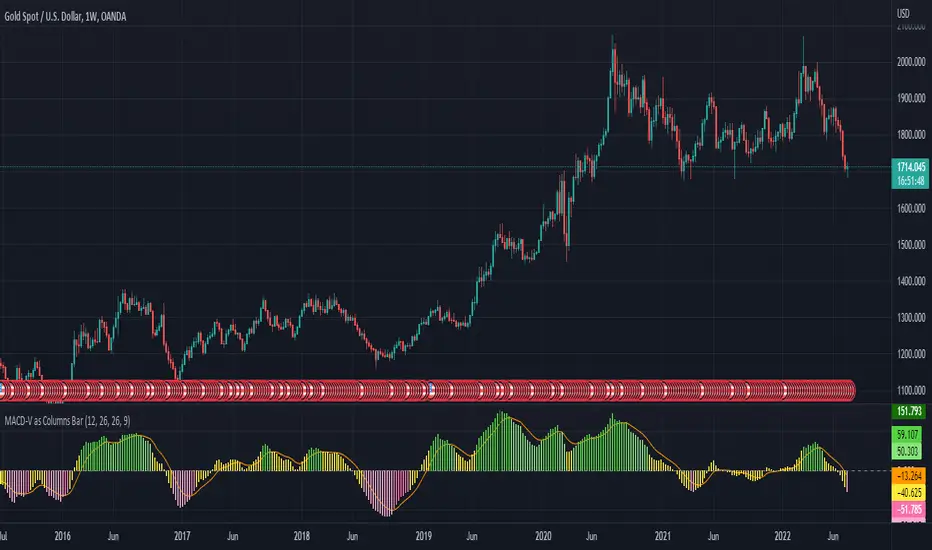
MACD-V as Columns BarI use MACD-V as Columns Bar and including the signal line
Not use MACD-V - Signal Line as Histogram
Enjoy!
CCI+MACD+VWAP+BreakoutDesign for LONG and Day Trade only
- Identify buy and sell signal using CCI
- Green Zone when
-- Price over VWAP
-- EMA9 > EMA50 > EMA200
-- MACD fast > MACD slow
- Yellow Zone when either one failed
- White line occurs when breakout of Higher High + Higher Low

MACD DEMA by ToffMACD DEMA by Toff
converted to version 5
Changed Histogram formatting
Changed MACD plot to indicate macd direction change
//@version=5
//by ToFFF converted to version 5, changed histogram formating changed macd plot to show macd direction changed with lighter color
indicator('MACD DEMA', timeframe = "", timeframe_gaps=true)
sma = input(12,title='DEMA Short')
lma = input(26,title='DEMA Long')
tsp = input(9,title='Signal')
lines = input(true,title="Lines")
col_grow_above = input(#26A69A, "Above Grow", group="Histogram", inline="Above")
col_fall_above = input(#B2DFDB, "Fall", group="Histogram", inline="Above")
col_grow_below = input(#FFCDD2, "Below Grow", group="Histogram", inline="Below")
col_fall_below = input(#FF5252, "Fall", group="Histogram", inline="Below")
col_macd = input(#2962FF, "MACD Line ", group="Color Settings", inline="MACD")
col_signal = input(#FF6D00, "Signal Line ", group="Color Settings", inline="Signal")
col_macd_i = #0000FF
col_macd_d = #66FFFF
slowa = ta.ema(close,lma)
slowb = ta.ema(slowa,lma)
DEMAslow = ((2 * slowa) - slowb)
fasta = ta.ema(close,sma)
fastb = ta.ema(fasta,sma)
DEMAfast = ((2 * fasta) - fastb)
MACD = (DEMAfast - DEMAslow)
signala = ta.ema(MACD, tsp)
signalb = ta.ema(signala, tsp)
signal = ((2 * signala) - signalb)
hist = (MACD - signal)
//swap1 = MACDZeroLag>0?green:red
plot(hist,style=plot.style_columns, color=(hist>=0 ? (hist < hist ? col_grow_above : col_fall_above) : (hist < hist ? col_grow_below : col_fall_below)),title='HIST')
p1 = plot(lines?MACD:na,style = plot.style_line, color=(MACD < MACD) ? col_macd_i : col_macd_d , linewidth =3,title='MACD')
p2 = plot(lines?signal:na, color=col_signal, linewidth =2,title='Signal')
hline(0)

ARKA-LBR OscillatorThe oscillator is used by Linda Bradford Raschke.
Basically, it's a MACD with 3/10/16 settings without the histogram (difference between fast and slow line), instead, the shown histogram is based on the fastline . The color of the lines will tell you if the line is falling (red) or rising (green).
But in this indicator, you can activate Histogram and cross signals.
In histogram mode, you can find 4 colors which show us the strength of each histogram compared to the previous one.
Sherry on Crypto - MACD ScalpingThis indicator is originally made by someone else, I just modified it to increase its win rate.
How to use this indicator?
Step 1: This indicator only works in 5 minutes timeframe (BTC) . Apply 5 minutes timeframe in Tradingview.
Step 2: Apply 2 EMA(s), 1st EMA length 50, 2nd EMA length 200.
Step 3: Draw support and resistance and understand price action as well.
Step 4: Use RSI along with this indicator.
Strategy: When you see a down tick on the MACD in 5 minutes timeframe,
you are allow to take a long position. When you see an up tick on the MACD in 5 minutes timeframe, you are allow to take a Short position,
but RSI should be Included (you can do your own settings of RSI).
Recommended TP 0.50 and SL 0.40.

Variety Moving Average Waddah Attar Explosion (WAE) [Loxx]Variety Moving Average Waddah Attar Explosion is a Waddah Attar Explosion after the original version created over a decade ago. This version has ATR and Pips calculated dead-zone as well as 35+ moving averages to choose from for all moving average calculations.
What is Waddah Attar Explosion?
Waddah Attar Explosion is a momentum indicator that accounts for volatility in the market. It is the combination of MACD and Bollinger Bands with volatility cutoffs to determine entry and exit points.
How to use:
Strong uptrend when dark green arrow points up
Weak uptrend when light green arrow points up
Strong downtrend when dark red arrow points down
Weak downtrend when light red arrow points down
Included:
35+ moving averages
Controls over explosion and trend filtering
Bar coloring
Dead-zone coloring
ATR and Pips-based dead zone cutoffs
Alerts

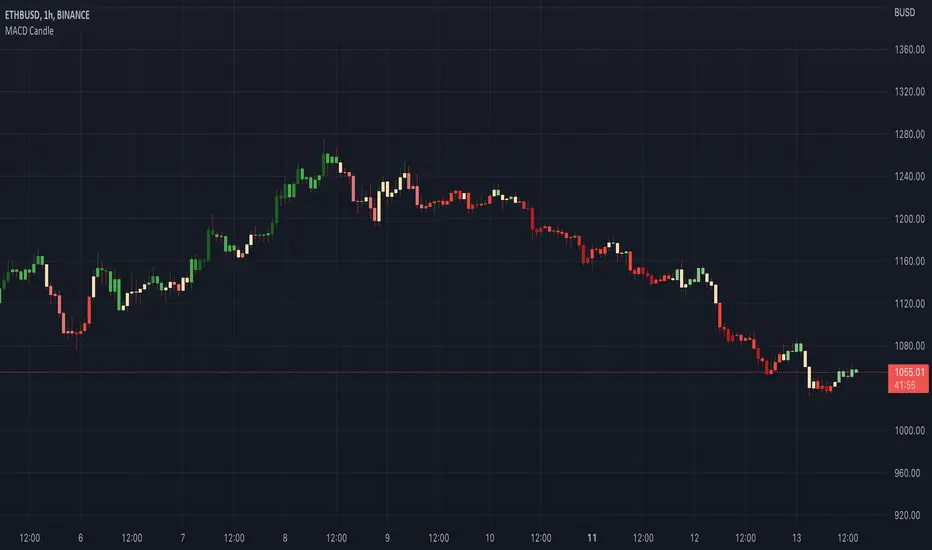
MACD CandleInstead of viewing MACD from a separate chart (histogram), this indicator will plot a candle based on the MACD value. It is easy to summarize trends and make your technical analysis charting less complex.