CCV MA with MACDThis is a moving average script where the color of the moving average is based on MACD.
Pink MA = Negative and falling MACD
Red MA = Negative and rising MACD
Aqua MA = Positive and rising MACD
Blue MA = Positive and falling MACD
Additionally this marks pivot highs and lows on the MACD as well as divergence points with those pivots. Black triangles will mark new highs or lows, a blue circle indicates bullish divergence formed, a red circle indicates bearish divergence formed.
K-macd

Adjustable MACD Alert V2This indicator can be used as an alarm for MACD crossing and uses EMA to distinguish the quality of alerts.
Buy1 and Sell1 are crossings outside the EMA and the color is brighter, the rest of the cross is darker.
If u don't want to distinguish alerts, u can use the original Adjustable MACD Alert as following.

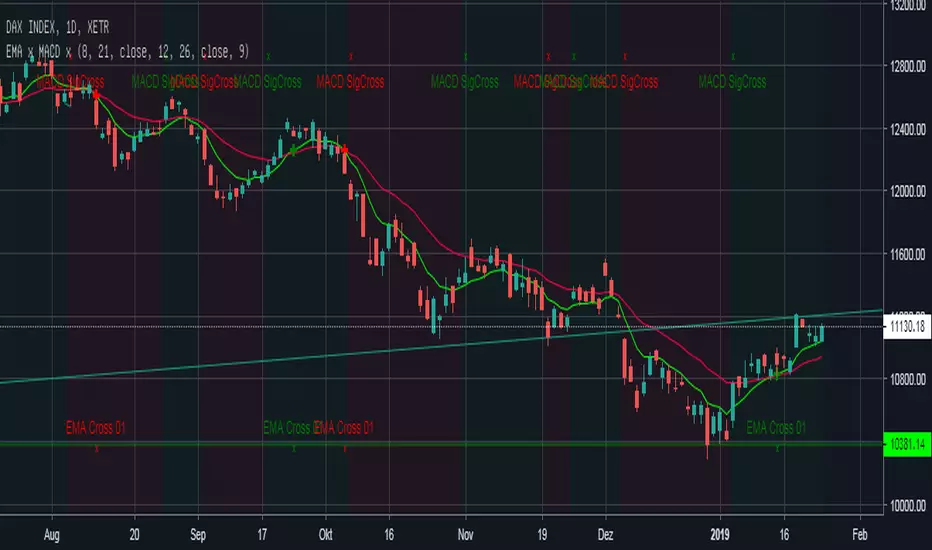
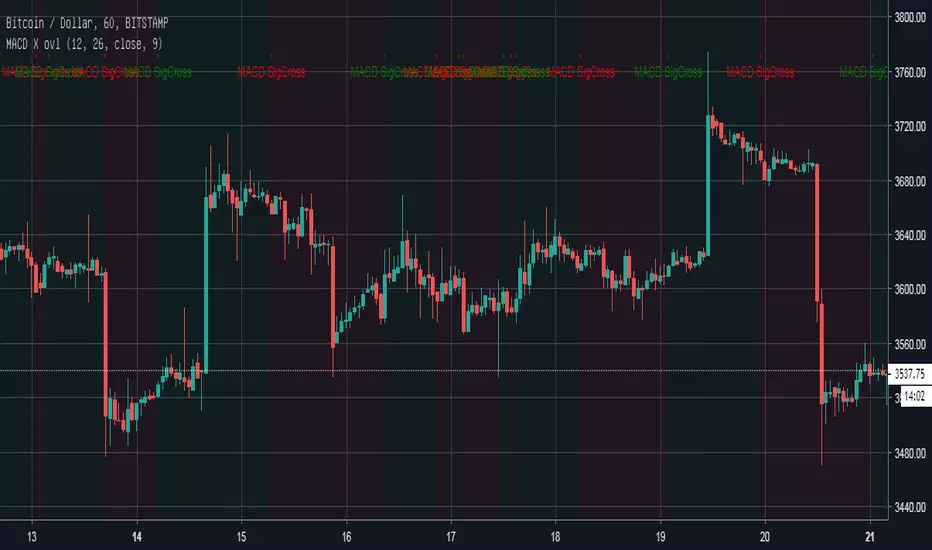
EMA Cross + MACD Signal Cross overlay Einfacher EMA-Cross Indikator mit Indikation der Crosses auf EMA-Linie und am Chart-Bottom +
MACD-Cross wird default an: location.top angezeigt zusätzlich zeigt die Hintergrundfarbe an ob der MACD über (grün) oder unter (rot) seinem Signal liegt.


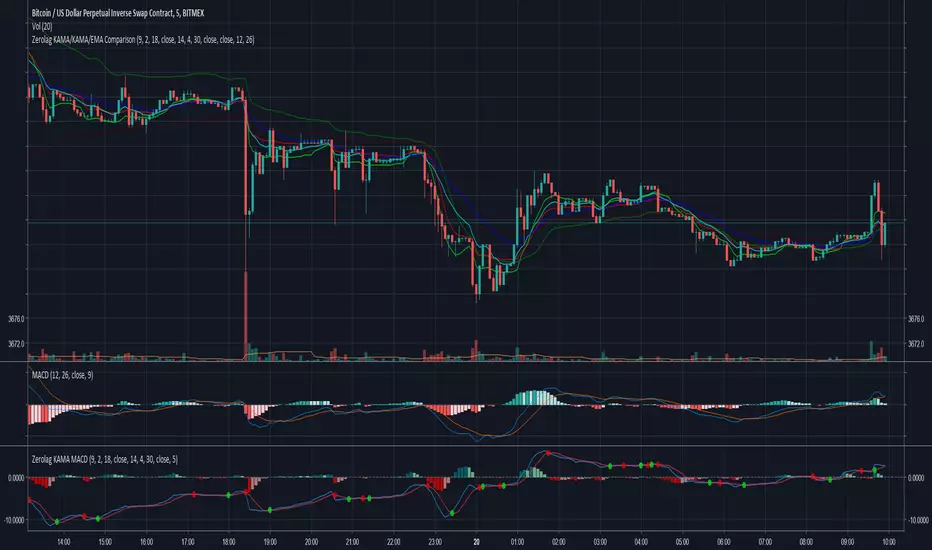
Zerolag KAMA MACDExperimental Zero Lag Adjusted KAMA based MACD.
Uses Kaufman's Adaptive Moving Average (KAMA) instead of the standard EMAs to calculate the MACD with an optional application of the zero lag adjustment.
Significant differences in momentum changes (zero line crossovers), often earlier signal line crossovers and differences in divergences.
Chart displays :
Top : Zero lag adjusted KAMA based MACD
Middle : Unadjusted KAMA based MACD
Bottom : Standard MACD
Cryptocurrency Profitability Rankings PRO Customisable ListA good cryptocurrency may multiply your earnings - with the same effort.
This indicator helps crypto traders to find the trading securities that suit their profitability and volatility preference.
This indicator calculates and generate a ranking of profitability from a user-defined list of cryptocurrencies, based on MACD cycles within user-defined time span.
Multiple time frames: This indicator is designed for day trading, so suggested time frames are: 3m, 5m, 15m, 30m, 1H. Users can try other time frames (< 1D) if they find it useful.
This is PRO version of Cryptocurrency Profitability Rankings with Popular List, developed based on Profitability Meter for Day Trading PRO
PRO Version advanced functions:
Customisable(User-Defined) Cryptocurrency List
Option to select Open or Close price as start point for calculation.
Flexible Time Span Type: Hours and Bars, besides Days
More statistics options: Display price change(%) of latest rising/falling MACD cycle
Free trial for two weeks: Please leave a comment asking for a trial, you should get access within 48 hours. In case it doesn't work, please message the author.
Format Configuration:
Profitability Threshold: a percentage of price movement within a MACD cycle that a user thinks can be used to define profitability, defval: 0.8%.
Select open or close as start point: which can affect the results greatly, as difference between open and close can be significant, especially for big time interval.
Statistics Options
timeSpan: time span for statistics
timeSpanType: time span type for statistics
User-defined cryptocurrencies list: up to 10 items
About Customisable List of Cryptocurrency:
At present, in Pine Language, there is no method to plot a string input variable. Therefore, fixed handles are used to represent each symbol name, eg. "Sym_10". User need to remember the order of the list or refer to "Format".
Make sure to input correct tiers, eg. "BITFINEX:ETHUSD"
Related Indicators:
Profitability Meter for Day Trading PRO - Calculating and evaluating individual trading security's profitability.
About Loading Time: It may take up to 2 minutes for your browser to load a new format setting, depending on the your computer and network speed.
List of the author's Indicators
www.tradingview.com
Disclaim: By using or requesting access to this indicator, you acknowledge that you have read and accepted that this indicator is for study purposes only and it does NOT guarantee you will make money.
I am not financial adviser and I am NOT responsible for any profits or losses you may incur by using this indicator!
Users should make their own decisions, carefully assess risks and be responsible for investment and trading activities.
The latest updates override the previous description. Please check the updates.
加密货币赢利潜力排行指标 PRO 自定义列表
优质的交易币种可能倍增你的收益-在付出同样的努力的情况下。
该指标基于Profitability Meter for Day Trading PRO开发,帮助加密货币交易员找到适合其赢利性和波动率偏好的币种。
该指标根据用户定义的时间跨度内的MACD周期,计算和比对用户自定义的一组虚拟货币,生成一个赢利潜力排名。
多时间维度:本指标为日内交易设计,因此建议使用时间维度:3m,5m,15m,30m,1H; 如果用户需要,也可以用于其他小于1D的维度。
免费试用两周:跟帖评论要求试用,您应该在48小时内获得访问权限。 如果没有获得,请私信开发者。
这是Cryptocurrency Profitability Rankings with Popular List的PRO版本
可自定义加密货币列表,上至10个
可选择开盘价或收盘价作为计算起点。
灵活的时间跨度类型:小时,蜡烛数,天数
更多统计选项:显示最近上涨/下跌的MACD周期的价格变动(%)
格式配置:
盈利能力阈值:用户自定义的MACD单次波动的可赢利的百分比,默认为0.8%
选择开盘或者收盘作为起点:这会对结果产生很大影响,因为开盘价和收盘价之间的差异可能很大,特别是在较大的时间维度。
统计选项
timeSpan:统计功能的时间跨度
timeSpanType:统计功能的时间跨度单位
用户自定义的加密货币列表输入栏
关于自定义的加密货币列表:
目前,在Pine Language中,不能打印字符串输入变量。 因此,使用顺序数字字符代表币种名称,例如。“Sym_10”。 用户需要记住其输入币种的顺序或随时参考“格式设置”中的顺序。
确保输入正确的交易所和币种名称,例如。 “BITFINEX:ETHUSD”。
相关指标:
日内交易盈利潜力指示仪PRO (Profitability Meter for Day Trading PRO):用于计算和评估单个交易品种的盈利能力
关于载入新设置:每次载入新的设置可能需要0-2分钟,取决于用户的电脑配置和网络速度。
试用开发者的其他指标
www.tradingview.com
免责声明:在要求获得本指标使用权之前以及在使用本指标之前,用户认可已经完全了解和接受:本指标仅供教育和研究目的, 它不提供任何赢利的可能性。
本指标的开发者并非专业投资顾问,因此不对用户的任何赢亏负责。
用户应独立判断,审慎评估并自负投资和交易风险!
最新更新会覆盖之前的说明。 请检查更新。

Cryptocurrency Profitability Rankings with Popular ListA good cryptocurrency may multiply your earnings - with the same effort.
This indicator helps crypto traders to find the trading securities that suit their profitability and volatility preference.
This indicator calculates and generate a ranking of profitability from a popular list of crypto currencies, based on MACD cycles within user-defined time span.
Multiple time frames: This indicator is designed for day trading, so suggested time frames are: 3m, 5m, 15m, 30m, 1H. Users can try other time frames (< 1D) if they find it useful.
Developed based on Profitability Meter for Day Trading PRO
About popular list of Cryptocurrency:
The author has the right to change the list from time to time without notice.
PRO Version of this Indicator: (invite-only)
Advanced functions:
Customisable(User-Defined) Cryptocurrency List
Option to select Open or Close price as start point for calculation.
Flexible Time Span Type: Hours and Bars, besides Days
More statistics options: Display price change(%) of latest rising/falling MACD cycle
Format Configuration:
Profitability Threshold: a percentage of price movement within a MACD cycle that a user thinks can be used to define profitability, defval: 0.8%.
Statistics Options
timeSpan: time span for statistics
timeSpanType: time span type for statistics
Related Indicators:
Profitability Meter for Day Trading PRO - Calculating and evaluating individual trading securitie's profitability.
About Loading Time: It may take up to 2 minutes for your browser to load a new format setting, depending on the your computer and network speed.
List of the author's Indicators
www.tradingview.com
Disclaim: By using or requesting access to this indicator, you acknowledge that you have read and accepted that this indicator is for study purposes only and it does NOT guarantee you will make money.
I am not financial adviser and I am NOT responsible for any profits or losses you may incur by using this indicator!
Users should make their own decisions, carefully assess risks and be responsible for investment and trading activities.
The latest updates override the previous description. Please check the updates.
加密货币赢利潜力排行指标 热门列表
优质的交易币种可能倍增你的收益-在付出同样的努力的情况下。
该指标基于Profitability Meter for Day Trading PRO开发,帮助加密货币玩家找到适合其赢利性和波动率偏好的币种。
该指标根据用户定义的时间跨度内的MACD周期,计算和比对一组虚拟货币,生成一个赢利潜力排名。
多时间维度:本指标为日内交易设计,因此建议使用时间维度:3m,5m,15m,30m,1H; 如果用户需要,也可以用于其他小于1D的维度。
关于加密货币的热门列表:
作者有权随时更改列表,恕不另行通知。
该指标的PRO版本:Cryptocurrency Profitability Rankings PRO with Customisable List (Invite-Only)
可自定义加密货币列表,上至10个
可选择开盘价或收盘价作为计算起点。
灵活的时间跨度类型:小时,蜡烛数,天数
更多统计选项:显示最近上涨/下跌的MACD周期的价格变动(%)
格式配置:
盈利能力阈值:用户自定义的MACD单次波动的可赢利的百分比,默认为0.8%
统计选项
timeSpan:统计功能的时间跨度
timeSpanType:统计功能的时间跨度单位
相关指标:
日内交易盈利潜力指示仪PRO (Profitability Meter for Day Trading PRO):用于计算和评估单个交易品种的盈利能力
关于载入新设置:每次载入新的设置可能需要0-2分钟,取决于用户的电脑配置和网络速度。
试用开发者的其他指标
www.tradingview.com
免责声明:在要求获得本指标使用权之前以及在使用本指标之前,用户认可已经完全了解和接受:本指标仅供教育和研究目的, 它不提供任何赢利的可能性。
本指标的开发者并非专业投资顾问,因此不对用户的任何赢亏负责。
用户应独立判断,审慎评估并自负投资和交易风险!
最新更新会覆盖之前的说明。 请检查更新。

CryptoCoyns MACDS [v2018-12-10]CryptoCoyns MACDS
This indicator implements a standard Moving Average Convergance / Divergance
that works on any chart timeframe. It shows the strength of the current trend.
MACD Crosses are highlighted with yellow circles to make them more obvious.
Strength is indicated by histogram colours moving from Red (weak) through to Light Green (strong):
Red indicates a strong down trend
Yellow indicates a positive change is coming and moving out of a downtrend.
Green indicates a weakening upward trend moving towards a change to a downward trend.
Light Green indicates a strong upward trend
All colours are fully configurable.
If you get some value out of this indicator please consider making
a small donation to my favourite charity the Save the Children's Fund.
Every donation will make a difference to the lives of children.
All donations over $2 are tax deductible. You can donate here:
savethechildrenfundraising.org.au
Copyright (c) 2018, Grant Cause aka CryptoCoyns

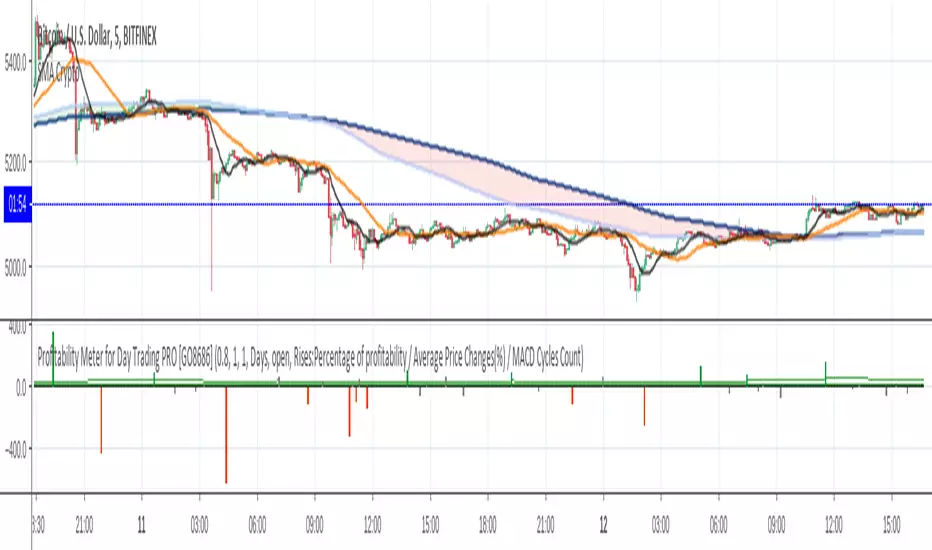
Profitability Meter for Day Trading PRO [GO8686]For day traders, keeping a position is risky and costly, a popular strategy is to open a position ONLY when volatility is active, in other words, only when profitability is back.
This indicator reveals the movements of the underlying profitability of a trading security in different time dimensions.
This indicator calculates and displays price change percentage of MACD cycles, highlights those MACD cycles that are over the profitability threshold, helping traders identify range area, the start of a new trend and the fading of a trend.
Multiple time frames: This indicator is designed for day trading, so suggested time frames are: 3m, 5m, 15m, 30m, 1H. Users can try other time frames (< 1D) if it fits their trading practice.
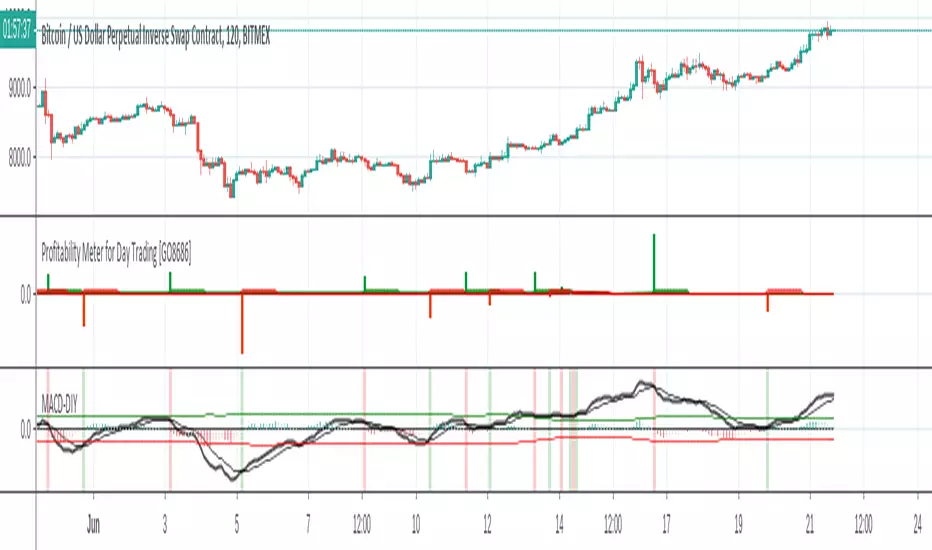
Range area in general: a small green column and a small red column appear alternately, or most columns are gray within the period.
The start of a new trend: an outstanding green or red column means the macd cross brought a price change that was higher than the profitability threshold, which could mean a new trend, especially when it was from a range area.
The fading of a trend: for instance, when green columns are getting smaller and red columns appear, a fading of bull trend could be on the way.
This is PRO version of Profitability Meter for Day Trading
PRO excluded functions:
Alert Function: allowing user to set alert for price change with Profitability, or set alert for statistics results.
Statistics within Customisable Time Span: Percentage of MACD cycles with profitability, the average of price change(%) and MACD cycles count. Users can customize the time range by days,hours or bars (up to the maximum backtracking value that Tradingview allows).
Subscribers of this indicator may apply for two-month free-trial of "Crypto Currency Profitability Rankings PRO with Customisable List"
Free trial of two-week: Please leave a comment asking for a trial, you should get access in 48 hours. In case it doesn't happen, please message the author.
Visibility:Invite-Only
Format Configuration:
Profitability Threshold: a percentage of price movement within a MACD cycle that a user thinks is good to define profitability, defval: 0.8%.
Alertthreshold: Threshold percentage for alert.
timeSpan: Time span for statistics
timeSpanType: Time span type for statistics
Related Indicators:
Crypto Currency Profitability Rankings Standard with Popular List (Protected): The Indicator calculates and compares the profitability of a group of popular crypto currencies - based on MACD cycles and user-defined time span, helping traders to find the most suitable trading security.
Crypto Currency Profitability Rankings PRO with Customisable List (Invite-Only): Contact the author for a free trial.
List of the author's Indicators
www.tradingview.com
Disclaim: By using or requesting access to this indicator, you acknowledge that you have read and accepted that this indicator is for study purposes only and it does NOT guarantee you will make money.
I am not financial advisor and I am NOT responsible for any profits or losses you may incur by using this indicator!
Users should make their own decisions, carefully assess risks and be responsible for investment and trading activities.
The latest updates override the previous description. Please check the updates.
日内交易盈利潜力指示仪PRO
这是日内交易盈利潜力指示仪的PRO版本
PRO专属功能:
预设警报:方便用户为赢利性变动和统计学结果设置警报。
统计功能:过去特定时间段的可赢利波动的百分比,波动百分比平均值和MACD周期计数。用户可以自定义时间幅度:可以用天数,小时数,蜡烛数(上至Tradingview最大回溯值)
本指标用户可以申请免费试用两个月“Crypto Currency Profitability Rankings PRO with Customisable List (Invite Only)”
指标特征描述
本指标帮助交易员认知交易标的在不同时间维度的赢利潜力的变化。
对于日内交易,保持仓位是要承担风险和成本的,一种交易策略是只在波动率被激活至可赢利水平后才开仓位。
本指标计算和展示赢利潜力-基于MACD周期的波动百分比,用颜色来突出高赢利性的波动周期。方便交易员辨识非交易区间,新趋势的开始和旧趋势的衰减。
多时间维度:本指标为日内交易设计,因此建议使用时间维度:3m,5m,15m,30m,1H; 如果用户需要,也可以用于其他不大于1D的维度。
盘整区的一般特征:当波动率消减时,波动率低于可赢利门槛,呈现灰色; 或者小的绿色和红色波动率间隔出现。
新趋势的开始:在盘整后期,新出现的绿色或者红色波动率可能标识着新趋势的开始。
旧趋势的衰减:以上升趋势为例,当绿色波动率逐渐缩小,而红色波动率开始出现时,可能标识着上升趋势衰减。
设置:盈利能力阈值:用户自定义的MACD单次波动的可赢利的百分比,默认为0.8%
免费试用两周:跟帖评论, 要求试用,您应该会在48小时内获得访问权限。 如果没有获得,请私信作者。
相关指标:
Crypto Currency Profitability Rankings Standard with popular list (Protected) 加密货币赢利潜力排行指标 标准版 热门列表: 指标计算和比对一组热门虚拟货币的可赢利属性 - 基于MACD波动周期和用户自定义的时间周期,帮助交易员发掘最适合自己赢利和风险偏好的交易品种。
Crypto Currency Profitability Rankings PRO with Customisable List (Invite-Only): 加密货币赢利潜力排行指标 PRO 自定义列表
试用开发者的其他指标
www.tradingview.com
免责声明:在要求获得本指标使用权之前以及在使用本指标之前,用户认可已经完全了解和接受:本指标仅供教育和研究目的, 它不提供任何赢利的可能性。
本指标的开发者并非专业投资顾问,因此不对用户的任何赢亏负责。
用户应独立判断,审慎评估并自负投资和交易风险!
最新更新会覆盖之前的说明。 请检查更新。
Profitability Meter for Day Trading [GO8686]Disclaim:
By using or requesting access to this indicator, you acknowledge that you have read and accepted that this indicator is for study purposes only and it does NOT guarantee you will make money.
I am not financial adviser and I am NOT responsible for any profits or losses you may incur by using this indicator.
Users should make their own decisions, carefully assess risks and be responsible for investment and trading activities.
Indicator Description
Visibility:Protected
This indicator helps traders understand the movements of the underlying profitability of a trading security in different time dimensions.
For day trading, keeping a position is risky and costly, a popular strategy is to open a position ONLY when volatility is active, in other words, only when profitability is back.
This indicator calculates and displays price movement percentage of MACD cycles, highlights those MACD cycles that are over the profitability threshold, helping traders identify range area, the start of a new trend and the fading of a trend.
Multiple time frames: This indicator is designed for day trading, so suggested time frames are: 3m, 5m, 15m, 30m, 1H. Users can try other time frames (< 1D) if they find it useful.
Range area in general: a small green column and a small red column appear alternately, or most columns are gray within the period.
The start of a new trend: an outstanding green or red column means the MACD cross brought a price change that was higher than the profitability threshold, which could mean a new trend, especially when it was from a range area.
The fading of a trend: for instance, when green columns are getting smaller and red columns appear, a fading of bull trend could be on the way.
Format Configuration:
Profitability Threshold: a percentage of price movement within a MACD cycle that a user thinks is good to define profitability, defval: 0.8%.
PRO Version of this Indicator: Profitability Meter for Day Trading - PRO (Invite-Only)
Alert Function: allowing user to set alert for price change with profitability, or set alert for statistics results.
Statistics with Customisable Time Span: Percentage of MACD cycles with profitability, the average of price change(%) and MACD cycles count. Users can customize the time range by days,hours or bars (up to the maximum backtracking value that Tradingview allows).
Related Indicators:
Crypto Currency Profitability Rankings Standard with Popular List (Protected):
This indicator calculates and generate a ranking of profitability from a popular list of crypto currencies, based on MACD cycles within user-defined time span, helping crypto traders to find the trading securities that suit their risk and volatility preference.
Crypto Currency Profitability Rankings PRO with Customisable List (Invite-Only): Contact the author for a free trial.
List of the author's Indicators
www.tradingview.com
The latest updates override the previous description. Please check the updates.
日内交易盈利潜力指示仪
免责声明:在要求获得本指标使用权之前以及在使用本指标之前,用户认可已经完全了解和接受:本指标仅供教育和研究目的, 它不提供任何赢利的可能性。
本指标的开发者并非专业投资顾问,因此不对用户的任何赢亏负责。
用户应独立判断,审慎评估并自负投资和交易风险!
指标特征描述
本指标帮助交易员认知交易标的在不同时间维度的赢利潜力的变化。
对于日内交易,保持仓位是要承担风险和成本的,一种交易策略是只在波动率被激活至可赢利水平后才开仓位。
本指标计算和展示赢利潜力-基于MACD周期的波动百分比,用颜色来突出高赢利性的波动周期。方便交易员辨识非交易区间,新趋势的开始和旧趋势的衰减。
多时间维度:本指标为日内交易设计,因此建议使用时间维度:3m,5m,15m,30m,1H; 如果用户需要,也可以用于其他不大于1D的维度。
盘整区的一般特征:当波动率消减时,波动率低于可赢利门槛,呈现灰色; 或者小的绿色和红色波动率间隔出现。
新趋势的开始:在盘整后期,新出现的绿色或者红色波动率可能标识着新趋势的开始。
旧趋势的衰减:以上升趋势为例,当绿色波动率逐渐缩小,而红色波动率开始出现时,可能标识着上升趋势衰减。
设置:盈利能力阈值:用户自定义的MACD单次波动的可赢利的百分比,默认为0.8%
高级版本功能: Profitability Meter for Day Trading - PRO (Invite Only)
预设警报:方便用户为赢利性变动和统计学结果设置警报。
统计功能:过去特定时间段的可赢利波动的百分比,波动百分比平均值和MACD周期计数。用户可以自定义时间幅度:可以用天数,小时数,蜡烛数(上至Tradingview最大回溯值)
相关指标:
Crypto Currency Profitability Rankings Standard with popular list (Protected) 加密货币获利机会排行指标 标准版 热门列表(保护,开放使用权): 指标计算和比对一组热门虚拟货币的可赢利属性 - 基于MACD波动周期和用户自定义的时间周期,帮助交易员发掘最适合自己赢利和风险偏好的交易品种。
Crypto Currency Profitability Rankings PRO with Customisable List (Invite-Only): 加密货币获利机会排行指标 PRO - 自定义列表
试用开发者的其他指标
www.tradingview.com
最新更新会覆盖之前的说明。 请检查更新。
Adjustable MACD AlertNow u can use this script to set A-MACD long/short alert.
If u are curious about the numerical benefits of the settings, you can use the backtest version test.
Here is the backtest version link.

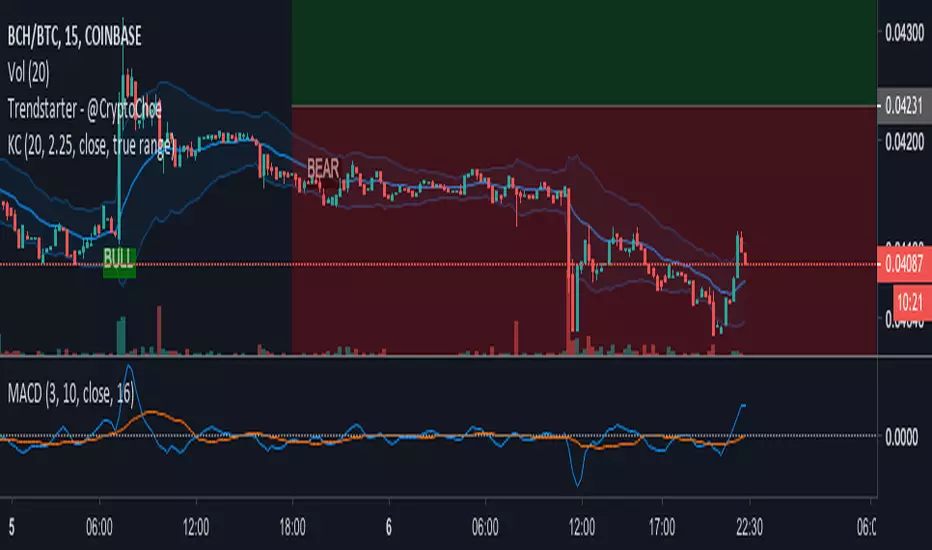
Modified MACD with Zero LineBased on Adam H. Grimes' Modified MACD. Uses a 3/10 simple MA for the fast line and a 16 for the signal line. Added a zero line.
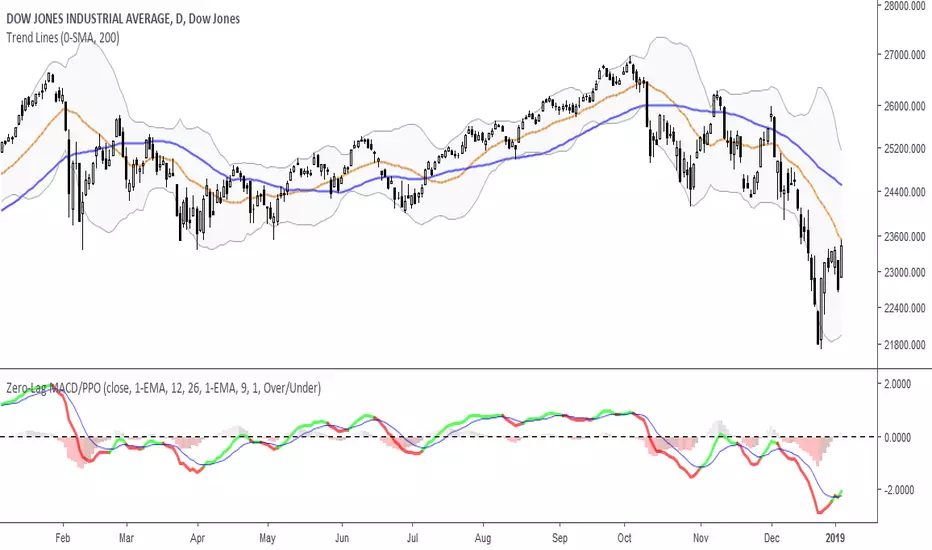
Zero-Lag MACD/PPOMACD/PPO Indicator, with optional faster EMA's to reduce lag.
-Use "MA TYPE" to select SMA, EMA, Double-EMA, Triple-EMA, or Hull as the MACD Source. Default is 'EMA'.
-Use "FAST MA" and "SLOW MA" to set the fast and slow period lengths.
-Use "SIGNAL TYPE" to select SMA, EMA, Double-EMA, Triple-EMA, or Hull as the Signal formula. Default is 'EMA'.
-Use "SIGNAL LENGTH" to set the Signal period length.
-Use "HIST. SIZE" to change the scaling of the histogram and make it stand out more.
-Use "COLOR SIGNALS" to select when to signal green/red on the MACD line.
--- "None" is always black.
--- "Over/Under" will signal based on MACD being over or under the Signal line.
--- "Rising/Falling" will signal based on MACD being over/under the Signal line and both are rising/falling.
-Use "PPO INSTEAD" to use Price Percent Oscillator scaling (works better for long-term and large price fluctuation).
MACD (with alerts)MACD with highlight bars and alertcondition for setting alarm on crossover and crossunder

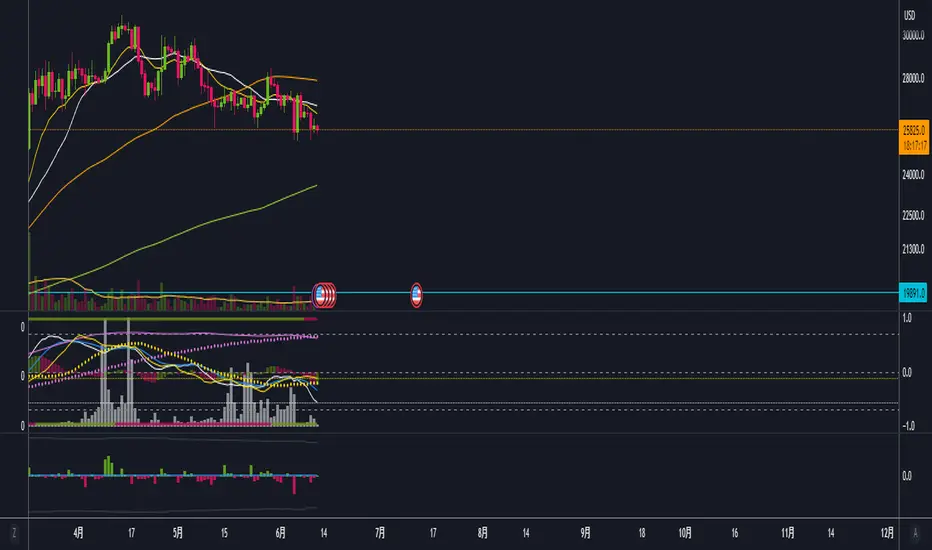
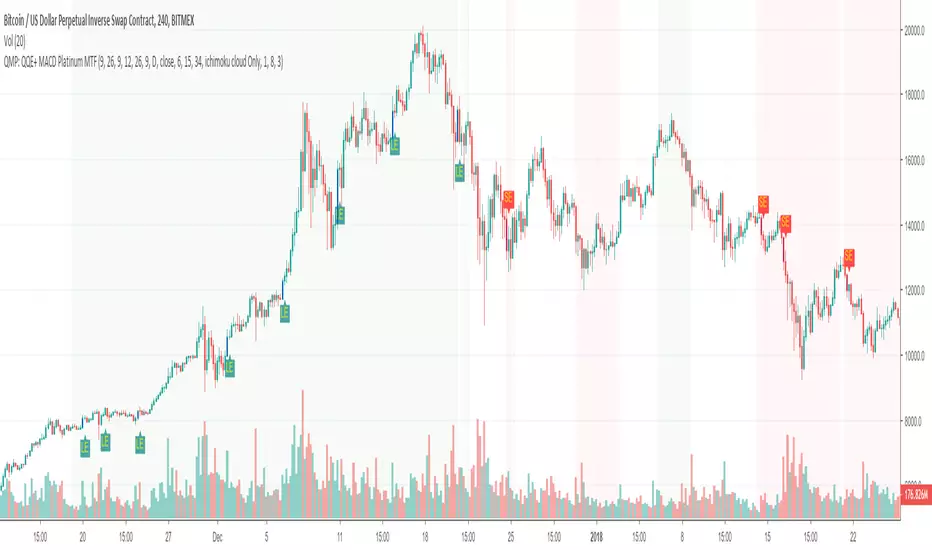
Trend following and reversal strategy for cryptoThe idea of this indicator comes from Jim Brown's book.
using the "MACD Platinum" and "QQE advanced" and multi-timeframe.
The difference to the original idea is that I use Ichimoku cloud for trend detection.

Custom MACDMulti indication MACD , the macd coloring indicates when the trend is aligned with the indicator direction , the macd signal line measure's market sentiment blue for bearish yellow for bullish , the histogram works off rate of change rather then the cross over and color of the histogram indicates possible bull or bear reversal of trend
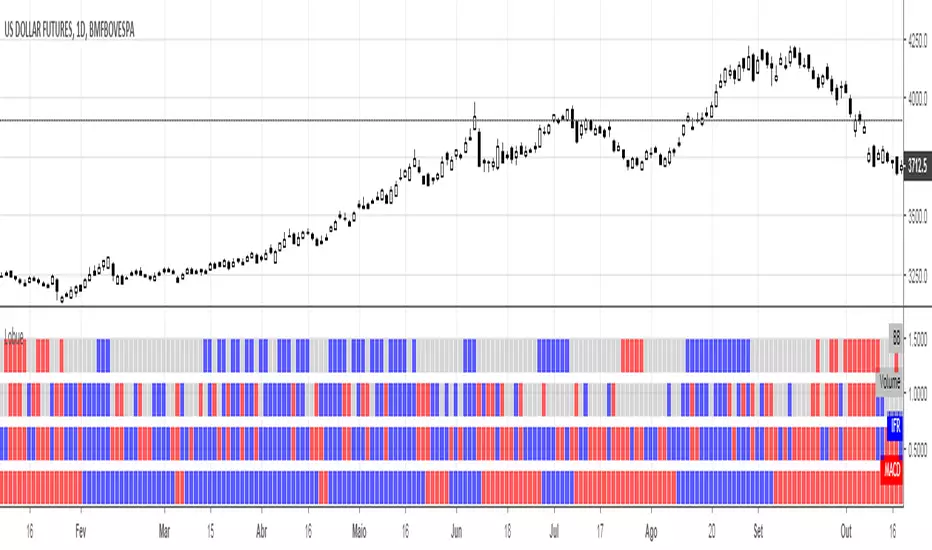
Lobue - colours flags.This script was built to be used in the future dollar market of B3 (Brazil), however, it could be applied in any market.
The differential of this indicator is that it is a group of indicators, which makes it difficult to fit into the existing categories in TradingView.
In spite of adding several technical indicators, it manages to make the screen very clean, since the conditions of the indicators are signaled by colored flags aligned with the current price.
This way of visualizing the indicators allows the use of several of them in a simple and without indecision.
In the current script are added the technical indicators: MACD, IFR, Volume with your average and Bollinger Bands, but with customizations, this script can adapt easily to the most varied technical indicators, without limit on the number of indicators and the coloring conditions.