VWMACD using EMA (Divergence Spotter)This plots the volume weight MACD using an EMA to calculate all averages and signals, which doesn't lag as much as normal moving averages. I only use this indicator to find divergence with price action to determine high probability reversal zones.
I use the following inputs:
Long = 13
Short = 8
Signal = 5
K-macd

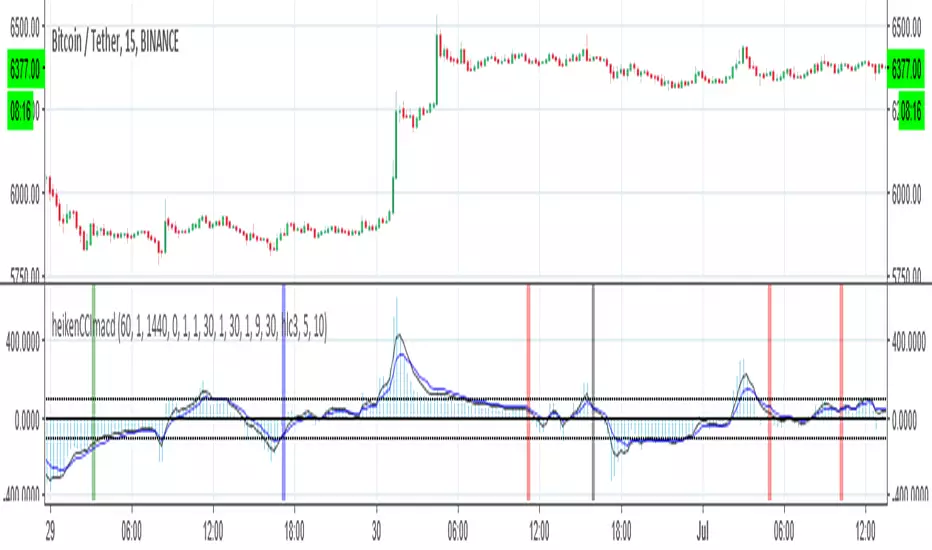
heikenCCImacdI just made new exit point and buy point to older version with some tweek
two buy system 1. based on heiken strategy with filtering by CCI (green red =long short) i little change the old exit point
the other 2. based on cross of CCI in constriction of macd (blue black =long1 shor1)
alerts included
so one can decide on what he like also it possible to combine between them :)
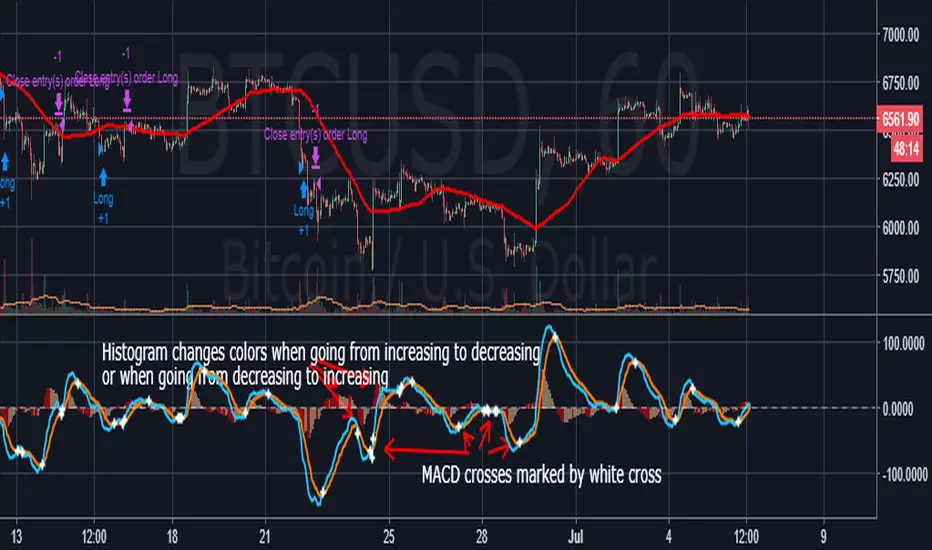
Better MACD with clearer cross and histogram signalsSimple but much needed visual improvements to the default MACD script. First, every time the MACD and signal cross, a white cross is placed on he chart, which lets you quickly identify the crosses. Second, whenever the histogram goes from increasing to decreasing or from increasing to decreasing, a color change occurs. Colors can be customized under "Style" tab under settings.
Difusor de Fluxo [André Moraes] - Flow DiffuserPORTUGUÊS
Difusor de Fluxo de André Moraes. É um MACD com mais uma média de longo prazo. Explicação do próprio André Moraes em www.youtube.com
ENGLISH
Flow Diffuser created by André Moraes. It's a MACD with an extra long length average. The author's explanation can be viewed at www.youtube.com

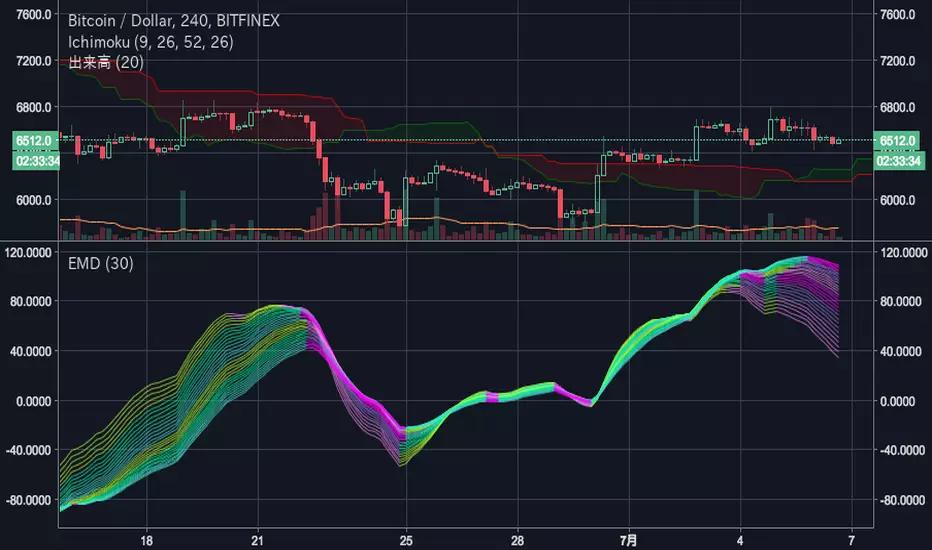
EvaMacD (ver. 3)Eva Chart calculate IIR Filter with Multiple MACD Histogram and estimate the cycle.
This oscillator can find the most powerful frequency. This use 30 MACD histogram lines tuned for filter.
Version3. Fix Bug.
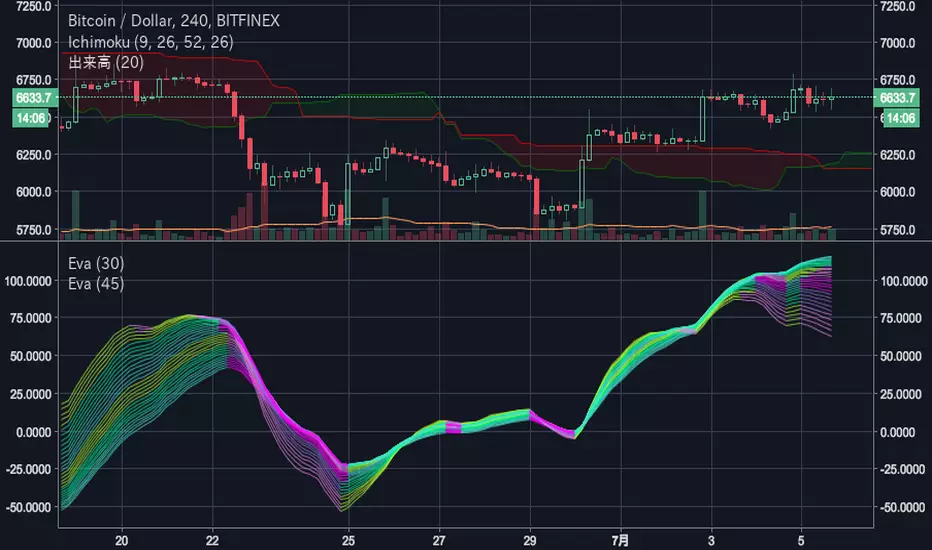
Eva ChartEva Chart calculate IIR Filter with Multiple MACD Histogram and estimate the cycle.
This oscillator can find the most powerful frequency.
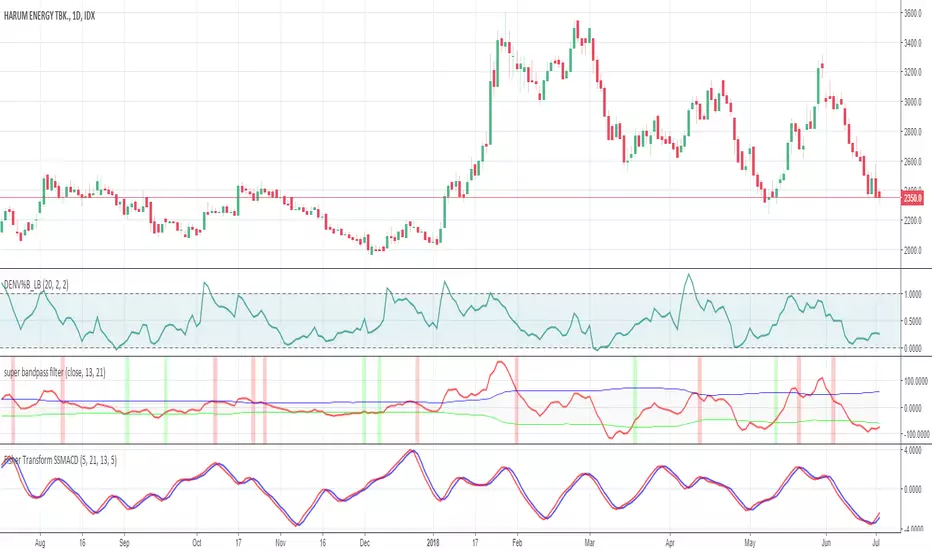
Fisher Transform SuperSmoothed MACD // This is a modification of Supersmoothed MACD (created by KIVANC using EHLERS' SUPER SMOOTHER FILTER) and sharpenned with Ehler fisher transform
//all lengths and parameters are completely configurable, tune the length according to your instrument
//give me what you think
Shadow MACDThis Script is basically made by looking this video (watch it for more informations)
-> www.youtube.com
For me MACD is one of the best indicators out there so with a faster macd it can help me find my entrys easier in the market
So i added the 4C MACD ( by vkno422) with a histogram MACD
Those are the best settings that i found for this strategy. if you find better just let me know ;)

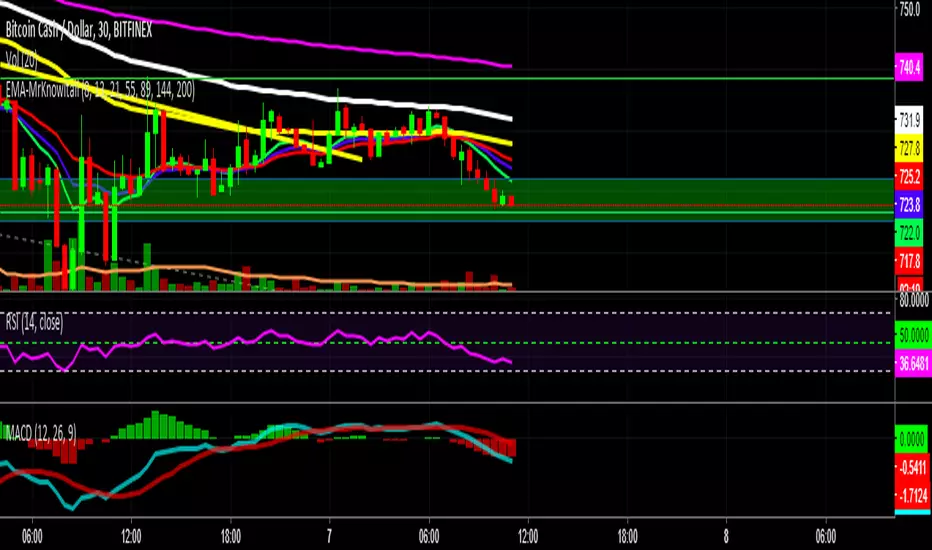
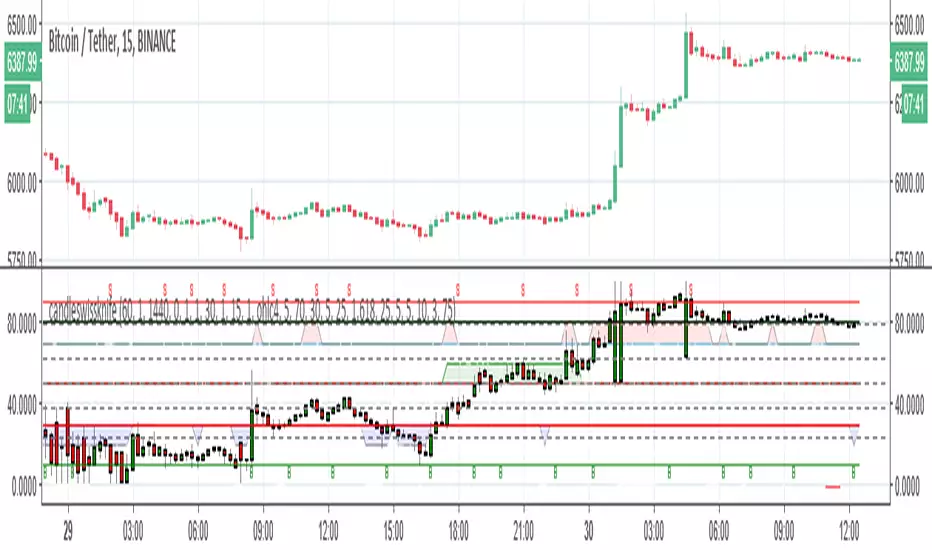
candleswissknifethere are two system to buy and sell in this indicator
system 1 is based on long ema and short ema with heiken candle and macd filter (green=buy and red=sell) line bellow the candles)
system 2 is based on fib candle and fast rsi and fast adx crossing (blue=buy line and gray=sell line bellow candle)
B and S are points of stoch rsi crossing
inside there are points of divergence based on ATR and rsi
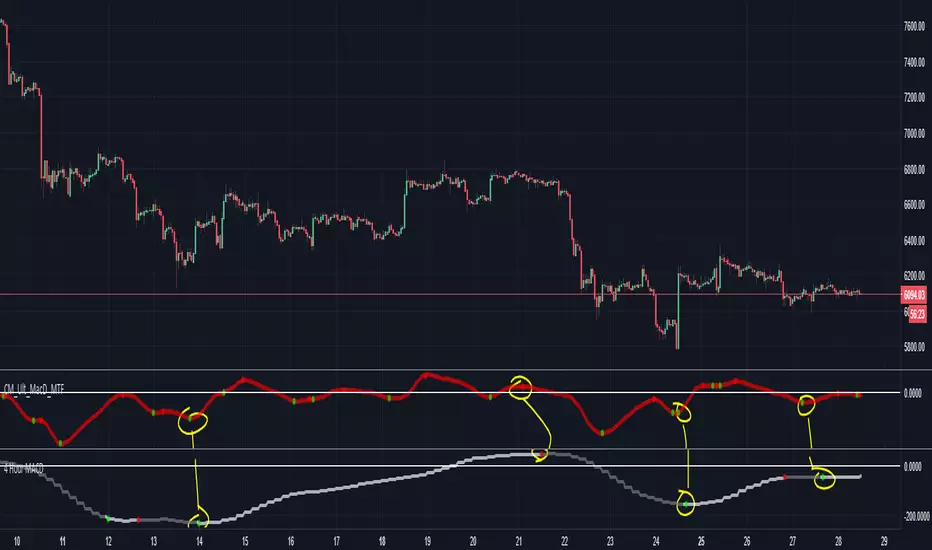
4 Hour MACD, Signal Line OnlyI call this my "anchor line" to show me the general direction of where bitcoin -0.51% is going on any given day.
Whether you are trading on 5m, 30m, 1h, this can provide you reinforcement for your directional bias (bullish/bearish)
I like to use this in place of a 50EMA or 200EMA to find the general direction of the trend, because it more precisely captures the fast rallies and dumps
Goes hand in hand with my "Dual Time Frame Momentum Strategy"
Disable the MACD line once you turn it on
Original credits go to ChrisMoody
stoch RSI-plus-macdThis stoch rsi plus , signal are based on rsi crossing at specific moments (green up) and sell based on stoch cross down (in red ) plus MACD to show the validity of the buy or sell points


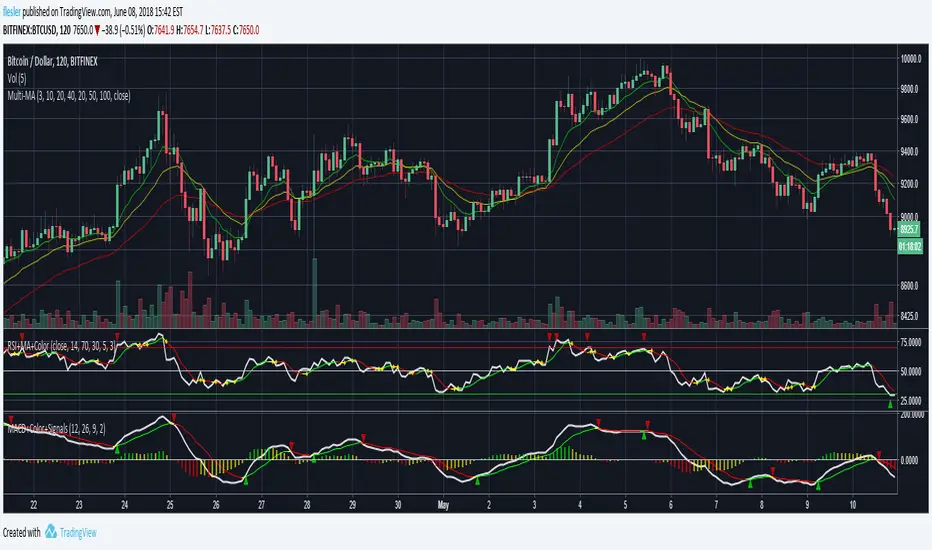
MACD + Colors + Signals
Standard MACD with signal and histogram
MACD and signal crossovers are marked with up/down triangles
Signal is colored based on its direction, can be turned to a single color
Histograms can be green, red and yellow based on their side and direction
Histograms can be switch to be green when positive and red when negative