[LJ] RSIM + ICT KillzonesIndicator Summary
This Pine Script indicator is a comprehensive, all-in-one toolkit designed for traders utilizing Inner Circle Trader (ICT) concepts. It visually maps out crucial time-based trading sessions, killzones, and key opening price levels directly on the chart. Alongside the time and price tools, it features a real-time "RSIM" (MTF RSI Monitor) dashboard to track market momentum across multiple timeframes, all while maintaining a lag-free chart through automated drawing cleanup.
Core Functionalities
ICT Killzones & Silver Bullets:
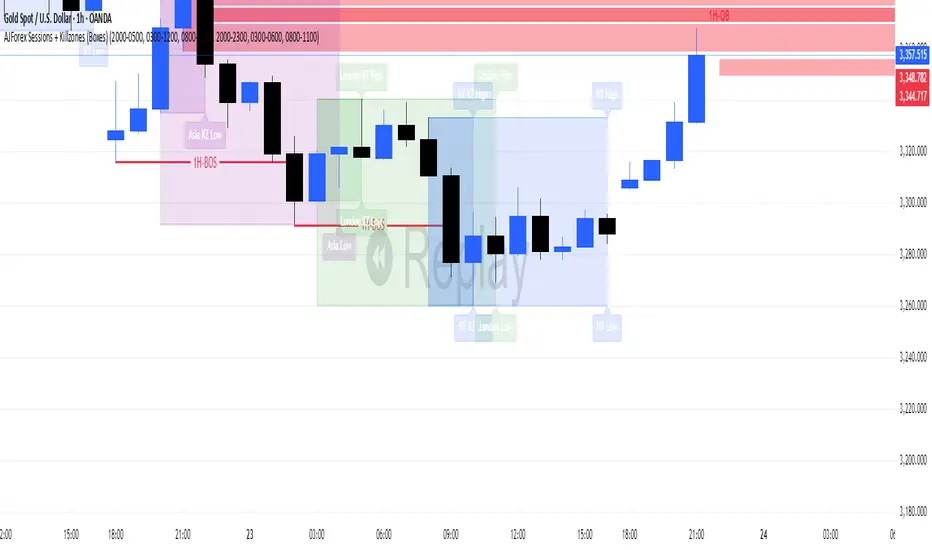
Visually demarcates specific high-probability trading windows—including the Asian, London, and New York (AM & PM) killzones, as well as the UK and US "Silver Bullet" times—using vertical lines and colored background highlights.
Key Opening Price Levels:
Automatically plots horizontal lines for significant opening prices, such as the New York Midnight Open (often used as true day open), CME Open, and NY AM/PM Opens. It also includes Higher Time Frame (HTF) levels for Weekly and Monthly opens.
Session High/Low Tracking:
Actively tracks and draws horizontal price levels for the High and Low of the current day, previous day, and individual Globex, Asian, London, and NY sessions.
Multi-Timeframe RSI Dashboard (RSIM):
An on-chart table that displays the current Relative Strength Index (RSI) values and a live countdown timer ("time to close") for the 5-minute, 15-minute, 1-hour, 4-hour, Daily, and Weekly timeframes.
Lunch "No-Trade-Zone":
Specifically highlights the New York Lunch period, visually warning traders of potential low-volume or erratic price action.
Automated Housekeeping:
A built-in memory management system that automatically deletes drawings (lines and labels) older than a user-defined number of days to prevent chart clutter and performance lag.
Built-in Debug Logger:
An optional on-chart logging table that tracks session triggers and script events, helping traders verify that times and levels are plotting correctly for their selected asset.
Indicatore Pine Script®