LAGging span leaves Bollinger Bands strategyAbstract
This script points out the positions a lagging span leaves a Bollinger Band.
This script does not plot a lagging span but moves the Bollinger Band forward.
You can find profit opportunities by combining this script and risk management.
Introduction
Bollinger Bands is a popular indicator.
It contains a moving average, an upper band and a lower band.
The moving average can indicate trend, the upper band and the lower band can indicate if the price is far away from the moving average.
However, in trading markets, anything can happen.
Both continuation and reversal are possible when the price touches the moving average, the upper band or the lower band.
Therefore, many traders adjust the parameters of the Bollinder Band or add other indicators to improve their trading strategies.
@Daveatt et. al. provided an idea that uses a lagging span.
A lagging span is a line chart. It displays the reference price but in earlier time.
For example, if the offset of a lagging span is 26 days, the value of the lagging span on 29 days ago is the reference price 3 days ago.
A lagging span is a part of Ichimoku Cloud.
It can compare the price to the earlier price and the values of indicators in the past.
To compare the price to the values of indicators in the past, we can also shift indicators forward instead of adding a lagging span into the chart.
This script uses shift-the-indicators-forward method.
In other words, this script plots the Bollinger Band forward so that the price can be compared to the values of the Bollinger Band in the past.
Computing and Adjusting
(1) Compute Moving Average
(2) Compute Standard Derivation
(3) Upper Band = Moving Average + Standard Derivation * Multi
(4) Lower Band = Moving Average - Standard Derivation * Multi
(5) Shift the Bollinger Band forward according to the offset parameter.
(6) Mark the points the price leaves the shifted Bollinger Band
(7) Compute the most possible loss and profit before the next opposite signal.
Parameters
source : the data for computing the bollinger band. can be open, high, low, close or their combination.
length : how many days are calculated by the bollinger band
mult : the distance from the moving average to the upper band and the distance from the moving average to the upper band is equal to ( mult * standard derivation ) .
x_offset : the offset of the lagging span
Conclusion
This script can find signals for potential breakout or trend continuation.
If you want to use this signal well, you need to know when to cut loss and protect the profit.
Reference
@Daveatt , Bollinger bands/Lagging span cross , BGyrPgOA , Tradingview 2019
How to trade with Bollinger Bands
How to use Ichimoku Cloud
How to trade with a line chart
Laggingspan

Bollinger Bands with Lagging Span(Chikou Span)Japanese below / 日本語説明は下記
Summary
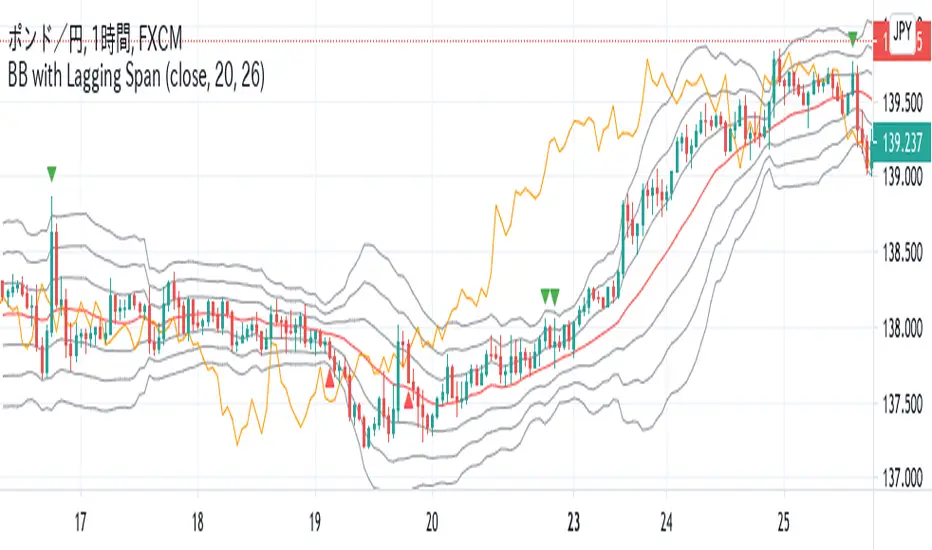
This indicator shows Bollinger bands with plus/minus 3σ bands and lagging span(called chikou span in Japanese as used in Ichimoku cloud) showing alert when lagging span crossing plus/minus 2σ bands, which are buy/sell signal respectively.
Bollinger bands are one of frequently used technical analysis indicators in trading and some traders use Bollinger bands and lagging span together in order to identify trading opportunities.
When lagging span crosses upper bands in bullish trend and lower bands in bearish trend, that would be considered buying/selling opportunities respectively.
Generally, lagging span is used offsetting current price by 26 period.
This indicator shows signal and alerts when lagging span crossing ±2σ bands as potential trading opportunities.
Functions
-To show Bollinger bands with plus/minus 3 sigma bands
-To show SMA as Bollinger bands middle line with configurable period of SMA.
-To show lagging span, enabling users to set lagging period and control display of lagging span by checkbox
-To show signal on chart when lagging span crosses +2σ bands and -2σ band with ability to set alert
-To control display of the signal by checkbox
Sample chart with the indicator
——————————————————————————————
概要
ボリンジャーバンド(±3シグマ)と遅行スパンを同時に表示するインジケーターです。遅行スパンが±2シグマと交差するとチャート上にシグナルを表示するとともに、アラートを設定することができます。
ボリンジャーバンドはテクニカル分析で最も使われているインジケーターの一つです。トレーダーの中にはボリンジャーバンドと遅行スパンを共に用いることで売り買いのサインを捉える手法を使っている方もいます。
上昇トレンドにおいては、遅行スパンがプラスのバンドを上抜いた時を買いサイン、下降トレンドにおいては、遅行スパンがマイナスのバンドを下抜いた時を売りサインとして捉えるものです。
一般的には、遅行スパンは現在価格を26期間オフセットしたラインが用いられます。
このインジケーターでは、遅行スパンがプラスマイナス2シグマを抜いた時にチャートへのシグナル表示と、アラート設定が可能です。
機能
-±1-3シグマのボリンジャーバンドの表示
-ボリンジャーバンドの基準線としてのSMAの表示(期間は設定可能)
-遅行スパンの表示(遅行期間の設定及び表示非表示の切り替え可能)
-遅行スパンがプラス2シグマバンドを上抜いた場合、マイナス2シグマバンドを下抜いた場合にチャート上にシグナルを表示(同じ条件でアラート設定が可能)
-シグナルの表示・非表示の切り替え
サンプルチャート
Bollinger bands/Lagging span crossHello my dear ambitious traders
I'm working hard this week to publish some great indicators this week and open sourced. Hope you'll enjoy, learn and use them.
This will be my greatest reward but comments showing appreciation are also very welcomed (actually likes too) :)
For today, I'll share a simple indicator but it's coming along with some insightful knowledge ^^
Anyway, I'm not here to ask you to this but to share a very cool indicator I made a few months ago and wanted to share for FREE with the community today
The indicator is related to this educational post : What-a-Bollinger-Bands-Lagging-span-cross-can-tell-us/
This trading technique was invented by Robbytrade, a famous french trader twitter.com
I wanted to have those visual signals on the chart so I coded it.
The advantage of being a developer is that you can litteraly code what you miss and get your life better in the process. The one that will find a way to code a new form of money will be rich... wait.... that guy is called Satoshi Nakamoto...
That's all for me today my friends
PS
Trying to update the Trade Manager shared yesterday with some cool features. More to come in the upcoming days
Enjoy
Dave

Triple Timeframe IchimokuVi presento il Triple Timeframe Ichimoku.
Questo indicatore applica tre Ichimoku completi al vostro grafico usando fino a ben 3 timeframe diversi:
Timeframe Attuale (quello impostato sul grafico che state visualizzando)
Timeframe B (personalizzabile tra i seguenti TF : 1m, 5m, 15m, H1, H2, H4, D, W, M)
Timeframe C (personalizzabile tra i seguenti TF : 1m, 5m, 15m, H1, H2, H4, D, W, M)
Il risultato è quello di avere immediatamente sott'occhio l'andamento dei prezzi senza dover fare zapping tra i vari timeframe: tutto chiaro subito!
L'indicatore è completamente personalizzabile, potete infatti:
Decidere quanti (da 1 a 3) e quali Ichimoku visualizzare
Scegliere per ogni Ichimoku se visualizzare o meno le linee dell'indicatore (Tenkan, Kijun e Laggin)
Scegliere per ogni Ichimoku se visualizzare o meno le nuvole dell'indicatore (SSA, SSB e Kumo)
Personalizzare i colori di ogni singola linea di ogni singolo Ichimoku
L'indicatore è estremamente utile per strategie basare sull'indicatore Ichimoku che richiedono il controllo su diversi Timeframe.
Buon trading a tutti!

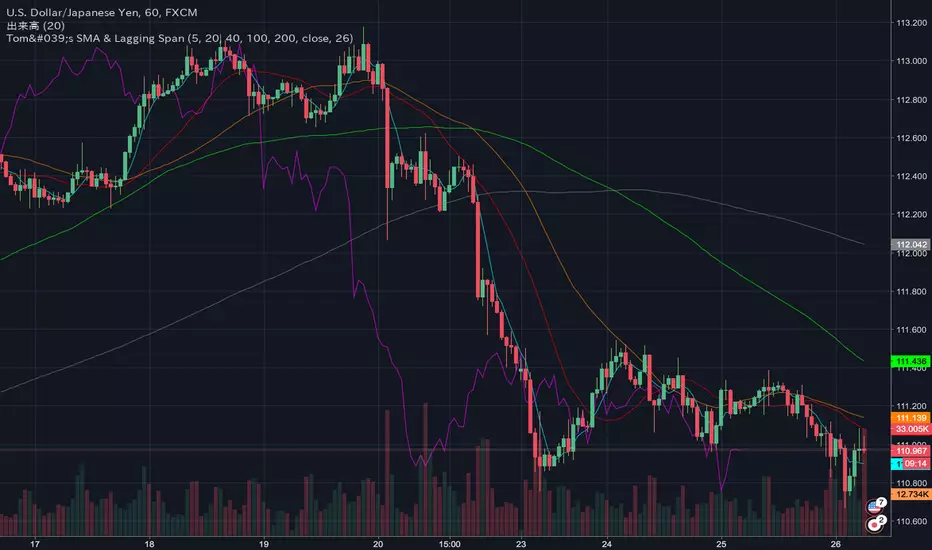
Tom's Moving Average & Lagging SpanSinple Moving Average 5 / 20 / 40 / 100 / 200
Ichimoku Lagging Span
tom_btcfx_fx setting