Vector2Library "Vector2"
Representation of two dimensional vectors or points.
This structure is used to represent positions in two dimensional space or vectors,
for example in spacial coordinates in 2D space.
~~~
references:
docs.unity3d.com
gist.github.com
github.com
gist.github.com
gist.github.com
gist.github.com
~~~
new(x, y)
Create a new Vector2 object.
Parameters:
x : float . The x value of the vector, default=0.
y : float . The y value of the vector, default=0.
Returns: Vector2. Vector2 object.
-> usage:
`unitx = Vector2.new(1.0) , plot(unitx.x)`
from(value)
Assigns value to a new vector `x,y` elements.
Parameters:
value : float, x and y value of the vector.
Returns: Vector2. Vector2 object.
-> usage:
`one = Vector2.from(1.0), plot(one.x)`
from(value, element_sep, open_par, close_par)
Assigns value to a new vector `x,y` elements.
Parameters:
value : string . The `x` and `y` value of the vector in a `x,y` or `(x,y)` format, spaces and parentesis will be removed automatically.
element_sep : string . Element separator character, default=`,`.
open_par : string . Open parentesis character, default=`(`.
close_par : string . Close parentesis character, default=`)`.
Returns: Vector2. Vector2 object.
-> usage:
`one = Vector2.from("1.0,2"), plot(one.x)`
copy(this)
Creates a deep copy of a vector.
Parameters:
this : Vector2 . Vector2 object.
Returns: Vector2. Vector2 object.
-> usage:
`a = Vector2.new(1.0) , b = a.copy() , plot(b.x)`
down()
Vector in the form `(0, -1)`.
Returns: Vector2. Vector2 object.
left()
Vector in the form `(-1, 0)`.
Returns: Vector2. Vector2 object.
right()
Vector in the form `(1, 0)`.
Returns: Vector2. Vector2 object.
up()
Vector in the form `(0, 1)`.
Returns: Vector2. Vector2 object.
one()
Vector in the form `(1, 1)`.
Returns: Vector2. Vector2 object.
zero()
Vector in the form `(0, 0)`.
Returns: Vector2. Vector2 object.
minus_one()
Vector in the form `(-1, -1)`.
Returns: Vector2. Vector2 object.
unit_x()
Vector in the form `(1, 0)`.
Returns: Vector2. Vector2 object.
unit_y()
Vector in the form `(0, 1)`.
Returns: Vector2. Vector2 object.
nan()
Vector in the form `(float(na), float(na))`.
Returns: Vector2. Vector2 object.
xy(this)
Return the values of `x` and `y` as a tuple.
Parameters:
this : Vector2 . Vector2 object.
Returns: .
-> usage:
`a = Vector2.new(1.0, 1.0) , = a.xy() , plot(ax)`
length_squared(this)
Length of vector `a` in the form. `a.x^2 + a.y^2`, for comparing vectors this is computationaly lighter.
Parameters:
this : Vector2 . Vector2 object.
Returns: float. Squared length of vector.
-> usage:
`a = Vector2.new(1.0, 1.0) , plot(a.length_squared())`
length(this)
Magnitude of vector `a` in the form. `sqrt(a.x^2 + a.y^2)`
Parameters:
this : Vector2 . Vector2 object.
Returns: float. Length of vector.
-> usage:
`a = Vector2.new(1.0, 1.0) , plot(a.length())`
normalize(a)
Vector normalized with a magnitude of 1, in the form. `a / length(a)`.
Parameters:
a : Vector2 . Vector2 object.
Returns: Vector2. Vector2 object.
-> usage:
`a = normalize(Vector2.new(3.0, 2.0)) , plot(a.y)`
isNA(this)
Checks if any of the components is `na`.
Parameters:
this : Vector2 . Vector2 object.
Returns: bool.
usage:
p = Vector2.new(1.0, na) , plot(isNA(p)?1:0)
add(a, b)
Adds vector `b` to `a`, in the form `(a.x + b.x, a.y + b.y)`.
Parameters:
a : Vector2 . Vector2 object.
b : Vector2 . Vector2 object.
Returns: Vector2. Vector2 object.
-> usage:
`a = one() , b = one() , c = add(a, b) , plot(c.x)`
add(a, b)
Adds vector `b` to `a`, in the form `(a.x + b, a.y + b)`.
Parameters:
a : Vector2 . Vector2 object.
b : float . Value.
Returns: Vector2. Vector2 object.
-> usage:
`a = one() , b = 1.0 , c = add(a, b) , plot(c.x)`
add(a, b)
Adds vector `b` to `a`, in the form `(a + b.x, a + b.y)`.
Parameters:
a : float . Value.
b : Vector2 . Vector2 object.
Returns: Vector2. Vector2 object.
-> usage:
`a = 1.0 , b = one() , c = add(a, b) , plot(c.x)`
subtract(a, b)
Subtract vector `b` from `a`, in the form `(a.x - b.x, a.y - b.y)`.
Parameters:
a : Vector2 . Vector2 object.
b : Vector2 . Vector2 object.
Returns: Vector2. Vector2 object.
-> usage:
`a = one() , b = one() , c = subtract(a, b) , plot(c.x)`
subtract(a, b)
Subtract vector `b` from `a`, in the form `(a.x - b, a.y - b)`.
Parameters:
a : Vector2 . vector2 object.
b : float . Value.
Returns: Vector2. Vector2 object.
-> usage:
`a = one() , b = 1.0 , c = subtract(a, b) , plot(c.x)`
subtract(a, b)
Subtract vector `b` from `a`, in the form `(a - b.x, a - b.y)`.
Parameters:
a : float . value.
b : Vector2 . Vector2 object.
Returns: Vector2. Vector2 object.
-> usage:
`a = 1.0 , b = one() , c = subtract(a, b) , plot(c.x)`
multiply(a, b)
Multiply vector `a` with `b`, in the form `(a.x * b.x, a.y * b.y)`.
Parameters:
a : Vector2 . Vector2 object.
b : Vector2 . Vector2 object.
Returns: Vector2. Vector2 object.
-> usage:
`a = one() , b = one() , c = multiply(a, b) , plot(c.x)`
multiply(a, b)
Multiply vector `a` with `b`, in the form `(a.x * b, a.y * b)`.
Parameters:
a : Vector2 . Vector2 object.
b : float . Value.
Returns: Vector2. Vector2 object.
-> usage:
`a = one() , b = 1.0 , c = multiply(a, b) , plot(c.x)`
multiply(a, b)
Multiply vector `a` with `b`, in the form `(a * b.x, a * b.y)`.
Parameters:
a : float . Value.
b : Vector2 . Vector2 object.
Returns: Vector2. Vector2 object.
-> usage:
`a = 1.0 , b = one() , c = multiply(a, b) , plot(c.x)`
divide(a, b)
Divide vector `a` with `b`, in the form `(a.x / b.x, a.y / b.y)`.
Parameters:
a : Vector2 . Vector2 object.
b : Vector2 . Vector2 object.
Returns: Vector2. Vector2 object.
-> usage:
`a = from(3.0) , b = from(2.0) , c = divide(a, b) , plot(c.x)`
divide(a, b)
Divide vector `a` with value `b`, in the form `(a.x / b, a.y / b)`.
Parameters:
a : Vector2 . Vector2 object.
b : float . Value.
Returns: Vector2. Vector2 object.
-> usage:
`a = from(3.0) , b = 2.0 , c = divide(a, b) , plot(c.x)`
divide(a, b)
Divide value `a` with vector `b`, in the form `(a / b.x, a / b.y)`.
Parameters:
a : float . Value.
b : Vector2 . Vector2 object.
Returns: Vector2. Vector2 object.
-> usage:
`a = 3.0 , b = from(2.0) , c = divide(a, b) , plot(c.x)`
negate(a)
Negative of vector `a`, in the form `(-a.x, -a.y)`.
Parameters:
a : Vector2 . Vector2 object.
Returns: Vector2. Vector2 object.
-> usage:
`a = from(3.0) , b = a.negate , plot(b.x)`
pow(a, b)
Raise vector `a` with exponent vector `b`, in the form `(a.x ^ b.x, a.y ^ b.y)`.
Parameters:
a : Vector2 . Vector2 object.
b : Vector2 . Vector2 object.
Returns: Vector2. Vector2 object.
-> usage:
`a = from(3.0) , b = from(2.0) , c = pow(a, b) , plot(c.x)`
pow(a, b)
Raise vector `a` with value `b`, in the form `(a.x ^ b, a.y ^ b)`.
Parameters:
a : Vector2 . Vector2 object.
b : float . Value.
Returns: Vector2. Vector2 object.
-> usage:
`a = from(3.0) , b = 2.0 , c = pow(a, b) , plot(c.x)`
pow(a, b)
Raise value `a` with vector `b`, in the form `(a ^ b.x, a ^ b.y)`.
Parameters:
a : float . Value.
b : Vector2 . Vector2 object.
Returns: Vector2. Vector2 object.
-> usage:
`a = 3.0 , b = from(2.0) , c = pow(a, b) , plot(c.x)`
sqrt(a)
Square root of the elements in a vector.
Parameters:
a : Vector2 . Vector2 object.
Returns: Vector2. Vector2 object.
-> usage:
`a = from(3.0) , b = sqrt(a) , plot(b.x)`
abs(a)
Absolute properties of the vector.
Parameters:
a : Vector2 . Vector2 object.
Returns: Vector2. Vector2 object.
-> usage:
`a = from(-3.0) , b = abs(a) , plot(b.x)`
min(a)
Lowest element of a vector.
Parameters:
a : Vector2 . Vector2 object.
Returns: float.
-> usage:
`a = new(3.0, 1.5) , b = min(a) , plot(b)`
max(a)
Highest element of a vector.
Parameters:
a : Vector2 . Vector2 object.
Returns: float.
-> usage:
`a = new(3.0, 1.5) , b = max(a) , plot(b)`
vmax(a, b)
Highest elements of two vectors.
Parameters:
a : Vector2 . Vector2 object.
b : Vector2 . Vector2 object.
Returns: Vector2. Vector2 object.
-> usage:
`a = new(3.0, 2.0) , b = new(2.0, 3.0) , c = vmax(a, b) , plot(c.x)`
vmax(a, b, c)
Highest elements of three vectors.
Parameters:
a : Vector2 . Vector2 object.
b : Vector2 . Vector2 object.
c : Vector2 . Vector2 object.
Returns: Vector2. Vector2 object.
-> usage:
`a = new(3.0, 2.0) , b = new(2.0, 3.0) , c = new(1.5, 4.5) , d = vmax(a, b, c) , plot(d.x)`
vmin(a, b)
Lowest elements of two vectors.
Parameters:
a : Vector2 . Vector2 object.
b : Vector2 . Vector2 object.
Returns: Vector2. Vector2 object.
-> usage:
`a = new(3.0, 2.0) , b = new(2.0, 3.0) , c = vmin(a, b) , plot(c.x)`
vmin(a, b, c)
Lowest elements of three vectors.
Parameters:
a : Vector2 . Vector2 object.
b : Vector2 . Vector2 object.
c : Vector2 . Vector2 object.
Returns: Vector2. Vector2 object.
-> usage:
`a = new(3.0, 2.0) , b = new(2.0, 3.0) , c = new(1.5, 4.5) , d = vmin(a, b, c) , plot(d.x)`
perp(a)
Perpendicular Vector of `a`, in the form `(a.y, -a.x)`.
Parameters:
a : Vector2 . Vector2 object.
Returns: Vector2. Vector2 object.
-> usage:
`a = new(3.0, 1.5) , b = perp(a) , plot(b.x)`
floor(a)
Compute the floor of vector `a`.
Parameters:
a : Vector2 . Vector2 object.
Returns: Vector2. Vector2 object.
-> usage:
`a = new(3.0, 1.5) , b = floor(a) , plot(b.x)`
ceil(a)
Ceils vector `a`.
Parameters:
a : Vector2 . Vector2 object.
Returns: Vector2. Vector2 object.
-> usage:
`a = new(3.0, 1.5) , b = ceil(a) , plot(b.x)`
ceil(a, digits)
Ceils vector `a`.
Parameters:
a : Vector2 . Vector2 object.
digits : int . Digits to use as ceiling.
Returns: Vector2. Vector2 object.
round(a)
Round of vector elements.
Parameters:
a : Vector2 . Vector2 object.
Returns: Vector2. Vector2 object.
-> usage:
`a = new(3.0, 1.5) , b = round(a) , plot(b.x)`
round(a, precision)
Round of vector elements.
Parameters:
a : Vector2 . Vector2 object.
precision : int . Number of digits to round vector "a" elements.
Returns: Vector2. Vector2 object.
-> usage:
`a = new(0.123456, 1.234567) , b = round(a, 2) , plot(b.x)`
fractional(a)
Compute the fractional part of the elements from vector `a`.
Parameters:
a : Vector2 . Vector2 object.
Returns: Vector2. Vector2 object.
-> usage:
`a = new(3.123456, 1.23456) , b = fractional(a) , plot(b.x)`
dot_product(a, b)
dot_product product of 2 vectors, in the form `a.x * b.x + a.y * b.y.
Parameters:
a : Vector2 . Vector2 object.
b : Vector2 . Vector2 object.
Returns: float.
-> usage:
`a = new(3.0, 1.5) , b = from(2.0) , c = dot_product(a, b) , plot(c)`
cross_product(a, b)
cross product of 2 vectors, in the form `a.x * b.y - a.y * b.x`.
Parameters:
a : Vector2 . Vector2 object.
b : Vector2 . Vector2 object.
Returns: float.
-> usage:
`a = new(3.0, 1.5) , b = from(2.0) , c = cross_product(a, b) , plot(c)`
equals(a, b)
Compares two vectors
Parameters:
a : Vector2 . Vector2 object.
b : Vector2 . Vector2 object.
Returns: bool. Representing the equality.
-> usage:
`a = new(3.0, 1.5) , b = from(2.0) , c = equals(a, b) ? 1 : 0 , plot(c)`
sin(a)
Compute the sine of argument vector `a`.
Parameters:
a : Vector2 . Vector2 object.
Returns: Vector2. Vector2 object.
-> usage:
`a = new(3.0, 1.5) , b = sin(a) , plot(b.x)`
cos(a)
Compute the cosine of argument vector `a`.
Parameters:
a : Vector2 . Vector2 object.
Returns: Vector2. Vector2 object.
-> usage:
`a = new(3.0, 1.5) , b = cos(a) , plot(b.x)`
tan(a)
Compute the tangent of argument vector `a`.
Parameters:
a : Vector2 . Vector2 object.
Returns: Vector2. Vector2 object.
-> usage:
`a = new(3.0, 1.5) , b = tan(a) , plot(b.x)`
atan2(x, y)
Approximation to atan2 calculation, arc tangent of `y/x` in the range (-pi,pi) radians.
Parameters:
x : float . The x value of the vector.
y : float . The y value of the vector.
Returns: float. Value with angle in radians. (negative if quadrante 3 or 4)
-> usage:
`a = new(3.0, 1.5) , b = atan2(a.x, a.y) , plot(b)`
atan2(a)
Approximation to atan2 calculation, arc tangent of `y/x` in the range (-pi,pi) radians.
Parameters:
a : Vector2 . Vector2 object.
Returns: float, value with angle in radians. (negative if quadrante 3 or 4)
-> usage:
`a = new(3.0, 1.5) , b = atan2(a) , plot(b)`
distance(a, b)
Distance between vector `a` and `b`.
Parameters:
a : Vector2 . Vector2 object.
b : Vector2 . Vector2 object.
Returns: float.
-> usage:
`a = new(3.0, 1.5) , b = from(2.0) , c = distance(a, b) , plot(c)`
rescale(a, length)
Rescale a vector to a new magnitude.
Parameters:
a : Vector2 . Vector2 object.
length : float . Magnitude.
Returns: Vector2. Vector2 object.
-> usage:
`a = new(3.0, 1.5) , b = 2.0 , c = rescale(a, b) , plot(c.x)`
rotate(a, radians)
Rotates vector by a angle.
Parameters:
a : Vector2 . Vector2 object.
radians : float . Angle value in radians.
Returns: Vector2. Vector2 object.
-> usage:
`a = new(3.0, 1.5) , b = 2.0 , c = rotate(a, b) , plot(c.x)`
rotate_degree(a, degree)
Rotates vector by a angle.
Parameters:
a : Vector2 . Vector2 object.
degree : float . Angle value in degrees.
Returns: Vector2. Vector2 object.
-> usage:
`a = new(3.0, 1.5) , b = 45.0 , c = rotate_degree(a, b) , plot(c.x)`
rotate_around(this, center, angle)
Rotates vector `target` around `origin` by angle value.
Parameters:
this
center : Vector2 . Vector2 object.
angle : float . Angle value in degrees.
Returns: Vector2. Vector2 object.
-> usage:
`a = new(3.0, 1.5) , b = from(2.0) , c = rotate_around(a, b, 45.0) , plot(c.x)`
perpendicular_distance(a, b, c)
Distance from point `a` to line between `b` and `c`.
Parameters:
a : Vector2 . Vector2 object.
b : Vector2 . Vector2 object.
c : Vector2 . Vector2 object.
Returns: float.
-> usage:
`a = new(1.5, 2.6) , b = from(1.0) , c = from(3.0) , d = perpendicular_distance(a, b, c) , plot(d.x)`
project(a, axis)
Project a vector onto another.
Parameters:
a : Vector2 . Vector2 object.
axis : Vector2 . Vector2 object.
Returns: Vector2. Vector2 object.
-> usage:
`a = new(3.0, 1.5) , b = from(2.0) , c = project(a, b) , plot(c.x)`
projectN(a, axis)
Project a vector onto a vector of unit length.
Parameters:
a : Vector2 . Vector2 object.
axis : Vector2 . Vector2 object.
Returns: Vector2. Vector2 object.
-> usage:
`a = new(3.0, 1.5) , b = from(2.0) , c = projectN(a, b) , plot(c.x)`
reflect(a, axis)
Reflect a vector on another.
Parameters:
a : Vector2 . Vector2 object.
axis
Returns: Vector2. Vector2 object.
-> usage:
`a = new(3.0, 1.5) , b = from(2.0) , c = reflect(a, b) , plot(c.x)`
reflectN(a, axis)
Reflect a vector to a arbitrary axis.
Parameters:
a : Vector2 . Vector2 object.
axis
Returns: Vector2. Vector2 object.
-> usage:
`a = new(3.0, 1.5) , b = from(2.0) , c = reflectN(a, b) , plot(c.x)`
angle(a)
Angle in radians of a vector.
Parameters:
a : Vector2 . Vector2 object.
Returns: float.
-> usage:
`a = new(3.0, 1.5) , b = angle(a) , plot(b)`
angle_unsigned(a, b)
unsigned degree angle between 0 and +180 by given two vectors.
Parameters:
a : Vector2 . Vector2 object.
b : Vector2 . Vector2 object.
Returns: float.
-> usage:
`a = new(3.0, 1.5) , b = from(2.0) , c = angle_unsigned(a, b) , plot(c)`
angle_signed(a, b)
Signed degree angle between -180 and +180 by given two vectors.
Parameters:
a : Vector2 . Vector2 object.
b : Vector2 . Vector2 object.
Returns: float.
-> usage:
`a = new(3.0, 1.5) , b = from(2.0) , c = angle_signed(a, b) , plot(c)`
angle_360(a, b)
Degree angle between 0 and 360 by given two vectors
Parameters:
a : Vector2 . Vector2 object.
b : Vector2 . Vector2 object.
Returns: float.
-> usage:
`a = new(3.0, 1.5) , b = from(2.0) , c = angle_360(a, b) , plot(c)`
clamp(a, min, max)
Restricts a vector between a min and max value.
Parameters:
a : Vector2 . Vector2 object.
min
max
Returns: Vector2. Vector2 object.
-> usage:
`a = new(3.0, 1.5) , b = from(2.0) , c = from(2.5) , d = clamp(a, b, c) , plot(d.x)`
clamp(a, min, max)
Restricts a vector between a min and max value.
Parameters:
a : Vector2 . Vector2 object.
min : float . Lower boundary value.
max : float . Higher boundary value.
Returns: Vector2. Vector2 object.
-> usage:
`a = new(3.0, 1.5) , b = clamp(a, 2.0, 2.5) , plot(b.x)`
lerp(a, b, rate)
Linearly interpolates between vectors a and b by rate.
Parameters:
a : Vector2 . Vector2 object.
b : Vector2 . Vector2 object.
rate : float . Value between (a:-infinity -> b:1.0), negative values will move away from b.
Returns: Vector2. Vector2 object.
-> usage:
`a = new(3.0, 1.5) , b = from(2.0) , c = lerp(a, b, 0.5) , plot(c.x)`
herp(a, b, rate)
Hermite curve interpolation between vectors a and b by rate.
Parameters:
a : Vector2 . Vector2 object.
b : Vector2 . Vector2 object.
rate : Vector2 . Vector2 object. Value between (a:0 > 1:b).
Returns: Vector2. Vector2 object.
-> usage:
`a = new(3.0, 1.5) , b = from(2.0) , c = from(2.5) , d = herp(a, b, c) , plot(d.x)`
transform(position, mat)
Transform a vector by the given matrix.
Parameters:
position : Vector2 . Source vector.
mat : M32 . Transformation matrix
Returns: Vector2. Transformed vector.
transform(position, mat)
Transform a vector by the given matrix.
Parameters:
position : Vector2 . Source vector.
mat : M44 . Transformation matrix
Returns: Vector2. Transformed vector.
transform(position, mat)
Transform a vector by the given matrix.
Parameters:
position : Vector2 . Source vector.
mat : matrix . Transformation matrix, requires a 3x2 or a 4x4 matrix.
Returns: Vector2. Transformed vector.
transform(this, rotation)
Transform a vector by the given quaternion rotation value.
Parameters:
this : Vector2 . Source vector.
rotation : Quaternion . Rotation to apply.
Returns: Vector2. Transformed vector.
area_triangle(a, b, c)
Find the area in a triangle of vectors.
Parameters:
a : Vector2 . Vector2 object.
b : Vector2 . Vector2 object.
c : Vector2 . Vector2 object.
Returns: float.
-> usage:
`a = new(1.0, 2.0) , b = from(2.0) , c = from(1.0) , d = area_triangle(a, b, c) , plot(d.x)`
random(max)
2D random value.
Parameters:
max : Vector2 . Vector2 object. Vector upper boundary.
Returns: Vector2. Vector2 object.
-> usage:
`a = from(2.0) , b = random(a) , plot(b.x)`
random(max)
2D random value.
Parameters:
max : float, Vector upper boundary.
Returns: Vector2. Vector2 object.
-> usage:
`a = random(2.0) , plot(a.x)`
random(min, max)
2D random value.
Parameters:
min : Vector2 . Vector2 object. Vector lower boundary.
max : Vector2 . Vector2 object. Vector upper boundary.
Returns: Vector2. Vector2 object.
-> usage:
`a = from(1.0) , b = from(2.0) , c = random(a, b) , plot(c.x)`
random(min, max)
2D random value.
Parameters:
min : Vector2 . Vector2 object. Vector lower boundary.
max : Vector2 . Vector2 object. Vector upper boundary.
Returns: Vector2. Vector2 object.
-> usage:
`a = random(1.0, 2.0) , plot(a.x)`
noise(a)
2D Noise based on Morgan McGuire @morgan3d.
Parameters:
a : Vector2 . Vector2 object.
Returns: Vector2. Vector2 object.
-> usage:
`a = from(2.0) , b = noise(a) , plot(b.x)`
to_string(a)
Converts vector `a` to a string format, in the form `"(x, y)"`.
Parameters:
a : Vector2 . Vector2 object.
Returns: string. In `"(x, y)"` format.
-> usage:
`a = from(2.0) , l = barstate.islast ? label.new(bar_index, 0.0, to_string(a)) : label(na)`
to_string(a, format)
Converts vector `a` to a string format, in the form `"(x, y)"`.
Parameters:
a : Vector2 . Vector2 object.
format : string . Format to apply transformation.
Returns: string. In `"(x, y)"` format.
-> usage:
`a = from(2.123456) , l = barstate.islast ? label.new(bar_index, 0.0, to_string(a, "#.##")) : label(na)`
to_array(a)
Converts vector to a array format.
Parameters:
a : Vector2 . Vector2 object.
Returns: array.
-> usage:
`a = from(2.0) , b = to_array(a) , plot(array.get(b, 0))`
to_barycentric(this, a, b, c)
Captures the barycentric coordinate of a cartesian position in the triangle plane.
Parameters:
this : Vector2 . Source cartesian coordinate position.
a : Vector2 . Triangle corner `a` vertice.
b : Vector2 . Triangle corner `b` vertice.
c : Vector2 . Triangle corner `c` vertice.
Returns: bool.
from_barycentric(this, a, b, c)
Captures the cartesian coordinate of a barycentric position in the triangle plane.
Parameters:
this : Vector2 . Source barycentric coordinate position.
a : Vector2 . Triangle corner `a` vertice.
b : Vector2 . Triangle corner `b` vertice.
c : Vector2 . Triangle corner `c` vertice.
Returns: bool.
to_complex(this)
Translate a Vector2 structure to complex.
Parameters:
this : Vector2 . Source vector.
Returns: Complex.
to_polar(this)
Translate a Vector2 cartesian coordinate into polar coordinates.
Parameters:
this : Vector2 . Source vector.
Returns: Pole. The returned angle is in radians.
Library
Replica of TradingView's Backtesting Engine with ArraysHello everyone,
Here is a perfectly replicated TradingView backtesting engine condensed into a single library function calculated with arrays. It includes TradingView's calculations for Net profit, Total Trades, Percent of Trades Profitable, Profit Factor, Max Drawdown (absolute and percent), and Average Trade (absolute and percent). Here's how TradingView defines each aspect of its backtesting system:
Net Profit: The overall profit or loss achieved.
Total Trades: The total number of closed trades, winning and losing.
Percent Profitable: The percentage of winning trades, the number of winning trades divided by the total number of closed trades.
Profit Factor: The amount of money the strategy made for every unit of money it lost, gross profits divided by gross losses.
Max Drawdown: The greatest loss drawdown, i.e., the greatest possible loss the strategy had compared to its highest profits.
Average Trade: The sum of money gained or lost by the average trade, Net Profit divided by the overall number of closed trades.
Here's how each variable is defined in the library function:
_backtest(bool _enter, bool _exit, float _startQty, float _tradeQty)
bool _enter: When the strategy should enter a trade (entry condition)
bool _exit: When the strategy should exit a trade (exit condition)
float _startQty: The starting capital in the account (for BTCUSD, it is the amount of USD the account starts with)
float _tradeQty: The amount of capital traded (if set to 1000 on BTCUSD, it will trade 1000 USD on each trade)
Currently, this library only works with long strategies, and I've included a commented out section under DEMO STRATEGY where you can replicate my results with TradingView's backtesting engine. There's tons I could do with this beyond what is shown, but this was a project I worked on back in June of 2022 before getting burned out. Feel free to comment with any suggestions or bugs, and I'll try to add or fix them all soon. Here's my list of thing to add to the library currently (may not all be added):
Add commission calculations.
Add support for shorting
Add a graph that resembles TradingView's overview graph.
Clean and optimize code.
Clean up in a way that makes it easy to add other TradingView calculations (such as Sharpe and Sortino ratio).
Separate all variables, so they become accessible outside of calculations (such as gross profit, gross loss, number of winning trades, number of losing trades, etc.).
Thanks for reading,
OztheWoz

HendrixLIBRARY - utilsLibrary "HendrixLIBRARY"
getVolumeData()
getLTF(customTimeframe, ltf)
Parameters:
customTimeframe
ltf
sumArray(a)
Parameters:
a
arrs2vals(upVolumeArray, downVolumeArray, volArr)
Parameters:
upVolumeArray
downVolumeArray
volArr
getVolumesFromUpDownArrays(upVolumeArray, downVolumeArray)
Parameters:
upVolumeArray
downVolumeArray
getDeltaFromVolumes(upVolume, downVolume)
Parameters:
upVolume
downVolume
getDeltaFromUpDownArrays(upVolumeArray, downVolumeArray)
Parameters:
upVolumeArray
downVolumeArray
getUpColor()
getDownColor()
getBlackColor()
getColors()
printTableTR(txt)
Parameters:
txt
printTableBR(txt)
Parameters:
txt
printTableMR(txt)
Parameters:
txt
print(txt, lbl)
Parameters:
txt
lbl
printSyminfo(sym)
Parameters:
sym
ReduceSecurityCallsLibrary "ReduceSecurityCalls"
This library allows you to reduce the number of request.security calls to 1 per symbol per timeframe. Script provides example how to use it with request.security and possible optimisation applied to htf data call.
This data can be used to calculate everything you need and more than that (for example you can calculate 4 emas with one function call on mat_out).
ParseSource(mat_outs, o)
Should be used inside request.security call. Optimise your calls using timeframe.change when htf data parsing! Supports up to 5 expressions (results of expressions must be float or int)
Parameters:
mat_outs : Matrix to be used as outputs, first value is newest
o : Please use parametres in the order they specified (o should be 1st, h should be 2nd etc..)
Returns: outs array, due to weird limitations do not try this :matrix_out = matrix.copy(ParseSource)

SetSessionTimesIndiaLibrary "SetSessionTimesIndia"
This library might be useful to code an indicator or strategy that requires to call Indian trading sessions at NSE and MCX.
SetSessionTimes()

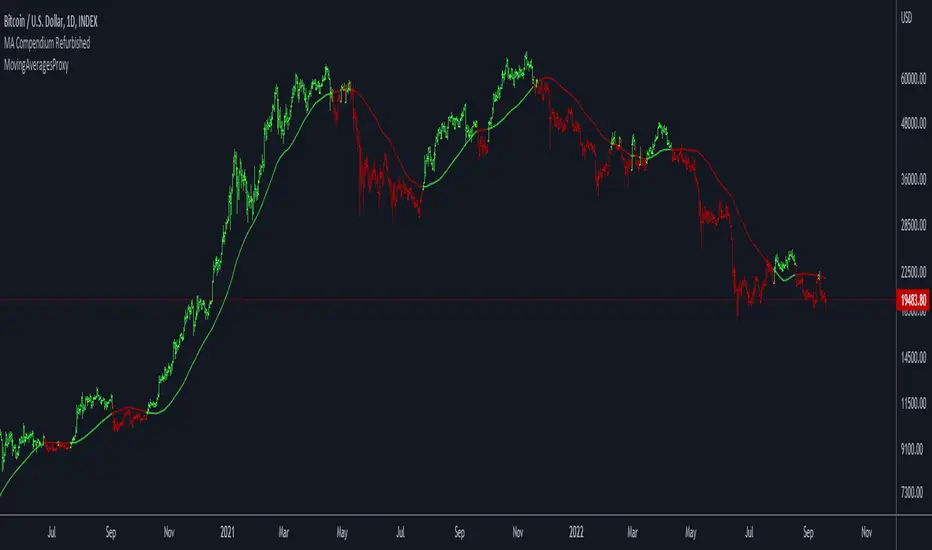
Moving Averages ProxyLibrary "MovingAveragesProxy"
Moving Averages Proxy - Library of all moving averages spread out in different libraries
rvwap(_src, fixedTfInput, minsInput, hoursInput, daysInput, minBarsInput)
Calculates the Rolling VWAP (customized VWAP developed by the team of TradingView)
Parameters:
_src : (float) Source. Default: close
fixedTfInput : (bool) Use a fixed time period. Default: false
minsInput : (int) Minutes. Default: 0
hoursInput : (int) Hours. Default: 0
daysInput : (int) Days. Default: 1
minBarsInput : (int) Bars. Default: 10
Returns: (float) Rolling VWAP
correlationMa(src, len, factor)
Correlation Moving Average
Parameters:
src : (float) Source. Default: close
len : (int) Length
factor : (float) Factor. Default: 1.7
Returns: (float) Correlation Moving Average
regma(src, len, lambda)
Regularized Exponential Moving Average
Parameters:
src : (float) Source. Default: close
len : (int) Length
lambda : (float) Lambda. Default: 0.5
Returns: (float) Regularized Exponential Moving Average
repma(src, len)
Repulsion Moving Average
Parameters:
src : (float) Source. Default: close
len : (int) Length
Returns: (float) Repulsion Moving Average
epma(src, length, offset)
End Point Moving Average
Parameters:
src : (float) Source. Default: close
length : (int) Length
offset : (float) Offset. Default: 4
Returns: (float) End Point Moving Average
lc_lsma(src, length)
1LC-LSMA (1 line code lsma with 3 functions)
Parameters:
src : (float) Source. Default: close
length : (int) Length
Returns: (float) 1LC-LSMA Moving Average
aarma(src, length)
Adaptive Autonomous Recursive Moving Average
Parameters:
src : (float) Source. Default: close
length : (int) Length
Returns: (float) Adaptive Autonomous Recursive Moving Average
alsma(src, length)
Adaptive Least Squares
Parameters:
src : (float) Source. Default: close
length : (int) Length
Returns: (float) Adaptive Least Squares
ahma(src, length)
Ahrens Moving Average
Parameters:
src : (float) Source. Default: close
length : (int) Length
Returns: (float) Ahrens Moving Average
adema(src)
Ahrens Moving Average
Parameters:
src : (float) Source. Default: close
Returns: (float) Moving Average
autol(src, lenDev)
Auto-Line
Parameters:
src : (float) Source. Default: close
lenDev : (int) Length for standard deviation
Returns: (float) Auto-Line
fibowma(src, length)
Fibonacci Weighted Moving Average
Parameters:
src : (float) Source. Default: close
length : (int) Length
Returns: (float) Moving Average
fisherlsma(src, length)
Fisher Least Squares Moving Average
Parameters:
src : (float) Source. Default: close
length : (int) Length
Returns: (float) Moving Average
leoma(src, length)
Leo Moving Average
Parameters:
src : (float) Source. Default: close
length : (int) Length
Returns: (float) Moving Average
linwma(src, period, weight)
Linear Weighted Moving Average
Parameters:
src : (float) Source. Default: close
period : (int) Length
weight : (int) Weight
Returns: (float) Moving Average
mcma(src, length)
McNicholl Moving Average
Parameters:
src : (float) Source. Default: close
length : (int) Length
Returns: (float) Moving Average
srwma(src, length)
Square Root Weighted Moving Average
Parameters:
src : (float) Source. Default: close
length : (int) Length
Returns: (float) Moving Average
EDSMA(src, len)
Ehlers Dynamic Smoothed Moving Average.
Parameters:
src : Series to use ('close' is used if no argument is supplied).
len : Lookback length to use.
Returns: EDSMA smoothing.
dema(x, t)
Double Exponential Moving Average.
Parameters:
x : Series to use ('close' is used if no argument is supplied).
t : Lookback length to use.
Returns: DEMA smoothing.
tema(src, len)
Triple Exponential Moving Average.
Parameters:
src : Series to use ('close' is used if no argument is supplied).
len : Lookback length to use.
Returns: TEMA smoothing.
smma(src, len)
Smoothed Moving Average.
Parameters:
src : Series to use ('close' is used if no argument is supplied).
len : Lookback length to use.
Returns: SMMA smoothing.
hullma(src, len)
Hull Moving Average.
Parameters:
src : Series to use ('close' is used if no argument is supplied).
len : Lookback length to use.
Returns: Hull smoothing.
frama(x, t)
Fractal Reactive Moving Average.
Parameters:
x : Series to use ('close' is used if no argument is supplied).
t : Lookback length to use.
Returns: FRAMA smoothing.
kama(x, t)
Kaufman's Adaptive Moving Average.
Parameters:
x : Series to use ('close' is used if no argument is supplied).
t : Lookback length to use.
Returns: KAMA smoothing.
vama(src, len)
Volatility Adjusted Moving Average.
Parameters:
src : Series to use ('close' is used if no argument is supplied).
len : Lookback length to use.
Returns: VAMA smoothing.
donchian(len)
Donchian Calculation.
Parameters:
len : Lookback length to use.
Returns: Average of the highest price and the lowest price for the specified look-back period.
Jurik(src, len)
Jurik Moving Average.
Parameters:
src : Series to use ('close' is used if no argument is supplied).
len : Lookback length to use.
Returns: JMA smoothing.
xema(src, len)
Optimized Exponential Moving Average.
Parameters:
src : Series to use ('close' is used if no argument is supplied).
len : Lookback length to use.
Returns: XEMA smoothing.
ehma(src, len)
EHMA - Exponential Hull Moving Average
Parameters:
src : Source
len : Period
Returns: Exponential Hull Moving Average (EHMA)
covwema(src, len)
Coefficient of Variation Weighted Exponential Moving Average (COVWEMA)
Parameters:
src : Source
len : Period
Returns: Coefficient of Variation Weighted Exponential Moving Average (COVWEMA)
covwma(src, len)
Coefficient of Variation Weighted Moving Average (COVWMA)
Parameters:
src : Source
len : Period
Returns: Coefficient of Variation Weighted Moving Average (COVWMA)
eframa(src, len, FC, SC)
Ehlrs Modified Fractal Adaptive Moving Average (EFRAMA)
Parameters:
src : Source
len : Period
FC : Lower Shift Limit for Ehlrs Modified Fractal Adaptive Moving Average
SC : Upper Shift Limit for Ehlrs Modified Fractal Adaptive Moving Average
Returns: Ehlrs Modified Fractal Adaptive Moving Average (EFRAMA)
etma(src, len)
Exponential Triangular Moving Average (ETMA)
Parameters:
src : Source
len : Period
Returns: Exponential Triangular Moving Average (ETMA)
rma(src, len)
RMA - RSI Moving average
Parameters:
src : Source
len : Period
Returns: RSI Moving average (RMA)
thma(src, len)
THMA - Triple Hull Moving Average
Parameters:
src : Source
len : Period
Returns: Triple Hull Moving Average (THMA)
vidya(src, len)
Variable Index Dynamic Average (VIDYA)
Parameters:
src : Source
len : Period
Returns: Variable Index Dynamic Average (VIDYA)
zsma(src, len)
Zero-Lag Simple Moving Average (ZSMA)
Parameters:
src : Source
len : Period
Returns: Zero-Lag Simple Moving Average (ZSMA)
zema(src, len)
Zero-Lag Exponential Moving Average (ZEMA)
Parameters:
src : Source
len : Period
Returns: Zero-Lag Exponential Moving Average (ZEMA)
evwma(src, len)
EVWMA - Elastic Volume Weighted Moving Average
Parameters:
src : Source
len : Period
Returns: Elastic Volume Weighted Moving Average (EVWMA)
tt3(src, len, a1_t3)
Tillson T3
Parameters:
src : Source
len : Period
a1_t3 : Tillson T3 Volume Factor
Returns: Tillson T3
gma(src, len)
GMA - Geometric Moving Average
Parameters:
src : Source
len : Period
Returns: Geometric Moving Average (GMA)
wwma(src, len)
WWMA - Welles Wilder Moving Average
Parameters:
src : Source
len : Period
Returns: Welles Wilder Moving Average (WWMA)
cma(src, len)
Corrective Moving average (CMA)
Parameters:
src : Source
len : Period
Returns: Corrective Moving average (CMA)
edma(src, len)
Exponentially Deviating Moving Average (MZ EDMA)
Parameters:
src : Source
len : Period
Returns: Exponentially Deviating Moving Average (MZ EDMA)
rema(src, len)
Range EMA (REMA)
Parameters:
src : Source
len : Period
Returns: Range EMA (REMA)
sw_ma(src, len)
Sine-Weighted Moving Average (SW-MA)
Parameters:
src : Source
len : Period
Returns: Sine-Weighted Moving Average (SW-MA)
mama(src, len)
MAMA - MESA Adaptive Moving Average
Parameters:
src : Source
len : Period
Returns: MESA Adaptive Moving Average (MAMA)
fama(src, len)
FAMA - Following Adaptive Moving Average
Parameters:
src : Source
len : Period
Returns: Following Adaptive Moving Average (FAMA)
hkama(src, len)
HKAMA - Hilbert based Kaufman's Adaptive Moving Average
Parameters:
src : Source
len : Period
Returns: Hilbert based Kaufman's Adaptive Moving Average (HKAMA)
getMovingAverage(type, src, len, lsmaOffset, inputAlmaOffset, inputAlmaSigma, FC, SC, a1_t3, fixedTfInput, daysInput, hoursInput, minsInput, minBarsInput, lambda, volumeWeighted, gamma_aarma, smooth, linweight, volatility_lookback, jurik_phase, jurik_power)
Abstract proxy function that invokes the calculation of a moving average according to type
Parameters:
type : (string) Type of moving average
src : (float) Source of series (close, high, low, etc.)
len : (int) Period of loopback to calculate the average
lsmaOffset : (int) Offset for Least Squares MA
inputAlmaOffset : (float) Offset for ALMA
inputAlmaSigma : (float) Sigma for ALMA
FC : (int) Lower Shift Limit for Ehlrs Modified Fractal Adaptive Moving Average
SC : (int) Upper Shift Limit for Ehlrs Modified Fractal Adaptive Moving Average
a1_t3 : (float) Tillson T3 Volume Factor
fixedTfInput : (bool) Use a fixed time period in Rolling VWAP
daysInput : (int) Days in Rolling VWAP
hoursInput : (int) Hours in Rolling VWAP
minsInput : (int) Minutrs in Rolling VWAP
minBarsInput : (int) Bars in Rolling VWAP
lambda : (float) Regularization Constant in Regularized EMA
volumeWeighted : (bool) Apply volume weighted calculation in selected moving average
gamma_aarma : (float) Gamma for Adaptive Autonomous Recursive Moving Average
smooth : (float) Smooth for Adaptive Least Squares
linweight : (float) Weight for Volume Weighted Moving Average
volatility_lookback : (int) Loopback for Volatility Adjusted Moving Average
jurik_phase : (int) Phase for Jurik Moving Average
jurik_power : (int) Power for Jurik Moving Average
Returns: (float) Moving average
L_BetaLibrary "L_Beta"
TODO: add library description here
length()
beta()
simple_beta()
index_selector()

Color Library: Rainbow Index & Simplest Return ColorLibrary "Color Library!"
To help with large projects that need colors!
If you guys make the library bigger, share it so we can all have tons of colors!
2 Functions
Uppercase and Lowercase, because why not?
import library as color
1.) color.this("Brown") // or color.this("brown") both work
2.) color.rainbow(1) //Returns first index of Rainbow
this(x)
TODO: color.this(Brown)
Parameters:
x : TODO: String Color Name
Returns: TODO: Color
rainbow(x)
TODO: Return Rainbow Index
Parameters:
x : TODO: Number is index of Rainbow :)
Returns: TODO: Color

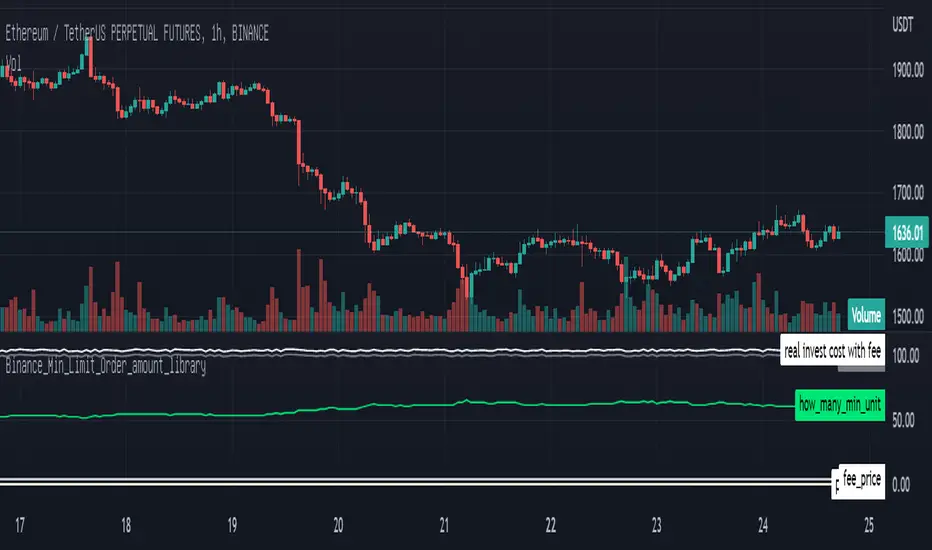
Binance_Min_Limit_Order_amount_libraryLibrary "Binance_Min_Limit_Order_amount_library"
TODO: This library give us the minimum Limit Order amount for the contract in Binance.
m_qty(n_v, m_fee, t_fee, cost, m_t)
TODO: it give us the Minimum Qty for the trading in Binance
Parameters:
n_v : TODO: min_notional_value. 5 dollar is the minimum notional amount in Binance at the moment.
m_fee : TODO: maker_fee %
t_fee : TODO: taker_fee %
cost : TODO: your investing money
m_t : TODO: if you want Limit_Order, put the "T", if you want Market_Order, put the "M" defval="M"
Returns: TODO: for the coin of binance on your chart,
Reference: www.binance.com
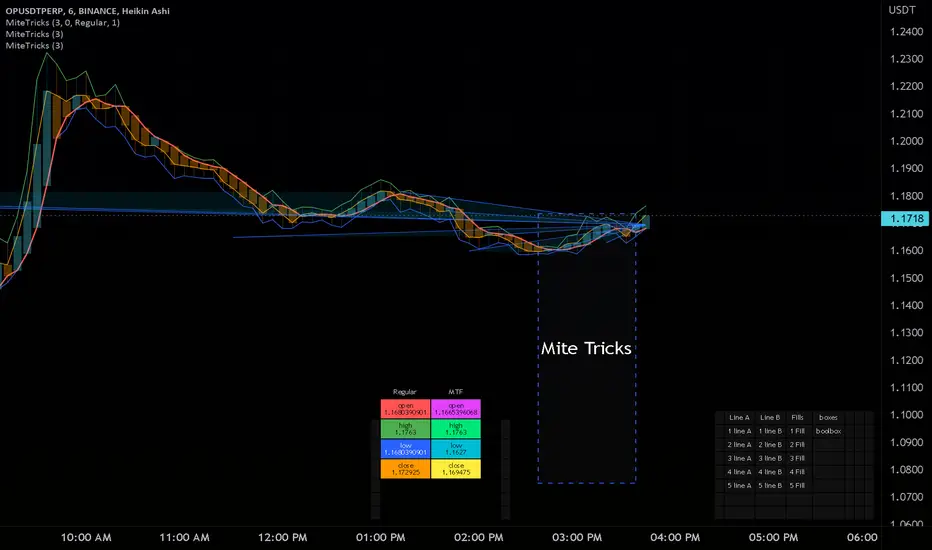
MiteTricksLibrary "MiteTricks"
Matrix Global Registry.
Get, Set, automatic growing, universal get/set,
multi-matrix dictionaries, multi-dictionary matrixes..
add slice matrixes of any type, share one common global key registry
pull up an item from a category, and item name ie a table of info.
same cell needs a color, a size, a string, a value, etc..
all of which can be pulled up with the same group id, and key id.
just swap which matrix you pull the value from.
this has a side benefit of non-repainting and recalculating
when pulling values, changing inputs..
makes for very fast/clean usage..
benefit :
floats = value
strings = names
lines = drawn items
table =table of data items for this key
colors = color for line/table/fill,label..
all of those can be pulled with "get(_VALUES,_groupIDX,_keyIDX)" where only the values matrix needs be swapped, and the same item/coordinates remains for all the possible matrixes that item appears in.
also useful as a dictionary/registry for any given type of item,,
and goes very handy with floats/strings/colors/bools with my matrixautotable
very helpful when prototyping or doing development work as a shortcut.
initRegistry()
Registry inititalizer
Returns: registry of string matrix type
newbool(optional, optional, optional)
create bool type new matrix presized 2x2 for reg
Parameters:
optional: row size
optional: column size
optional: fill value(default is bool (na)
Returns: bool matrix of specified size and fill, or blank 2x2 for registry use
newbox(optional, optional, optional)
create box type new matrix presized 2x2 for reg
Parameters:
optional: row size
optional: column size
optional: fill value(default is box (na)
Returns: box matrix of specified size and fill, or blank 2x2 for registry use
newcolor(optional, optional, optional)
create color type new matrix presized 2x2 for reg
Parameters:
optional: row size
optional: column size
optional: fill value(default is color (na)
Returns: color matrix of specified size and fill, or blank 2x2 for registry use
newfloat(optional, optional, optional)
create float type new matrix presized 2x2 for reg
Parameters:
optional: row size
optional: column size
optional: fill value(default is float (na)
Returns: float matrix of specified size and fill, or blank 2x2 for registry use
newint(optional, optional, optional)
create int type new matrix presized 2x2 for reg
Parameters:
optional: row size
optional: column size
optional: fill value(default is int (na)
Returns: int matrix of specified size and fill, or blank 2x2 for registry use
newlabel(optional, optional, optional)
create label type new matrix presized 2x2 for reg
Parameters:
optional: row size
optional: column size
optional: fill value(default is label (na)
Returns: label matrix of specified size and fill, or blank 2x2 for registry use
newline(optional, optional, optional)
create line type new matrix presized 2x2 for reg
Parameters:
optional: row size
optional: column size
optional: fill value(default is line (na)
Returns: line matrix of specified size and fill, or blank 2x2 for registry use
newlinefill(optional, optional, optional)
create linefill type new matrix presized 2x2 for reg
Parameters:
optional: row size
optional: column size
optional: fill value(default is linefill(na)
Returns: linefill matrix of specified size and fill, or blank 2x2 for registry use
newstring(optional, optional, optional)
create string type new matrix presized 2x2 for reg
Parameters:
optional: row size
optional: column size
optional: fill value(default is string (na)
Returns: string matrix of specified size and fill, or blank 2x2 for registry use
newtable(optional, optional, optional)
create table type new matrix presized 2x2 for reg
Parameters:
optional: row size
optional: column size
optional: fill value(default is table (na)
Returns: table matrix of specified size and fill, or blank 2x2 for registry use
newfrom(INIT_FILL)
newfrom Matrix full of item input
Parameters:
INIT_FILL: item to fill (2x2) the matri and set type. a type(na) works
addrow(m, v)
addrow Add new row to matrix
Parameters:
m: matrix of type being added to
v: value of type being added to ( best leave NA on string for registry purposes)
addcolumn(matrix, value)
addcolumn
Parameters:
matrix: of type being added to
value: of type being added to ( best leave NA on string for registry purposes)
get(_VALS, _KEYREG, _GROUP, _KEY)
get Grabs value and returns single item
Parameters:
_VALS: Matrix Values slice
_KEYREG: Registry values matrix (strings)
_GROUP: name of group/category or int group key
_KEY: name of item to fetch from value registry or int key id
Returns: item
get(_VALS, _GROUP, _KEY)
get Grabs value and returns single item
Parameters:
_VALS: Matrix Values slice
_GROUP: name of group/category
_KEY: name of item to fetch from value registry
getgid(_KEYREG, _GROUP)
getgid
Parameters:
_KEYREG: Reg to pull group id from
_GROUP: group index int, or string name to get the other missing type
getkid(_KEYREG, _GROUP, _KEY)
getkid
Parameters:
_KEYREG: Reg to pull Key id from
_GROUP: group index int, or string name
_KEY: index of string key id to get it's ID int
getkey(_KEYREG, _GROUP, _KEY)
getkey
Parameters:
_KEYREG: Reg to pull Key id from
_GROUP: group index int, or string name for getting key string
_KEY: index of string key id to get it's match of other type
set(_VALS, _KEYREG, _GROUP, _KEY, _value)
set items to reg and matrix container
Parameters:
_VALS: Values matrix container
_KEYREG: Key registry
_GROUP: (string) Group/Category name
_KEY: (string) Key for item
_value: item
Returns: void
del(_VALS, _KEYREG, _GROUP, _KEY)
del grroup id
Parameters:
_VALS: Matrix Values slice
_KEYREG: Registry values matrix (strings)
_GROUP: name of group/category
_KEY: name of item to Delete from values and key
detached(_GROUP, _KEY, _VALUE)
detached make detached registry/val matrix
Parameters:
_GROUP: Name of first group
_KEY: Name of first item
_VALUE: Item of any type, sets the output type too.
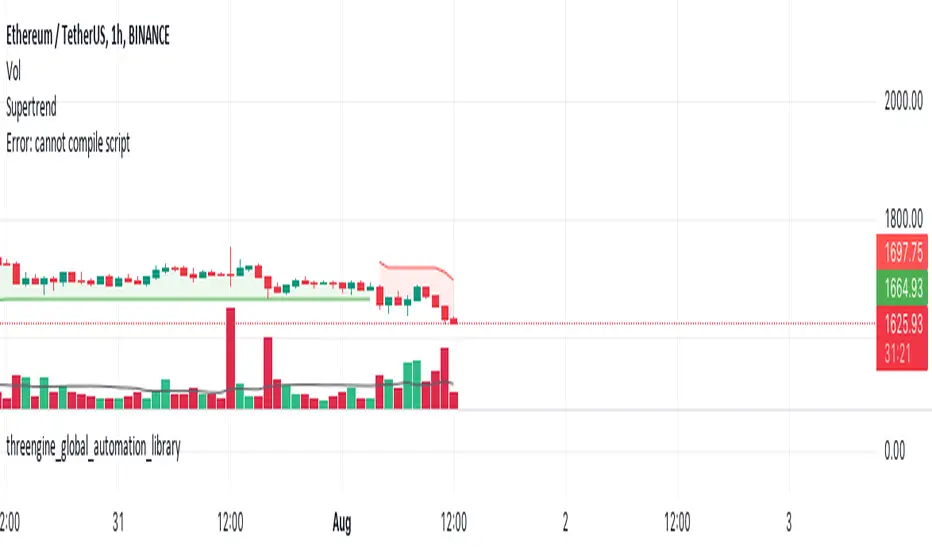
threengine_global_automation_libraryLibrary "threengine_global_automation_library"
A collection of functions used for trade automation
getBaseCurrency()
Gets the base currency for the chart's ticker. Supported trade pairs are USD, USDT, USDC, BTC, and PERP.
Returns: Base currency as a string
getChartSymbol()
Get the current chart's symbol without the base currency appended to it. Supported trade paris are USD, USDT, USDC, BTC, and PERP.
Returns: Ssymbol and base currency
getDecimals()
Calculates how many decimals are on the quote price of the current market
Returns: The current deimal places on the market quote price
checkVar()
Plot a string as a label on the chart to test variable value. Use str.tostring() for any variable that isn't a string.
Returns: Label with stringified variable
getStrategyAlertMessage()
Generates stringified JSON for a limit order that can be passed to the strategy alert_message for a long entry.
Returns: Stringifed JSON for a long entry
taGetAdx()
Calculates the Average Directional Index
Returns: The value of ADX as a float
taGetEma()
Calculates the EMA based on a type, source, and length. Supported types are EMA, SMA, RMA, and WMA.
Returns: The value of the selected EMA
isBetweenTwoTimes()
Checks to see if within a rage based on two times
@retunrs true/false boolean
getAllTradeIDs()
This gets all closed trades and open trades
@retunrs an array of all open and closed trade ID's
getOpenTradeIDs()
This gets all open trades
@retunrs an array of all open trade ID's
orderAlreadyExists()
This checks to see if a provided order id uses the getAllTradeIDs() function to check
@retunrs an array of all open and closed trade ID's
orderCurrentlyExists()
This checks to see if a provided order id uses the getAllTradeIDs() function to check
Returns: an array of all open and closed trade ID's
getContractCount()
calulates the number of contracts you can buy with a set amount of capital and a limit price
Returns: number of contracts you can buy based on amount of capital you want to use and a price
getLadderSteps()
Returns: array of ladder entry prices and amounts based on total amount you want to invest across all ladder rungs and either a range between ladderStart and LadderStop based on specificed number of ladderRungs OR ladderStart, ladderRungs, and LadderSpacingPercent
"Swap" - Bool/Position/Value : Array / Matrix / Var AutoswapLibrary "swap"
Side / Boundary Based All Types Swapper
- three automagical types for Arrays, Matrixes, and Variables
-- no signal : Long/ Short position autoswap
-- true / false : Boolean based side choice
-- Src / Thresh : if source is above or below the threshold
- two operating modes for variables, Holding mode only for arrays/matrixes
-- with two items, will automatically change between the two caveat is it does not delete table/box/line(fill VAR items automatically)
-- with three items, a neutral is available for NA input or neutral
- one function name for all of them. One import name that's easy to type/remember
-- make life easy for your conditional items.
side(source, thresh, _a, _b, _c)
side Change outputs based on position or a crossing level
Parameters:
source : (float) OPTIONAL value input
thresh : (float) OPTIONAL boundary line to cross
_a : (any) if Long/True/Above
_b : (any) if Short/False/Below
_c : (any) OPTIONAL NOT FOR MTX OR ARR... Neutral Item, if var/varip on a/b it will leave behind, ie, a table or box or line will not erase , if it's a varip you're sending in.
Returns: first, second, or third items based on input conditions
Please notify if bugs found.
Thanks.

fontilabLibrary "fontilab"
Provides function's indicators for pivot - trend - resistance.
pivots(src, lenght, isHigh) Detecting pivot points (and returning price + bar index.
Parameters:
src : The chart we analyse.
lenght : Used for the calcul.
isHigh : lookging for high if true, low otherwise.
Returns: The bar index and the price of the pivot.
calcDevThreshold(tresholdMultiplier, closePrice) Calculate deviation threshold for identifying major swings.
Parameters:
tresholdMultiplier : Usefull to equilibrate the calculate.
closePrice : Close price of the chart wanted.
Returns: The deviation threshold.
calcDev(basePrice, price) Custom function for calculating price deviation for validating large moves.
Parameters:
basePrice : The reference price.
price : The price tested.
Returns: The deviation.
pivotFoundWithLines(dev, isHigh, index, price, dev_threshold, isHighLast, pLast, iLast, lineLast) Detecting pivots that meet our deviation criteria.
Parameters:
dev : The deviation wanted.
isHigh : The type of pivot tested (high or low).
index : The Index of the pivot tested.
price : The chart price wanted.
dev_threshold : The deviation treshold.
isHighLast : The type of last pivot.
pLast : The pivot price last.
iLast : Index of the last pivot.
lineLast : The lst line.
Returns: The Line and bool is pivot High.
getDeviationPivots(thresholdMultiplier, depth, lineLast, isHighLast, iLast, pLast, deleteLines, closePrice, highPrice, lowPrice) Get pivot that meet our deviation criteria.
Parameters:
thresholdMultiplier : The treshold multiplier.
depth : The depth to calculate pivot.
lineLast : The last line.
isHighLast : The type of last pivot
iLast : Index of the last pivot.
pLast : The pivot price last.
deleteLines : If the line are draw or not.
closePrice : The chart close price.
highPrice : The chart high price.
lowPrice : The chart low price.
Returns: All pivot the informations.
getElIntArrayFromEnd() Get the last element of an int array.
getElFloatArrayFromEnd() Get the last element of an float array.
getElBoolArrayFromEnd() Get the last element of a bool array.
isTrendContinuation(isTrendUp, arrayBounds, lastPrice, precision) Check if last price is between bounds array.
Parameters:
isTrendUp : Is actual trend up.
arrayBounds : The trend array.
lastPrice : The pivot Price that just be found.
precision : The percent we add to actual bounds to validate a move.
Returns: na if price is between bounds, true if continuation, false if not.
getTrendPivots(trendBarIndexes, trendPrices, trendPricesIsHigh, interBarIndexes, interPrices, interPricesIsHigh, isTrendHesitate, isTrendUp, trendPrecision, pLast, iLast, isHighLast) Function to update array and trend related to pivot trend interpretation.
Parameters:
trendBarIndexes : The array trend bar index.
trendPrices : The array trend price.
trendPricesIsHigh : The array trend is high.
interBarIndexes : The array inter bar index.
interPrices : The array inter price.
interPricesIsHigh : The array inter ishigh.
isTrendHesitate : The actual status of is trend hesitate.
isTrendUp : The actual status of is trend up.
trendPrecision : The var precision to add in "iscontinuation" function.
pLast : The last pivot price.
iLast : The last pivot bar index.
isHighLast : The last pivot "isHigh".
Returns: trend & inter arrays, is trend hesitate, is trend up.
drawBoundLines(startIndex, startPrice, endIndex, endPrice, breakingPivotIndex, breakingPivotPrice, isTrendUp) Draw bounds and breaking line of the trend.
Parameters:
startIndex : Index of the first bound line.
startPrice : Price of first bound line.
endIndex : Index of second bound line.
endPrice : price of second bound line.
breakingPivotIndex : The breaking line index.
breakingPivotPrice : The breaking line price.
isTrendUp : The actual status of the trend.
Returns: The lines bounds and breaking line.

merge_pinbarLibrary "merge_pinbar"
merge_pinbar: merge bars and check whether the bar is a pinbar
merge_pinbar(simple, simple) merge_pinbar: merge bars and check whether the bar is a pinbar
Parameters:
simple : int period: the statistic bar period
simple : int max_bars: the max bars to be merged
Returns: array:

Timed_exit_alert_for_webhookLibrary "Timed_exit_alert_for_webhook"
TODO: add library description here
fun(x) TODO: add function description here
Parameters:
x : TODO: add parameter x description here
Returns: TODO: add what function returns
for exiting FCM like Tradovate and AMP using API and python MT5 and Webhooks
the writer take no responsibility for trades made using this script its written for informational purposes only
adx: Configurable ADX (library) Library "adx"
Calculate ADX (and its constituent parts +DI, -DI, ATR),
using different moving averages and periods.
adx(atrMA, diMA, adxMA, atrLen, diLen, adxLen, h, l, c)
Parameters:
atrMA : Moving Average used for calculating the Average True Range.
Traditionally RMA, but using SMA here and in adxMA gives good results too.
diMA : Moving Average used for calculating the Directional Index.
Traditionally, RMA.
adxMA : Moving Average used for calculating the Average Directional
Index. Traditionally RMA, but using SMA here and in atrMA gives good results
too.
atrLen : Length of the Average True Range.
diLen : Length of the Directional Index.
adxLen : Length (smoothing) of the Average Directional Index.
h : Candle's high.
l : Candle's low.
c : Candle's close.
Returns:

statisticsLibrary "statistics"
General statistics library.
erf(x) The "error function" encountered in integrating the normal
distribution (which is a normalized form of the Gaussian function).
Parameters:
x : The input series.
Returns: The Error Function evaluated for each element of x.
erfc(x)
Parameters:
x : The input series
Returns: The Complementary Error Function evaluated for each alement of x.
sumOfReciprocals(src, len) Calculates the sum of the reciprocals of the series.
For each element 'elem' in the series:
sum += 1/elem
Should the element be 0, the reciprocal value of 0 is used instead
of NA.
Parameters:
src : The input series.
len : The length for the sum.
Returns: The sum of the resciprocals of 'src' for 'len' bars back.
mean(src, len) The mean of the series.
(wrapper around ta.sma).
Parameters:
src : The input series.
len : The length for the mean.
Returns: The mean of 'src' for 'len' bars back.
average(src, len) The mean of the series.
(wrapper around ta.sma).
Parameters:
src : The input series.
len : The length for the average.
Returns: The average of 'src' for 'len' bars back.
geometricMean(src, len) The Geometric Mean of the series.
The geometric mean is most important when using data representing
percentages, ratios, or rates of change. It cannot be used for
negative numbers
Since the pure mathematical implementation generates a very large
intermediate result, we performed the calculation in log space.
Parameters:
src : The input series.
len : The length for the geometricMean.
Returns: The geometric mean of 'src' for 'len' bars back.
harmonicMean(src, len) The Harmonic Mean of the series.
The harmonic mean is most applicable to time changes and, along
with the geometric mean, has been used in economics for price
analysis. It is more difficult to calculate; therefore, it is less
popular than eiter of the other averages.
0 values are ignored in the calculation.
Parameters:
src : The input series.
len : The length for the harmonicMean.
Returns: The harmonic mean of 'src' for 'len' bars back.
median(src, len) The median of the series.
(a wrapper around ta.median)
Parameters:
src : The input series.
len : The length for the median.
Returns: The median of 'src' for 'len' bars back.
variance(src, len, biased) The variance of the series.
Parameters:
src : The input series.
len : The length for the variance.
biased : Wether to use the biased calculation (for a population), or the
unbiased calculation (for a sample set). .
Returns: The variance of 'src' for 'len' bars back.
stdev(src, len, biased) The standard deviation of the series.
Parameters:
src : The input series.
len : The length for the stdev.
biased : Wether to use the biased calculation (for a population), or the
unbiased calculation (for a sample set). .
Returns: The standard deviation of 'src' for 'len' bars back.
skewness(src, len) The skew of the series.
Skewness measures the amount of distortion from a symmetric
distribution, making the curve appear to be short on the left
(lower prices) and extended to the right (higher prices). The
extended side, either left or right is called the tail, and a
longer tail to the right is called positive skewness. Negative
skewness has the tail extending towards the left.
Parameters:
src : The input series.
len : The length for the skewness.
Returns: The skewness of 'src' for 'len' bars back.
kurtosis(src, len) The kurtosis of the series.
Kurtosis describes the peakedness or flatness of a distribution.
This can be used as an unbiased assessment of whether prices are
trending or moving sideways. Trending prices will ocver a wider
range and thus a flatter distribution (kurtosis < 3; negative
kurtosis). If prices are range-bound, there will be a clustering
around the mean and we have positive kurtosis (kurtosis > 3)
Parameters:
src : The input series.
len : The length for the kurtosis.
Returns: The kurtosis of 'src' for 'len' bars back.
excessKurtosis(src, len) The normalized kurtosis of the series.
kurtosis > 0 --> positive kurtosis --> trending
kurtosis < 0 --> negative krutosis --> range-bound
Parameters:
src : The input series.
len : The length for the excessKurtosis.
Returns: The excessKurtosis of 'src' for 'len' bars back.
normDist(src, len, value) Calculates the probability mass for the value according to the
src and length. It calculates the probability for value to be
present in the normal distribution calculated for src and length.
Parameters:
src : The input series.
len : The length for the normDist.
value : The series of values to calculate the normal distance for
Returns: The normal distance of 'value' to 'src' for 'len' bars back.
normDistCumulative(src, len, value) Calculates the cumulative probability mass for the value according
to the src and length. It calculates the cumulative probability for
value to be present in the normal distribution calculated for src
and length.
Parameters:
src : The input series.
len : The length for the normDistCumulative.
value : The series of values to calculate the cumulative normal distance
for
Returns: The cumulative normal distance of 'value' to 'src' for 'len' bars
back.
zScore(src, len, value) Returns then z-score of objective to the series src.
It returns the number of stdev's the objective is away from the
mean(src, len)
Parameters:
src : The input series.
len : The length for the zScore.
value : The series of values to calculate the cumulative normal distance
for
Returns: The z-score of objectiv with respect to src and len.
er(src, len) Calculates the efficiency ratio of the series.
It measures the noise of the series. The lower the number, the
higher the noise.
Parameters:
src : The input series.
len : The length for the efficiency ratio.
Returns: The efficiency ratio of 'src' for 'len' bars back.
efficiencyRatio(src, len) Calculates the efficiency ratio of the series.
It measures the noise of the series. The lower the number, the
higher the noise.
Parameters:
src : The input series.
len : The length for the efficiency ratio.
Returns: The efficiency ratio of 'src' for 'len' bars back.
fractalEfficiency(src, len) Calculates the efficiency ratio of the series.
It measures the noise of the series. The lower the number, the
higher the noise.
Parameters:
src : The input series.
len : The length for the efficiency ratio.
Returns: The efficiency ratio of 'src' for 'len' bars back.
mse(src, len) Calculates the Mean Squared Error of the series.
Parameters:
src : The input series.
len : The length for the mean squared error.
Returns: The mean squared error of 'src' for 'len' bars back.
meanSquaredError(src, len) Calculates the Mean Squared Error of the series.
Parameters:
src : The input series.
len : The length for the mean squared error.
Returns: The mean squared error of 'src' for 'len' bars back.
rmse(src, len) Calculates the Root Mean Squared Error of the series.
Parameters:
src : The input series.
len : The length for the root mean squared error.
Returns: The root mean squared error of 'src' for 'len' bars back.
rootMeanSquaredError(src, len) Calculates the Root Mean Squared Error of the series.
Parameters:
src : The input series.
len : The length for the root mean squared error.
Returns: The root mean squared error of 'src' for 'len' bars back.
mae(src, len) Calculates the Mean Absolute Error of the series.
Parameters:
src : The input series.
len : The length for the mean absolute error.
Returns: The mean absolute error of 'src' for 'len' bars back.
meanAbsoluteError(src, len) Calculates the Mean Absolute Error of the series.
Parameters:
src : The input series.
len : The length for the mean absolute error.
Returns: The mean absolute error of 'src' for 'len' bars back.

CRCHud - HUD Library (Heads Up Display)Library "CRCHud"
Library of functions which will contain functions that allow reusable HUD (Heads up Display) components to used from within other scripts
add_cell_change() - Adds a new cell to designated table which displays the data source value, the line color, data title, and automatically calculated %percent change stats based on lookback value supplied (default - previous bar)

Punchline_LibLibrary "Punchline_Lib"
roundSmart(float) Truncates decimal points of a float value based on the amount of digits before the decimal point
Parameters:
float : _value any number
Returns: float
tostring_smart(float) converts a float to a string, intelligently cutting off decimal points
Parameters:
float : _value any number
Returns: string

The Divergent LibraryLibrary "TheDivergentLibrary"
The Divergent Library is only useful when combined with the Pro version of The Divergent - Advanced divergence indicator . This is because the Basic (free) version of The Divergent does not expose the "Divergence Signal" value.
Usage instructions:
1. Create a new chart
2. Add The Divergent (Pro) indicator to your chart
3. Create a new strategy, import this library, add a "source" input, link it to "The Divergent: Divergence Signal", and use the library to decode the divergence signals from The Divergent (You can find example strategy code published in our profile)
4. Act on the divergences signalled by The Divergent
---
isRegularBullishEnabled(context) Returns a boolean value indicating whether Regular Bullish divergence detection is enabled in The Divergent.
Parameters:
context : The context of The Divergent Library.
Returns: A boolean value indicating whether Regular Bullish divergence detection is enabled in The Divergent.
isHiddenBullishEnabled(context) Returns a boolean value indicating whether Hidden Bullish divergence detection is enabled in The Divergent.
Parameters:
context : The context of The Divergent Library.
Returns: A boolean value indicating whether Hidden Bullish divergence detection is enabled in The Divergent.
isRegularBearishEnabled(context) Returns a boolean value indicating whether Regular Bearish divergence detection is enabled in The Divergent.
Parameters:
context : The context of The Divergent Library.
Returns: A boolean value indicating whether Regular Bearish divergence detection is enabled in The Divergent.
isHiddenBearishEnabled(context) Returns a boolean value indicating whether Hidden Bearish divergence detection is enabled in The Divergent.
Parameters:
context : The context of The Divergent Library.
Returns: A boolean value indicating whether Hidden Bearish divergence detection is enabled in The Divergent.
getPivotDetectionSource(context) Returns the 'Pivot Detection Source' setting of The Divergent. The returned value can be either "Oscillator" or "Price".
Parameters:
context : The context of The Divergent Library.
Returns: One of the following string values: "Oscillator" or "Price".
getPivotDetectionMode(context) Returns the 'Pivot Detection Mode' setting of The Divergent. The returned value can be either "Bodies" or "Wicks".
Parameters:
context : The context of The Divergent Library.
Returns: One of the following string values: "Bodies" or "Wicks".
isLinked(context) Returns a boolean value indicating the link status to The Divergent indicator.
Parameters:
context : The context of The Divergent Library.
Returns: A boolean value indicating the link status to The Divergent indicator.
init(firstBarSignal, displayLinkStatus, debug) Initialises The Divergent Library's context with the signal produced by The Divergent on the first bar. The value returned from this function is called the "context of The Divergent Library". Some of the other functions of this library requires you to pass in this context.
Parameters:
firstBarSignal : The signal from The Divergent indicator on the first bar.
displayLinkStatus : A boolean value indicating whether the Link Status window should be displayed in the bottom left corner of the chart. Defaults to true.
debug : A boolean value indicating whether the Link Status window should display debug information. Defaults to false.
Returns: A bool array containing the context of The Divergent Library.
processSignal(signal) Processes a signal from The Divergent and returns a 5-tuple with the decoded signal: [ int divergenceType, int priceBarIndexStart, int priceBarIndexEnd, int oscillatorBarIndexStart, int oscillatorBarIndexEnd]. `divergenceType` can be one of the following values: na → No divergence was detected, 1 → Regular Bullish, 2 → Regular Bullish early, 3 → Hidden Bullish, 4 → Hidden Bullish early, 5 → Regular Bearish, 6 → Regular Bearish early, 7 → Hidden Bearish, 8 → Hidden Bearish early.
Parameters:
signal : The signal from The Divergent indicator.
Returns: A 5-tuple with the following values: [ int divergenceType, int priceBarIndexStart, int priceBarIndexEnd, int oscillatorBarIndexStart, int oscillatorBarIndexEnd].

lib_Indicators_v2_DTULibrary "lib_Indicators_v2_DTU"
This library functions returns included Moving averages, indicators with factorization, functions candles, function heikinashi and more.
Created it to feed as backend of my indicator/strategy "Indicators & Combinations Framework Advanced v2 " that will be released ASAP.
This is replacement of my previous indicator (lib_indicators_DT)
I will add an indicator example which will use this indicator named as "lib_indicators_v2_DTU example" to help the usage of this library
Additionally library will be updated with more indicators in the future
NOTES:
Indicator functions returns only one series :-(
plotcandle function returns candle series
INDICATOR LIST:
hide = 'DONT DISPLAY', //Dont display & calculate the indicator. (For my framework usage)
alma = 'alma(src,len,offset=0.85,sigma=6)', //Arnaud Legoux Moving Average
ama = 'ama(src,len,fast=14,slow=100)', //Adjusted Moving Average
acdst = 'accdist()', //Accumulation/distribution index.
cma = 'cma(src,len)', //Corrective Moving average
dema = 'dema(src,len)', //Double EMA (Same as EMA with 2 factor)
ema = 'ema(src,len)', //Exponential Moving Average
gmma = 'gmma(src,len)', //Geometric Mean Moving Average
hghst = 'highest(src,len)', //Highest value for a given number of bars back.
hl2ma = 'hl2ma(src,len)', //higest lowest moving average
hma = 'hma(src,len)', //Hull Moving Average.
lgAdt = 'lagAdapt(src,len,perclen=5,fperc=50)', //Ehler's Adaptive Laguerre filter
lgAdV = 'lagAdaptV(src,len,perclen=5,fperc=50)', //Ehler's Adaptive Laguerre filter variation
lguer = 'laguerre(src,len)', //Ehler's Laguerre filter
lsrcp = 'lesrcp(src,len)', //lowest exponential esrcpanding moving line
lexp = 'lexp(src,len)', //lowest exponential expanding moving line
linrg = 'linreg(src,len,loffset=1)', //Linear regression
lowst = 'lowest(src,len)', //Lovest value for a given number of bars back.
pcnl = 'percntl(src,len)', //percentile nearest rank. Calculates percentile using method of Nearest Rank.
pcnli = 'percntli(src,len)', //percentile linear interpolation. Calculates percentile using method of linear interpolation between the two nearest ranks.
rema = 'rema(src,len)', //Range EMA (REMA)
rma = 'rma(src,len)', //Moving average used in RSI. It is the exponentially weighted moving average with alpha = 1 / length.
sma = 'sma(src,len)', //Smoothed Moving Average
smma = 'smma(src,len)', //Smoothed Moving Average
supr2 = 'super2(src,len)', //Ehler's super smoother, 2 pole
supr3 = 'super3(src,len)', //Ehler's super smoother, 3 pole
strnd = 'supertrend(src,len,period=3)', //Supertrend indicator
swma = 'swma(src,len)', //Sine-Weighted Moving Average
tema = 'tema(src,len)', //Triple EMA (Same as EMA with 3 factor)
tma = 'tma(src,len)', //Triangular Moving Average
vida = 'vida(src,len)', //Variable Index Dynamic Average
vwma = 'vwma(src,len)', //Volume Weigted Moving Average
wma = 'wma(src,len)', //Weigted Moving Average
angle = 'angle(src,len)', //angle of the series (Use its Input as another indicator output)
atr = 'atr(src,len)', //average true range. RMA of true range.
bbr = 'bbr(src,len,mult=1)', //bollinger %%
bbw = 'bbw(src,len,mult=2)', //Bollinger Bands Width. The Bollinger Band Width is the difference between the upper and the lower Bollinger Bands divided by the middle band.
cci = 'cci(src,len)', //commodity channel index
cctbb = 'cctbbo(src,len)', //CCT Bollinger Band Oscilator
chng = 'change(src,len)', //Difference between current value and previous, source - source .
cmo = 'cmo(src,len)', //Chande Momentum Oscillator. Calculates the difference between the sum of recent gains and the sum of recent losses and then divides the result by the sum of all price movement over the same period.
cog = 'cog(src,len)', //The cog (center of gravity) is an indicator based on statistics and the Fibonacci golden ratio.
cpcrv = 'copcurve(src,len)', //Coppock Curve. was originally developed by Edwin "Sedge" Coppock (Barron's Magazine, October 1962).
corrl = 'correl(src,len)', //Correlation coefficient. Describes the degree to which two series tend to deviate from their ta.sma values.
count = 'count(src,len)', //green avg - red avg
dev = 'dev(src,len)', //ta.dev() Measure of difference between the series and it's ta.sma
fall = 'falling(src,len)', //ta.falling() Test if the `source` series is now falling for `length` bars long. (Use its Input as another indicator output)
kcr = 'kcr(src,len,mult=2)', //Keltner Channels Range
kcw = 'kcw(src,len,mult=2)', //ta.kcw(). Keltner Channels Width. The Keltner Channels Width is the difference between the upper and the lower Keltner Channels divided by the middle channel.
macd = 'macd(src,len)', //macd
mfi = 'mfi(src,len)', //Money Flow Index
nvi = 'nvi()', //Negative Volume Index
obv = 'obv()', //On Balance Volume
pvi = 'pvi()', //Positive Volume Index
pvt = 'pvt()', //Price Volume Trend
rise = 'rising(src,len)', //ta.rising() Test if the `source` series is now rising for `length` bars long. (Use its Input as another indicator output)
roc = 'roc(src,len)', //Rate of Change
rsi = 'rsi(src,len)', //Relative strength Index
smosc = 'smi_osc(src,len,fast=5, slow=34)', //smi Oscillator
smsig = 'smi_sig(src,len,fast=5, slow=34)', //smi Signal
stdev = 'stdev(src,len)', //Standart deviation
trix = 'trix(src,len)' , //the rate of change of a triple exponentially smoothed moving average.
tsi = 'tsi(src,len)', //True Strength Index
vari = 'variance(src,len)', //ta.variance(). Variance is the expectation of the squared deviation of a series from its mean (ta.sma), and it informally measures how far a set of numbers are spread out from their mean.
wilpc = 'willprc(src,len)', //Williams %R
wad = 'wad()', //Williams Accumulation/Distribution.
wvad = 'wvad()' //Williams Variable Accumulation/Distribution.
}
f_func(string, float, simple, float, float, float, simple) f_func Return selected indicator value with different parameters. New version. Use extra parameters for available indicators
Parameters:
string : FuncType_ indicator from the indicator list
float : src_ close, open, high, low,hl2, hlc3, ohlc4 or any
simple : int length_ indicator length
float : p1 extra parameter-1. active on Version 2 for defining multi arguments indicator input value. ex: lagAdapt(src_, length_,LAPercLen_=p1,FPerc_=p2)
float : p2 extra parameter-2. active on Version 2 for defining multi arguments indicator input value. ex: lagAdapt(src_, length_,LAPercLen_=p1,FPerc_=p2)
float : p3 extra parameter-3. active on Version 2 for defining multi arguments indicator input value. ex: lagAdapt(src_, length_,LAPercLen_=p1,FPerc_=p2)
simple : int version_ indicator version for backward compatibility. V1:dont use extra parameters p1,p2,p3 and use default values. V2: use extra parameters for available indicators
Returns: float Return calculated indicator value
fn_heikin(float, float, float, float) fn_heikin Return given src data (open, high,low,close) as heikin ashi candle values
Parameters:
float : o_ open value
float : h_ high value
float : l_ low value
float : c_ close value
Returns: float heikin ashi open, high,low,close vlues that will be used with plotcandle
fn_plotFunction(float, string, simple, bool) fn_plotFunction Return input src data with different plotting options
Parameters:
float : src_ indicator src_data or any other series.....
string : plotingType Ploting type of the function on the screen
simple : int stochlen_ length for plotingType for stochastic and PercentRank options
bool : plotSWMA Use SWMA for smoothing Ploting
Returns: float
fn_funcPlotV2(string, float, simple, float, float, float, simple, string, simple, bool, bool) fn_funcPlotV2 Return selected indicator value with different parameters. New version. Use extra parameters fora available indicators
Parameters:
string : FuncType_ indicator from the indicator list
float : src_data_ close, open, high, low,hl2, hlc3, ohlc4 or any
simple : int length_ indicator length
float : p1 extra parameter-1. active on Version 2 for defining multi arguments indicator input value. ex: lagAdapt(src_, length_,LAPercLen_=p1,FPerc_=p2)
float : p2 extra parameter-2. active on Version 2 for defining multi arguments indicator input value. ex: lagAdapt(src_, length_,LAPercLen_=p1,FPerc_=p2)
float : p3 extra parameter-3. active on Version 2 for defining multi arguments indicator input value. ex: lagAdapt(src_, length_,LAPercLen_=p1,FPerc_=p2)
simple : int version_ indicator version for backward compatibility. V1:dont use extra parameters p1,p2,p3 and use default values. V2: use extra parameters for available indicators
string : plotingType Ploting type of the function on the screen
simple : int stochlen_ length for plotingType for stochastic and PercentRank options
bool : plotSWMA Use SWMA for smoothing Ploting
bool : log_ Use log on function entries
Returns: float Return calculated indicator value
fn_factor(string, float, simple, float, float, float, simple, simple, string, simple, bool, bool) fn_factor Return selected indicator's factorization with given arguments
Parameters:
string : FuncType_ indicator from the indicator list
float : src_data_ close, open, high, low,hl2, hlc3, ohlc4 or any
simple : int length_ indicator length
float : p1 parameter-1. active on Version 2 for defining multi arguments indicator input value. ex: lagAdapt(src_, length_,LAPercLen_=p1,FPerc_=p2)
float : p2 parameter-2. active on Version 2 for defining multi arguments indicator input value. ex: lagAdapt(src_, length_,LAPercLen_=p1,FPerc_=p2)
float : p3 parameter-3. active on Version 2 for defining multi arguments indicator input value. ex: lagAdapt(src_, length_,LAPercLen_=p1,FPerc_=p2)
simple : int version_ indicator version for backward compatibility. V1:dont use extra parameters p1,p2,p3 and use default values. V2: use extra parameters for available indicators
simple : int fact_ Add double triple, Quatr factor to selected indicator (like converting EMA to 2-DEMA, 3-TEMA, 4-QEMA...)
string : plotingType Ploting type of the function on the screen
simple : int stochlen_ length for plotingType for stochastic and PercentRank options
bool : plotSWMA Use SWMA for smoothing Ploting
bool : log_ Use log on function entries
Returns: float Return result of the function
fn_plotCandles(string, simple, float, float, float, simple, string, simple, bool, bool, bool) fn_plotCandles Return selected indicator's candle values with different parameters also heikinashi is available
Parameters:
string : FuncType_ indicator from the indicator list
simple : int length_ indicator length
float : p1 parameter-1. active on Version 2 for defining multi arguments indicator input value. ex: lagAdapt(src_, length_,LAPercLen_=p1,FPerc_=p2)
float : p2 parameter-2. active on Version 2 for defining multi arguments indicator input value. ex: lagAdapt(src_, length_,LAPercLen_=p1,FPerc_=p2)
float : p3 parameter-3. active on Version 2 for defining multi arguments indicator input value. ex: lagAdapt(src_, length_,LAPercLen_=p1,FPerc_=p2)
simple : int version_ indicator version for backward compatibility. V1:dont use extra parameters p1,p2,p3 and use default values. V2: use extra parameters for available indicators
string : plotingType Ploting type of the function on the screen
simple : int stochlen_ length for plotingType for stochastic and PercentRank options
bool : plotSWMA Use SWMA for smoothing Ploting
bool : log_ Use log on function entries
bool : plotheikin_ Use Heikin Ashi on Plot
Returns: float

FunctionZigZagMultipleMethodsLibrary "FunctionZigZagMultipleMethods"
ZigZag Multiple Methods.
method(idx) Helper methods enumeration.
Parameters:
idx : int, index of method, range 0 to 4.
Returns: string
function(method, value_x, value_y) Multiple method ZigZag.
Parameters:
method : string, default='(MANUAL) Percent price move over X * Y', method for zigzag.
value_x : float, x value in method.
value_y : float, y value in method.
Returns: tuple with:
zigzag float
direction
reverse_line float
realtimeofpivot int

GenericTradingLibrary "GenericTrading"
This library aims to collect rare but useful operations for
get_most_recent_long_or_short_position_closed_index() : returns most recent long/short closed bar index.
get_most_recent_long_or_short_position_open_index() : returns most recent long/short closed bar index.
These two functions designed to help to speed up the coding for strategies that contains "re-enter" logic.
These two functions also could applies in the situations where time-count is needed in your condition.