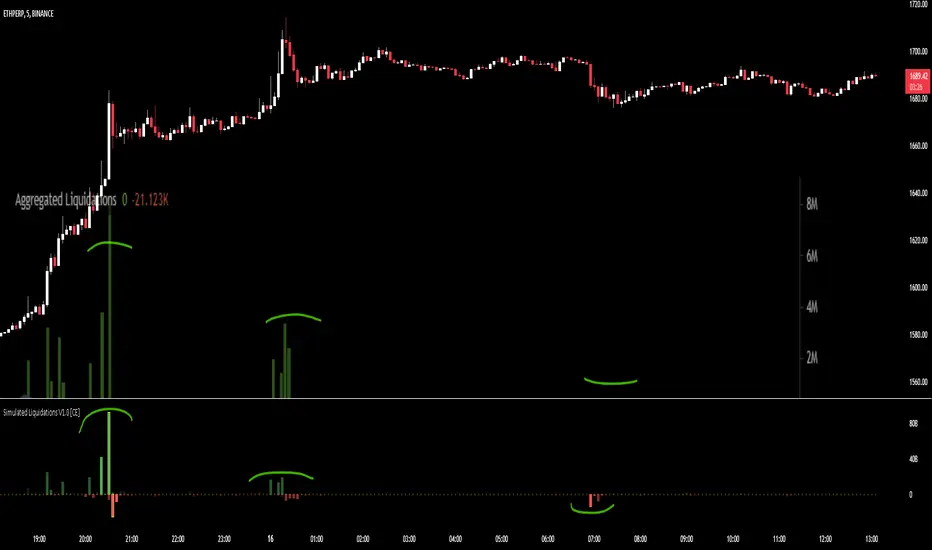
Liquidation Candles V1.0 [CE]Liquidation Candles V1.0 is a custom calculation done on crypto symbols to bring liquidation data that is not available directly,
using a denomination of time/oi/ volume /location the indicator aims to highlight the areas of liquidation relative to the candle structure to give optimal entry / exits for user positions
Using the indicator can be useful to determine where the liquidations are occurring to allow for optimal entries and exits based on Realtime chart updates,
The indicator will highlight this importance using 2 separate weightings.
Both Transparency of the zones to highlight how many liquidations are occurring,
and the Shape to show significance.
The indicator can be customized to show only certain thresholds, example of just the largest liquidations "giga" liqs:
TO DO
Custom Alerts Price Specific
Custom Thresholds
Custom price specific alerts can be more in depth than its Simulated Liquidations pair. This can be highlighting Large liquidations that occur specifically in the tail wick of a candle as opposed to the body.
Liquidation

Simulated Liquidations V1.0 [CE]Simulated Liquidations is an custom calculation done on crypto symbols to bring liquidation data that is not available directly,
using a denomination of time/oi/volume/location the indicator aims to calculate accurately shaped zones for where liquidations are occurring.
Using the indicator can be useful to determine where moves may continue e.g. short side liquidations leading to short covering increasing the buying pressure.
In areas where traders may see buying demand + short covering this can lead to a "squeeze" and continued upward momentum.
Additionally we can use the liquidations in reversion strategies as well, as liquidations are sort after, when liquidity is then taken, we can see this as an opportunity to play reversion
with the necessary liquidity being "hunted" and no longer a magnet for price to revisit therefore price can then return to the mean.
The indicator also has 2 available modes, relative liquidations/normal.
The relative mode can be seen above which will make liquidations more visible when larger/significant, as well as highlight the liquidations when hitting extreme thresholds.
Below is an example with relative mode off.
To Do:
Add Custom Alerts
Add User Customizable Relative zones
User customizable relative zones will be added soon, this will allow users to determine the thresholds for highlighting relative zones.
A screenshot of another chart is shown on the indicator, this is to highlight its accuracy in simulating liquidations.
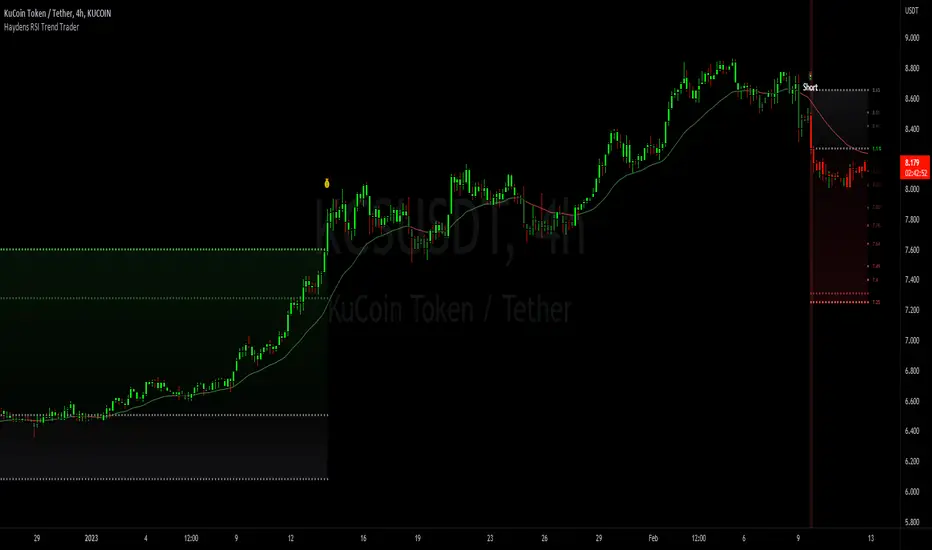
Haydens RSI Trend TraderThis is a simple trend trading companion indicator for Hayden's Advanced RSI, which can be found here:
For best results, please be sure your oscillator and chart companion settings match. Detailed trade information & statistics can be found when hovering over any of the indicator labels. The backtesting results are not calculated the same as TradingView, and the original code can be found here
Shoutout to the following authors for the code snippets that were used in making this indicator: @lazybear @kiosefftrading @Koalafied_3 @mabonyi @Capissimo
LiquidationsFirst, thanks to the following Tradingview community members for providing open source indicators that I used to develop this indicator!
Liquidations by volume (spot/futures) - @Thomas_Davison
Pivot and liquidation lines - @lmatl
Let me know if either of you do not approve and I will remove the indicator.
This indicator uses pivot points, volume and a liquidation percentage to determine potential liquidation levels. These are not exact but can give traders an idea of potential support or resistance levels.
Pivot points: Currently the pivot points are set to look left 5 bars and right 2 bars. This will determine the high and lows in the chart.
Volume: Assuming that high volume bars are where more leverage is used, this indicator uses the average volume over a 1000 bar period to determine to determine a baseline. I have arbitrarily set 100x lines to 20% above the average volume, 50x lines 10% above, 25x lines 5% above, 10x lines 2.5% above and 5x lines 1.25% above.
Liquidation: Finally, we are making a few assumptions on how liquidations are calculated. The following table includes the percentage a position can decline before being liquidated.
Short: Long:
100x 0.51% 0.49%
50x 1.55% 1.47%
25x 3.70% 3.38%
10x 5.11% 4.67%
5x 6.705% 6.115%
Let me know if there are any questions or if anyone has any improvements!

Liquidation Levels V2 (Ultimate Edition)!(version 2.0) - Covers ALL pairs from Binance futures (USDT)!
The Liquidations Level Indicator is a new, fresh and innovative indicator that adds a new perspective into the charts.
The indicator plots (in real time !), the liquidation points/levels that are "created" for every new position that is currently opened in futures trading of a cryptocurrency.
The calculation and the plots work for both directions (either longs or shorts).
How it is done: We calculate all new large positions opened by other traders, by taking into account the Open Interest from major exchanges.
For each new large position that is opened, the indicator plots in the chart the liquidation levels for the specific position per leverage level (100x, 50x or 25x).
This is exactly what the Market Maker knows!
In crypto, the Market Maker, tends to push the price to these levels, making these levels targets.
You could combined it with any other Technical Analysis indicator you used to trade.
Add it to your favorites indicators and enjoy the price action. You will soon realize that our indicator can be a game-changer indicator !
Soon, we will add some here in TradingView, some ideas and strategies that we have already used with this indicator with success.
Here, a new game starts for you..and the Market Maker. Don't trade against him, trade with him (!)
_____________________________
Notes:
_____________________________
1) Second version supports allt the USDT crypto that are tradable on Binance futures (at least).
Right now you can use any of them (e.g. BTC , ETH, BNB, XRP, ADA, SOL, DOT, DOGE, MATIC, LTC, ATOM, , etc. )
paired with one of the above stablecoins:
USD, USDT, USDC , or BUSD.
2) You can adjust the lower limit to take into account for new positions (total amount is in millions USD/USDT/ USDC ), so you can filter the positions and display only the large ones.
This adjustment is up to you and it is different for each coin, as they have huge differences in Total Market Cap and the Total amount trading per day.
BTC is almost always first, and then ETH, Luna, etc. From our experience a amount of 5m in USD fits for BTC , 2m USD for ETH, and you can of course switch it.
3) Don't use the indicator with any other pair, except the above ( /USD, /USDT, /BUSD or / USDC ). The Open Interest is calculated per USD, so if you project this over a crazy pair (e.g. BTC /LTC) it will not project anything.
4) Initial version supports reading the Open Interest from Binance. Upcoming versions will expand this, as an option.
_____________________________
Extras:
_____________________________
This was our first effort to build something for the crypto community, that can be useful and of course free.
We hope we like it. If you like the indicator, just spread it.

Aggregated Volume Spot & Futures ⚉ OVERVIEW ⚉
The indicator presents a comprehensive approach to Aggregated Volume Data . Works on almost all CRYPTO Tickers!
The script also includes several input parameters that allow the user to control which exchanges and currencies are included in the aggregated data.
This script allows the user to choose from several data display modes, including volume, spot & perp, delta, cumulative delta, and others.
The user can also choose how volume is displayed (in assets, U.S. dollars or euros) and how it is calculated (sum, average, median, or dispersion).
WARNING Indicator is for CRYPTO ONLY.
______________________
⚉ SETTINGS ⚉
‾‾‾‾‾‾‾‾‾‾‾‾‾‾‾‾‾‾‾‾‾‾
Mode — Choose Mode.
• Volume — This displays the Volume
• Volume (Colored) — Shows aggregated volume but applying different volume colors for different exchanges.
• Delta — This displays the difference between the number of sellers and buyers.
• Cumulative Delta — This displays the cumulative delta between sellers and buyers.
• Spot & Perp — Shows Spot and Futures volume at the same time.
• Delta (Spot - Perp) — Shows the difference between Spot and Futures Volume.
• Liquidations — Displays Potential Liquidations. (Calculated between the difference in volume between Futures and Spots)
• OBV — On Balance Volume.
• MFI — Money Flow Indicator.
• Data Type — Choose Single or Aggregated data.
• Single — Show only current Volume.
• Aggregated — Show Aggregated Volume.
Volume By — You can also select how the volume is displayed.
• COIN — Volume in Actives.
• USD — Volume in United Stated Dollar.
• EUR — Volume in European Union.
• RUB — Volume in Russian Ruble.
Calculate By — Choose how Aggregated Volume it is calculated.
• SUM — This displays the total volume from all sources.
• AVG — This displays the average price of the volume from all sources.
• MEDIAN — This displays the median volume from all sources.
• VARIANCE — This displays the variance of the volume from all sources.
* 🡅 Be Careful, Reacts to Every Mode.
Additional features
• Show MA — Show Movieng Average of Volume.
• MA Period — Period of MA.
• Lookback — Lookback period for 'Cumulative Delta' and for 'MFI'.
• Liquidation Filter — Filters out small or negative difference values.
• Show Table — Table shows the current volume of the last candle. Also in the Mode "Colored" shows the color of exchanges if they have volume.
________________
⚉ NOTES ⚉
‾‾‾‾‾‾‾‾‾‾‾‾‾‾‾‾
I don't pretend to be the best choice for calculating CVD , Delta and Liquidations, the calculations are chosen to be optimal from what I have seen and know.
If you have any ideas what to add to my work to add more sources or make calculations cooler, suggest in DM .

LIQUIDATION [CFI]EN description
The indicator determines signs of liquidations of futures contracts. It works according to the author's algorithm based on: prices, volumes, levels and candlestick analysis.
The larger the diamond, the greater the volume of potential liquidations of longs or shorts was on a particular candle. There are 5 sizes of diamonds: small, conditionally equal to 1x, medium - 3x, large - 5x, huge - 15x, huge - 50x. That is, on the largest diamond, the volume of liquidations is 50 times greater than on the smallest one (namely, the volume, not to be confused with shoulders).
The price of the location of diamonds is equal to the maximum (for short liquidations) price for a particular pair, or the minimum (for long liquidations). Thus, you can immediately see to what marks the price reached on different pairs and exchanges
The indicator displays new liquidations only after the candle closes. It cannot redraw data. Diamonds with a green tint - liquidation of long contracts, with a red tint - liquidation of short contracts.
The indicator simultaneously monitors 7 pairs on 5 exchanges:
BINANCE BTC/ETH BTCUSDTPERP
BINANCE BTC/ETH BTCBUSDPERP
BYBIT BTC/ETH BTCUSD.P
BYBIT BTC/ETH BTCUSDT.P
KRAKEN BTC/ETH BTCUSDTPERP
HUOBI BTC/ETH BTCUSDT.P
OKEX BTC/ETH BTCUSD.P
As you know, it is impossible to get reliable data about the real liquidations of traders, so this script only displays the signs of these liquidations. As you can see, the price often reverses after large diamonds, so I think that the script turned out to be working and useful. The indicator is best used when trading sideways, when there is accumulation or distribution - in such situations, after collecting liquidations, the price almost always reverses and goes to collect liquidations from the opposite side
RU описание
Индикатор определяет признаки ликвидаций фьючерсных контрактов. Работает по авторскому алгоритму в основе которого лежат: цены, объёмы, уровни и свечной анализ.
Чем больше ромбик - тем больший объём потенциальных ликвидаций лонгов или шортов был на конкретной свече. Бывает 5 размеров ромбиков: маленький, условно равен 1х, средний - 3х, большой - 5х, огромный - 15х, огроменный - 50х. То есть на самом большом ромбе в 50 раз больше объём ликвидаций, чем на самом маленьком (именно объём, не путать с плечами).
Цена расположения ромбиков равна максимальной (для ликвидаций шортов) цене для конкретной пары, или минимальной (для ликвидаций лонгов). Таким образом сразу видно, до каких отметок доходила цена на разных парах и биржах
Индикатор отображает новые ликвидации только после закрытия свечи. Перерисовывать данные он не может. Ромбики с зелёным оттенком - ликвидации лонг контрактов, с красным оттенком - ликвидации шорт контрактов.
Индикатор одновременно отслеживает 7 пар на 5 биржах:
BINANCE BTC/ETH BTCUSDTPERP
BINANCE BTC/ETH BTCBUSDPERP
BYBIT BTC/ETH BTCUSD.P
BYBIT BTC/ETH BTCUSDT.P
KRAKEN BTC/ETH BTCUSDTPERP
HUOBI BTC/ETH BTCUSDT.P
OKEX BTC/ETH BTCUSD.P
Как вы знаете, нельзя получить достоверные данные о настоящих ликвидациях трейдеров, поэтому этот скрипт лишь отображает признаки этих ликвидаций. Как видите, часто цена разворачивается после крупных ромбиков, поэтому я считаю, что скрипт получился рабочим и полезным. Индикатор лучше всего применять при торговле в боковике, когда идёт накопление или распределение - в таких ситуациях почти всегда после сбора ликвидаций цена разворачивается и идёт собирать ликвидации с противоположной стороны

Liquidations by volume (TG fork)Shows actual liquidations on a per-candle basis by using the difference in volume between spot and futures markets.
i.e. volume on a futures market will be much higher if there are many liquidations.
By default, green represents short liquidations (hence a bullish move, hence why it's green), whereas red is for long liquidations (bearish move). The colors can be changed in the settings if you prefer an inverted theme.
Long liquidation data should in theory be more accurate than short liquidation data due to the inability to short on a spot market.
This indicator should be able to help identify trends by determining liquidation points in the chart.
Extended by Tartigradia to automatically detect the symbol (only for crypto assets found on Binance with a USDTPERP pair, so it works for ETH, BNB, etc) and add multi-timeframe support (MTF).
If you like the indicator, please show the original author Thomas_Davison some love:

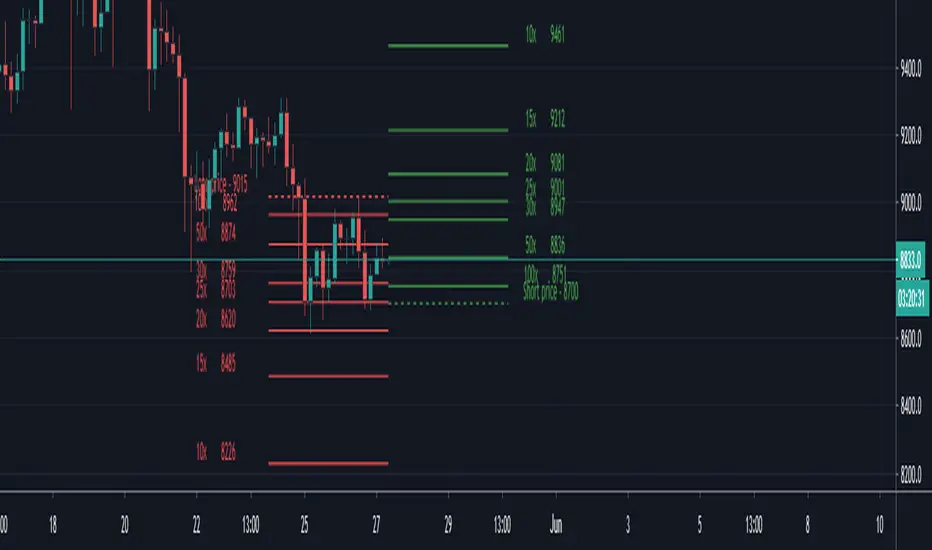
Liquidation Levels v2 [LG]The main premise of this indicator is to identify when large cryptocurrency futures positions are opened, and then plot the liquidation levels of those positions. Market makers know this data and tend to push price towards these levels, as there is guaranteed liquidity at or approaching those levels.
Remember, we want to buy when others are forced to sell, not when they want to sell, and vice versa. Whales want to position, but need to do so in areas of larger liquidity, as they want to minimize slippage and detection as much as possible.
This indicator is very useful during times of chop, when the market is taking liquidity anywhere it exists as whales are forcing retail players out of their positions.
This indicator will also plot where positions with a total value in excess of the user-defined threshold are opened or closed, so you are able to better gauge how market participants are reacting to price levels.
Commonly used leverage levels are 100x, 50x, and 25x, but can be adjusted by the user depending on what they are noticing is attracting price levels.
This indicator is recommended for use on the 1 minute chart of the Binance BTCUSD perpetual contract pair. This will allow for as much precision as possible for the majority of users. Note: The only supported coin at this point is BTC - other coins to follow soon.
SUMMARY
1) View liquidation levels of large positions opened
2) View exact moments where large positions are opened or closed
3) Gauge available liquidity to upside or downside to better assist in determining longer term reversal points
COMING SOON
1) Additional coins
2) VPVR inspired vertical histogram or other visualization tool summarizing total available liquidity at specific price level
3) Total delta of available long and short liquidity
4) Push notifications when price takes liquidity
5) Requests as outlined in the comments
This indicator was inspired by the Hyblock Capital liquidation levels and offers an improvement upon the popular existing Liquidation Levels indicator by mlapplications.

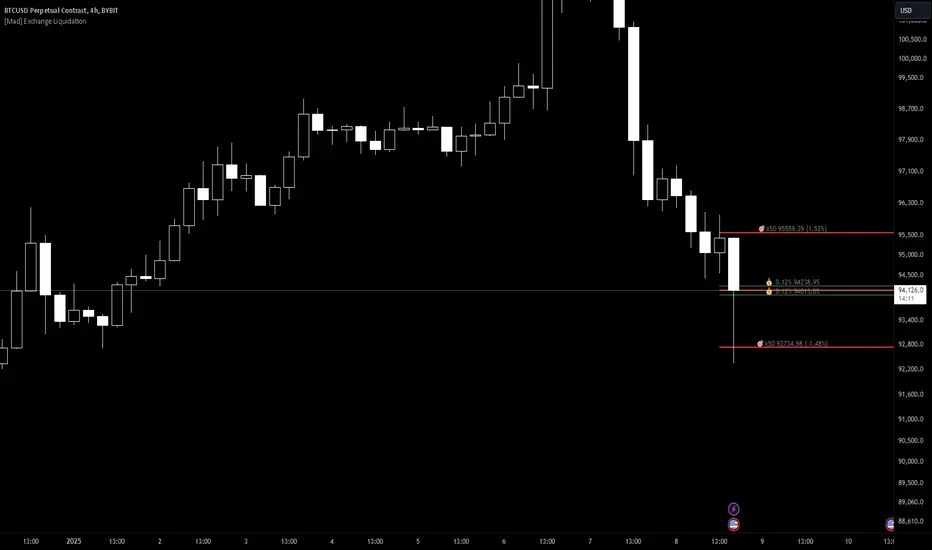
[Mad] Exchange liquidationThis is just a basic tool to calculate liquidation based on:
margin-maintenance
leverage
it starts drawing on your input point short and long liquidation, so you can easily place it on your trade and drag it around if you are rebuying as an example.
Also, you can use it to aim for a specific support/resistance to see if it is even possible to reach some levels, which leverage you can use...
It additionally delivers live data based on the actual close to the 2 liquidation points
have fun
TriexDev - Liquidation Rekt LevelsTriexDev - Liquidation Rekt Levels TradingView Indicator
A basic indicator which lets you see where positions will be liquidated. Each line is based on default leverage levels typically used for trading. (3x,5x,10x,25x,50x)
Have a subtle 'label prompt' on the 3x - because I had noticed some people didn't understand what labels were in other indicators.
In the settings:
- There is an offset to adjust the levels horizontally, this is to help make it easier to track if the chart has hit liquidation positions.
- You can change colours/opacity of the lines.
- You can hide the 'Labels', and/or 'label prompt'
- In the 'Style' tab you can hide individual levels.
Inspired/initially based off 'Mex Rekt Level'
I often have this added to my charts, and toggle visibility when I want to check the liq levels.
GitHub Repo for tidier/more detailed documentation as it is updated.

ICT LIQUIDITY indicator [Focused Trader]This indicator allows you to draw liquidity according to ICT. Specifically, you can choose to draw liquidity for specific sessions (Asia,New York,London).
Filtering by session
You can chooose to display only liquidities created in specific session. For example, the favourite liquidity is that of Asia. And then, in London market usually grabs it. So you set to display only liquidites of asia.
Session background
You can also display background over specific session, this is very usefull to see how market behaves - liquidity created in Asia is very often taken in London session. You can use any colour you'd like.
Colouring and style of lines
There is an option to choose colour for liquidity lines from different sessions and also choose specific colour for highs and lows. You can also set different styles (dash, dot, arrow, ...) of liquidty lines.
WhaleCrew VolumeThis indicator aims to provide a deeper insight into market events by using volume data.
Features
Aggregating volume data across multiple exchanges (only for built-in crypto pairs, e.g. BTC and ETH)
Detection of volume spikes (customizable size)
Alerts for volume spikes (breakouts/mass liquidation events)
Configurable moving average type
Custom moving average multiplier
Usage
The composition of the aggregated volume data can be visualized to show the respective volume of each exchange.
Identify which exchanges (and their traders) fueled price movement. Was their share in the total aggregated volume higher/lower than previously?
Pay attention to exchanges that are notorious for a lot of beginner/retail traders to make more informed decisions.
The volume spike detection is ideal for getting alerted whenever a breakout (in price action and/or volume) or mass liquidation takes place.
(Spikes are detected relative to the set moving average.)
Access to this indicator can be obtained through our website.

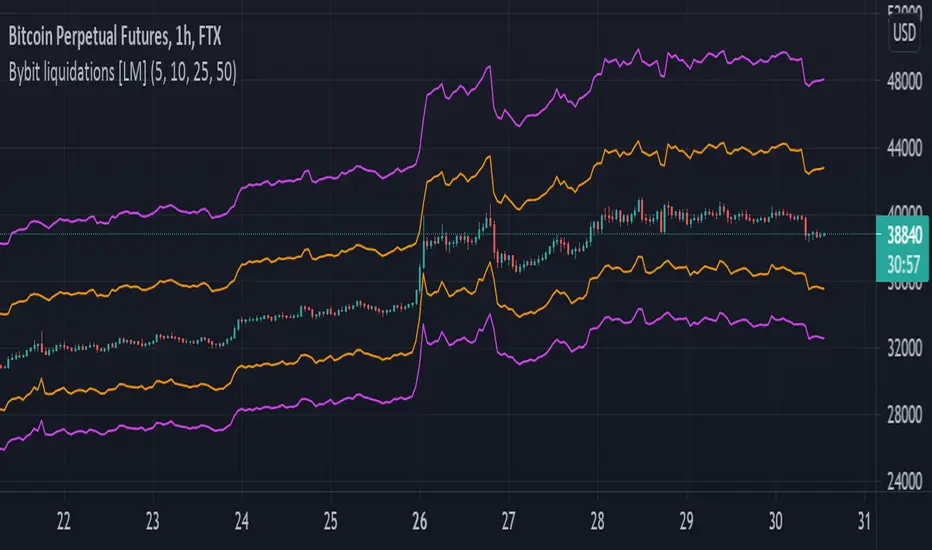
Bybit liquidations [LM]Hello traders,
I would like to introduce you script for calculating liquidations on Bybit(it's applicable not only for Bybit). The idea is to render lines and look for confluence with other indicators where is most likely that people will get liquidated.
It has setting with 4 leverages that will render line below and above price always calculated from high and low of the candles.
Hope you will enjoy it.
Bybit Calculator Liquidation levelsThis script uses the bybit liquidation calculator method to identify liquidation levels.
Given an entry price and a leverage, the calculator will give you a liquidation price. Those liquidation prices are displayed by this script.
It saves some time as we avoid asking the calculator the liquidation prices for the main leverage multipliers once.
These levels could be used to identify liquidations wicks. As we approach levels, traders that don't use stop loss will be liquidated and create a larger move through these levels. I personally set the entry price to be a large volume node and that seems to somewhat predict interesting levels to watch for (but use at your own risk)
Example:
- pair: BTC/USDT
- margin mode: isolated
- position: long
- leverage: x50
- entry price: 33640
- quantity: irrelevant for isolated
-> the calculator gives a liquidation price of 33135.4 USDT, this level is displayed below entry price with a x50 annotation

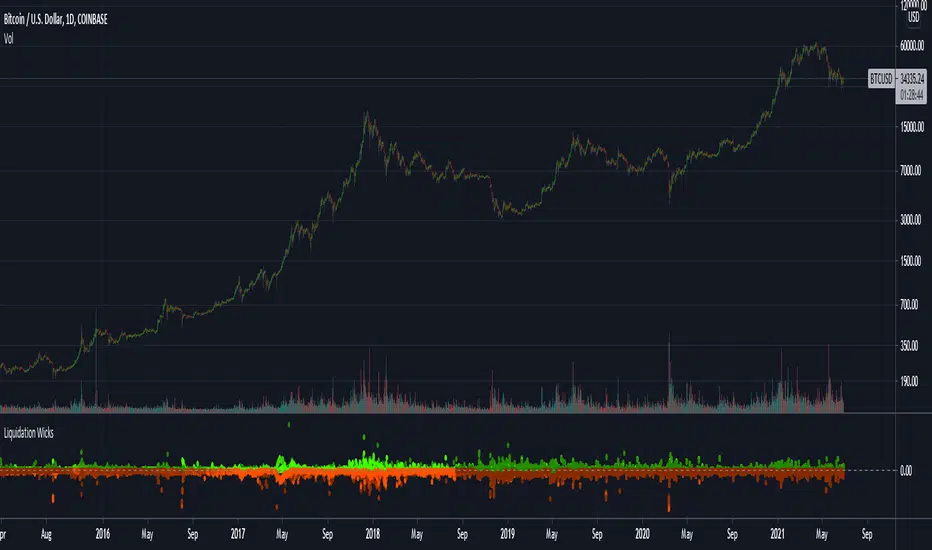
Liquidation Wicks BTCThis script shows the variance between the various btc intruments to find when liquidation cause extreme wicks and price disparity between exchanges
The red dots indicate the difference of the LOWS
and the green dots indicate the difference of the HIGHS
The indicator only works for BTC but it doesn't matter what chart its used on
Liquidation Levels [Anan]
Liquidation Levels in real-time with editable calculation base
This indicator plots these Liquidation Levels:
- 100X
- 50X
- 25X
- 20X
- 10X
Calculation methods:
- VWAP (default)
- WMA
- VWMA
- EMA
- ZeroLag EMA
- DEMA
- TEMA
- SMA
- Smooth SMA
- Hull MA
- Triangular MA
- SuperSmooth MA
- Blackman Filter
- RMA

PT LiquidityVersion 1.0 of our Liquidity indicator helps determine areas where price might gravitate to fill liquidations. We have six levels of interest, broken down into three levels for shorts (highlighted in red) & three levels for longs (highlighted in green). Each level is labeled 25x, 50x, 100x. We added a cloud for a visual to assist in short/long liquidation zones. You want to be taking short setups at the top of the cloud when shorts get squeezed & taking long setups at the bottom of the cloud when longs get squeezed. The indicator has a proprietary formula that allows the levels to change based on volume and time frames. The levels are generated in real-time with a rolling VWMA.
Strategy:
If you are scalping, price tends to ping pong between the 50x & 100x longs (green) to 50x & 100x shorts (red). If we shift outside that zone, consider the trend to have changed. Look at a higher time frame (12h+) for trend direction. Price usually reverses when the daily takes all three liquidation levels. You want to see a strong reaction (wick) once we tap that last liquidation level.
This Oscillator was built around our buy sell indicator & it is used on all time frames for swinging & scalping. It is included as part of the library. Just message us for access!

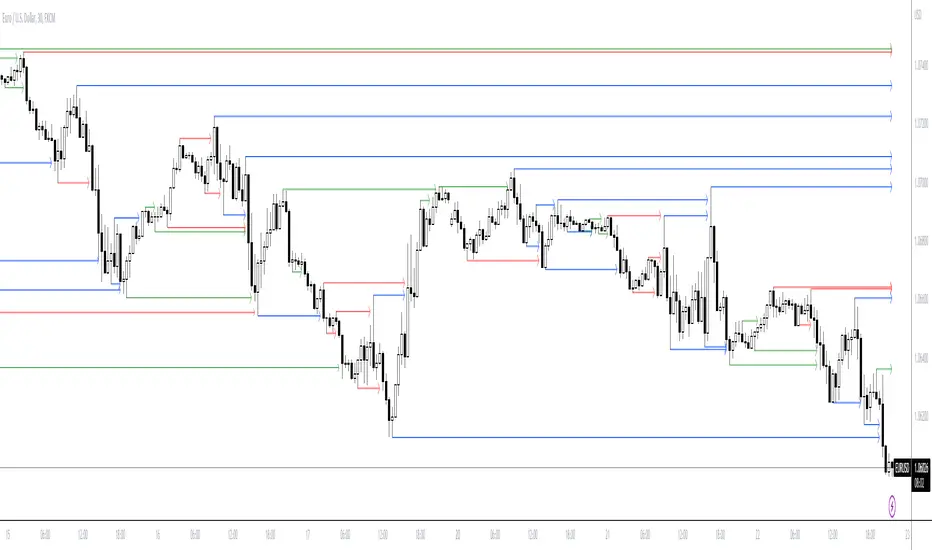
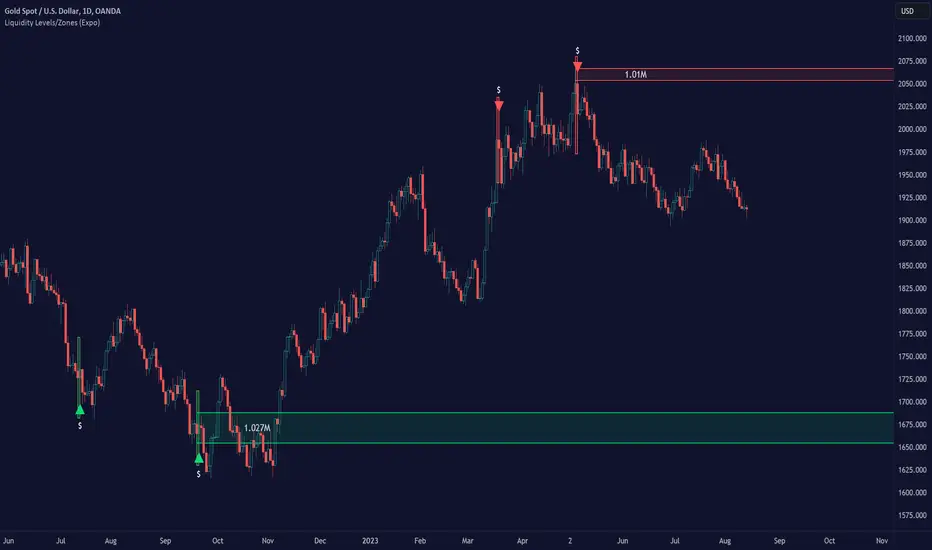
Liquidity Levels/Zones (Expo)Liquidity Levels/Zones (Expo) automatically identifies and displays key liquidity levels/zones.
Liquidity describes the extent to which an asset can be bought and sold quickly, without affecting the price. It is a measure of how many buyers and sellers are present, and whether transactions can take place easily.
Levels/Zones are displayed where there is a significant level of trading activity and when there is both high supply and demand for an asset, security, or contract. These levels can leave clues for future price behavior and act as support/resistance zones. The trading activity can confirm the existence, or a continuation, of a trend or a trend reversal.
The user can modify the settings so that short- term, medium-term, and long- term liquidity levels/zones are displayed.
The indicator can be used standalone or as a part of your current trading strategy.
Real-time
No repainting
Works on any market
HOW TO USE
1. Use the indicator to identify key liquidity levels/zones.
2. Use the indicator to identify high trading activity.
3. Use the indicator to confirm the existence, or a continuation, of a trend or a trend reversal.
INDICATOR IN ACTION
1-hour chart
I hope you find this indicator useful , and please comment or contact me if you like the script or have any questions/suggestions for future improvements. Thanks!
I will continually work on this indicator, so please share your experience and feedback as it will enable me to make even better improvements. Thanks to everyone that has already contacted me regarding my scripts. Your feedback is valuable for future developments!
ACCESS THE INDICATOR
• Contact me on TradingView or use the links below
-----------------
Disclaimer
Copyright by Zeiierman.
The information contained in my scripts/indicators/ideas does not constitute financial advice or a solicitation to buy or sell any securities of any type. I will not accept liability for any loss or damage, including without limitation any loss of profit, which may arise directly or indirectly from the use of or reliance on such information.
All investments involve risk, and the past performance of a security, industry, sector, market, financial product, trading strategy, or individual’s trading does not guarantee future results or returns. Investors are fully responsible for any investment decisions they make. Such decisions should be based solely on an evaluation of their financial circumstances, investment objectives, risk tolerance, and liquidity needs.
My scripts/indicators/ideas are only for educational purposes!
MR Liq lvlHi Guys!
- This script show you liquidations levels with leverage of 100X, 50X, 25X & 10X (shorts & longs).
- This indicator "only" works for XBT on Bitmex.
- Other indicators only show the liquidations up to 25X .
- The idea of this indicator is to help the user to determine those levels where Bitmex hunt liquidity.
Best Regards.
Mr.amin

BITMEX LIQUIDATION LEVELSThis is a BITMEX exchange liquidation levels with different leverages.
Calculations are made by Bitmex calculator.
Included leverage levels 1, 2, 3, 5, 10, 15, 20, 25, 30, 50 and 100x
By default indicator calculates levels from current price.
To input your own price unchek "Auto or manual" checkbox and input your price data.
----------------------------------------------------------------------------------------------------------------
Данный индикатор считает уровни ликвидации на бирже BITMEX с разными плечами.
Вычисления сделаны по калькулятору биржи BITMEX.
Внесенные уровни по плечам: 1, 2, 3, 5, 10, 15, 20, 25, 30, 50 и 100х
По умолчанию индикатор считает уровни от текущей цены.
Для ручного расчета снимите галочку с "Auto or manual" и внесите свои данные.
[VIP] Multi Timeframe Pivot Support Resistance (MTPSR)MTPSR provides 6 boards to watch pivots, supports, and resistances in cross timeframes. By default, timeframes are 15m, 30m, 1hr, 2hr, 4hr, and 1D with the current ticker, but they are changeable on indicator setting.
The Pivot, Support, and Resistances have 2 algorithms; Fibonacci or Classic. Default is Classic, but you can change on indicator setting.
MTPSR has 2 additional boards with BitMex Long and Short Liquidation algorithm, this logic can be used for any ticker especially if you want to have tight control with margin liquidation.
MTPSR provides KDJ charts in cross timeframes with the last 3 candles for every board. The default does not appear, but you can enable it on indicator setting. If Greenline crossover Redline, that is a good position to the long or indicating uptrend. But if Greenline crossunder Redline, that is good position to the short or indicating downtrend.
MTPSR has DI/ADX for every board, DI is a difference between DI+ and DI-, if the value is negative means downtrend, if the value is positive means uptrend.
HOW TO USE
Long Trading
The Support will be a good position to entry
The Resistance will be a good position to take profit
If in lower time frames, the candle keeps cross over the resistances, that means uptrend rally is happening.
Short Trading
The Support will be a good position to take profit
The Resistance will be a good position to entry
If in lower time frames, the candle keeps cross over the resistances, that means uptrend rally is happening, it is not good for short
Scalping Advice
If you scalp in day trading, it is recommended to watch Pivot/Support/Resistance on Timeframes 1D, 4D, and 1W
If the chart is sideways on the 1D pivot and the direction from support to pivot, that means the market wants to have a correction to closer support
If the chart is sideways on the 1D pivot and the direction from resistance to pivot, that means the market wants to have retest to closer resistance before another drop or breakout to continue the rally
Use can scalp on TF 15m or TF30m, the Pivot/Support/Resistance in lower timeframes can be so dynamic, so you have to pay more attention on trading strategy, you can use 2H and 4H Pivot/Support/Resistance as the target
You can also use Liquidation Long/Short boards for scalping trading strategy to take profit or cut lost
ALERTS
Every pivot board has alert which condition: if candle cross over or under support, resistance or pivot even KDJ cross over or under
Every liquidation board has alert which condition: if candle cross over or under every margin level
Example alert title for every board when candle cross over: Over Support TF 1, Over Resistance TF 1, Over Pivot TF 1, KDJ Up TF1
Example alert title for every board when candle cross under: Under Support TF 1, Under Resistance TF 1, Under Pivot TF 1, KDJ Down TF1
Feedback
Please drop a comment or send a direct message for any bugs or request new feature
I dont sell source codes, please not DM me about it

BitMex Liquidation & Bankruptcy PlotsThis script was created for the Bull Bear Bots community to help users manage their risk with respect to avoiding the dreaded liquidation emails from BitMex.
Colour legend:
Dark Green - Liquidation point for Longs
Light Green - Bankruptcy point for Longs
Dark Red - Liquidation point for Shorts
Light Red - Bankruptcy point for Shorts
Disclaimer:
As BitMex do not publish the exact calculations for liquidation, this should be used as an approximation only as the results are slightly offset to what the official calculator provides. This issue is not unique to this script and if you cross-check all the other online calculators with the official one, you will find the same issue.
