P/L count for MACDSimple and effective P/L Count (based on MACD indicator) shows you when MACD give profit and when it lead to loss. PL Count consist of three plots: green (profit), red (loss) and orange (0 by default, but you can setup it as minimum profit level. Go into deal when green(profit) crossover red(loss) and exit when red crossover green. Use it together with MACD for determine deal direction. For some instruments deal opens when green crossover orange minimum profit level (not cross green and red)) .
Loss

Hendo's Volatillity Stop HelperA simple indicator helping you with stop loss placement. It uses the recent volatility in the market to generate a band above and below price.
If you struggle with stop loss placement but already understand entries, exits and direction this indicator might be one for you.
Pairs extremely well with certain oscillators, price action trading and pivot point trading.
Comes with 8 settings to facilitate both types of traders:
High acuraccy, low risk/reward ratio
Low acuraccy, high risk/reward ratio
Colours & Transparancy are fully customizable. Access is free, source code is protected and will remain to be so.
In order to achieve the best results I highly suggest you to place stop losses below the lower band (in longs) and above the upper band (in shorts).
Stay tuned for more!

ATR ChannelsATR Channels help you to identify where to place your stop-loss or trailing stop-loss based on price volatility, according to the Average True Range (ATR).

Moving Gain Loss PercentTracks the percentage gain/loss in three ranges:
single candle (can be turned on or off)
custom range of candles
custom range of candles
For example, with a range of 3 candles, and the serie:
1 - close 10
2 - close 5
3 - close 20
The moving gain would be:
1 - close 10 - gain 10, infinite%
2 - close 5 - gain 5, infinite%
3 - close 18 - gain 8, 80%
Or, for example if the range is 12 candles on a monthly chart, then the result is the Year-To-Date gain/loss plotted as a percentage.


Gain Loss V2This is the Version Two of my Gain/Loss percent indicator, it's really simple but very handy indicator, when you go into a position, most of the time during a day trade, you don't have enough time to sit back and calculate the percentage of your gain or loss specially with maker/taker fee and leverage and sometimes funding fee you should pay the exchanges/brokers.
The default values for maker/taker and funding fees are set as you would encounter in Bitmex exchange. every 8 hours you are in position, you should rise the number of funding you pay by one, The rest will be calculated automatically.
Normally you need to set the fees for maker/taker and fund based on what your broker/exchange tells you once, then each trade, you set your entry point, being it a margin trade or not, and finally if it's margin, the direction and the leverage and that would be it.
Again, most of the time traders don't change their leverages, so you would set it for once and after that, you just set the entry, click the direction boolean and that is it.
The source is hidded but every one can use the script.


NeoIchi TrailingThis is the separation of moving average parts from NeoIchi indicator with addition of four different ATR setting that can be used for Stop Loss and Trailing Stops. The NeoIchi indicator won't have any moving averages any more, the code is secured but every one have access to use this indicator on their charts.
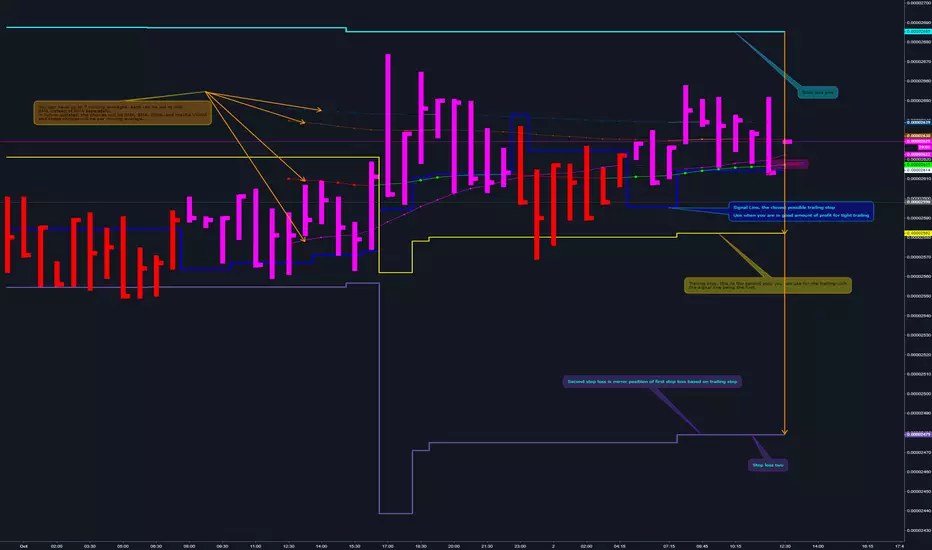
Double EMA with stop loss indicatorThis is an updated version of my previous stop loss script.
I've added a double EMA line and modified the stop as below;
In an uptrend....
1. a yellow dot will appear once it's time to move your stop. The yellow dot will display at the level of the stop loss. Place your stop 1 pip below the dot.
2. The yellow dot will only appear if a new higher low has formed and has been confirmed. Also the current candle must have broken the high of a previous bullish candle or the dot will not appear.
3. The dot will also appear if there is a likely reversal of the current trend.
Also works in downtrends.....

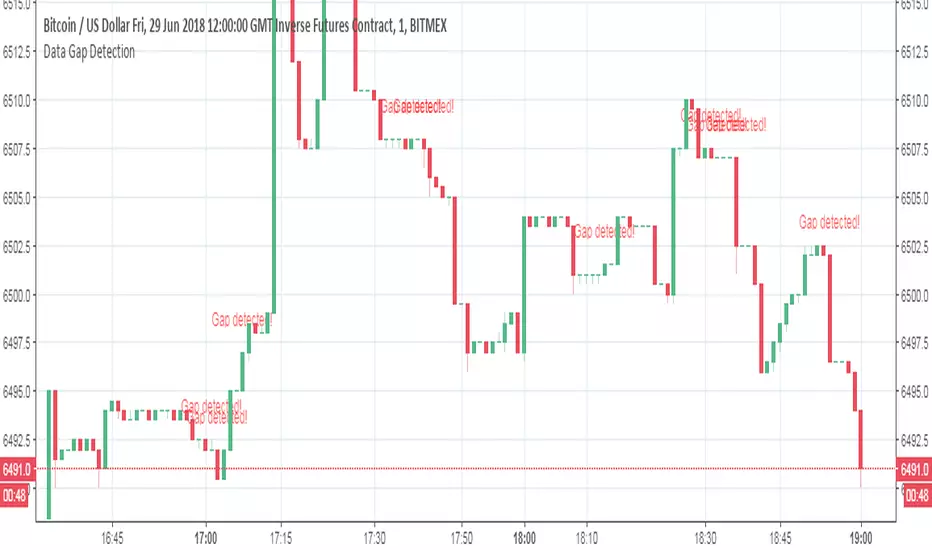
Data Gap DetectionThis simple script checks for data gaps in an intra-day TradingView chart. I have found that BitMEX 1-minute data is coming in rather holey lately, so I wrote this just to see how prevalent the problem is. It should work on any intra-day timeframe, not just 1-minute.
V1: initial release.
No Emotions indicator- Execute your trading plan EMOTIONLESSEmotions are one of the most important variable in trading
With this indicator you can execute your trade without any feelings ruining your plan
The idea is simple: you can monitor your trades by just looking at a row of colored squares, no need to watch the charts once entered a trade
Green square= you are in profit
Red square = you are in a loss
Yellow cross on green square = take profit hit
Purple cross on red square = stoploss hit
Just input the symbol, entry price (entrata), take profit and stoploss
From there, just watch the squares and no charts
Each row of squares is an entry, you can input up to 3 entries in this version
No Emotions= perfect trading execution
The code is protected but anyone can use it
if you enjoy this free indi, check out my main creation called "Stochastics Real Deal Indicator"

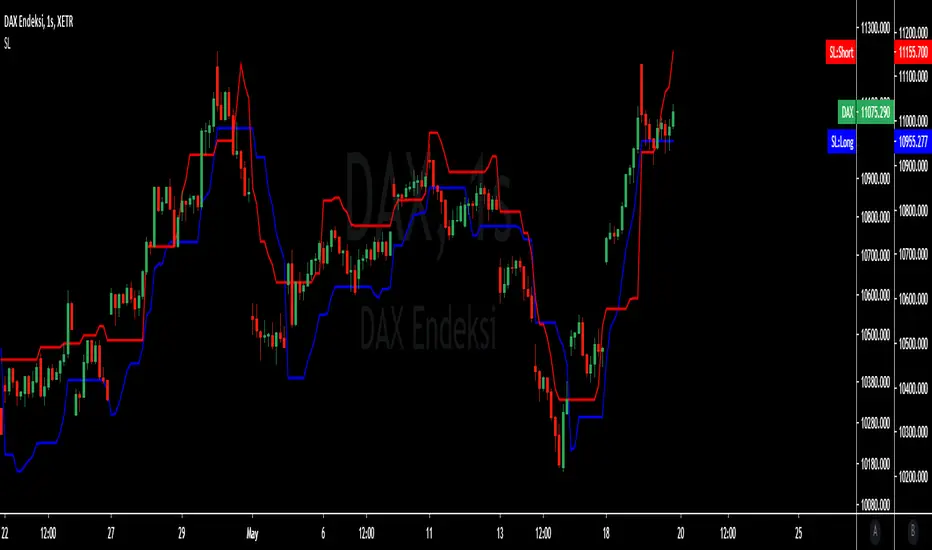
Binque's Stop Loss IndicatorBinque's Stop Loss Indicator is a great way to visualize a trailing stop loss based on a percent from the high. i.e. If the high was $10 of a trading day and your stop loss was set at 5% (percent) then your chart would show a small dot 5% below the high of the day. This is a great way to quickly see a trailing stock idea. Change the color to match your back ground. Adjust your trailing stop loss to fit your trading style.
Note: This indicator is calculated off of the daily high.

ATR+ (Stop Loss Indicator)This script is designed to aid in back-testing and trade execution.
It displays three sets of values - the teal colored value is the current ATR, the green colored value is your stop loss distance (in pips) below the most recent swing low for long trades , and the red colored value is your stop loss distance (in pips) above the most recent swing high for short trades .
You can change the stop loss settings to base your stop loss on a set pip amount or by however many multiples of the current ATR as you wish (eg. 1.5x ATR).
Feel free to ask any questions or edit the script without permission :)
- Matt.

Gain/Loss TrackerHi,
This script's purpose is to provide a really quick view of gain/loss of a buying price.
As it is my first script, it is not perfect.
You have to select % scale and input your buying price in the options.
I'll continue to work on it to :
- make an auto selection of % scale (if possible)
- render different colors (positive/negative differentiation in relation to the buying price)
Updates 11/10/2017
- default precision set to 8 (for satoshis)

Percent Change per CandleThis indicator allows you to quickly view the true % change per candlestick (prev close > current close), but it also has 3 other customizable values for you to set your own % change conditions (such as open > high). Feel free to edit the script to suit your own needs as well.
Gain LossA very simple yet, very useful and lovely oscillator, most of the time, when we have a position in a trend and we want to take a look at percentage of our gain or loss, we need to use the "Price Range" tool time and time again, this, in some trades that you would buy and sell in less than an hour, can become a problem, also, if you have few different things going on in the chart, the price range tool will only add more to it.
Using this little oscillator, you can put the price of your position in the input section and close the settings window and watch your gain or loss percentage in real time.

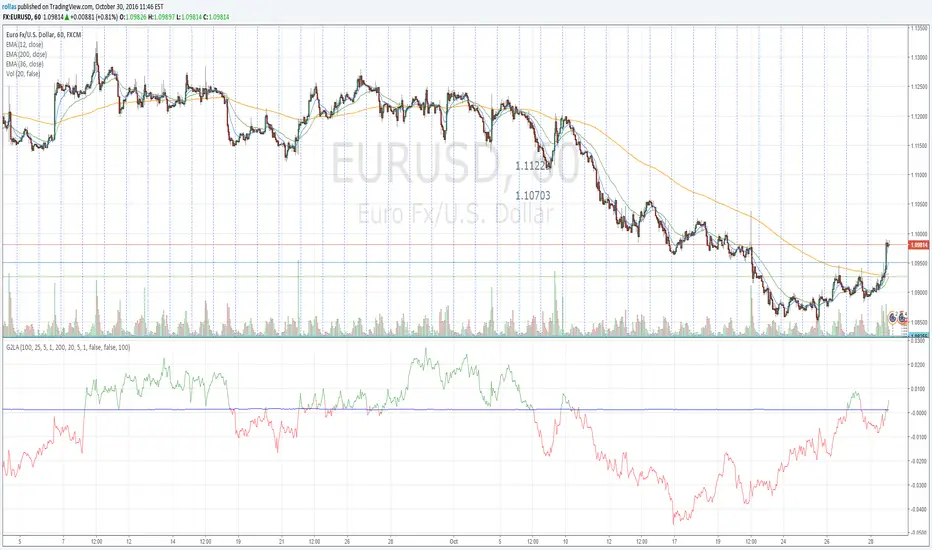
G2LGain over Loss indicator final version. Simplified the code and added option to select period values for the most used resolutions.

Gain Over LossSelf adjusting gain over loss indicator. Shows price movement and momentum. If you want to reach to the parameters you can use the old version.

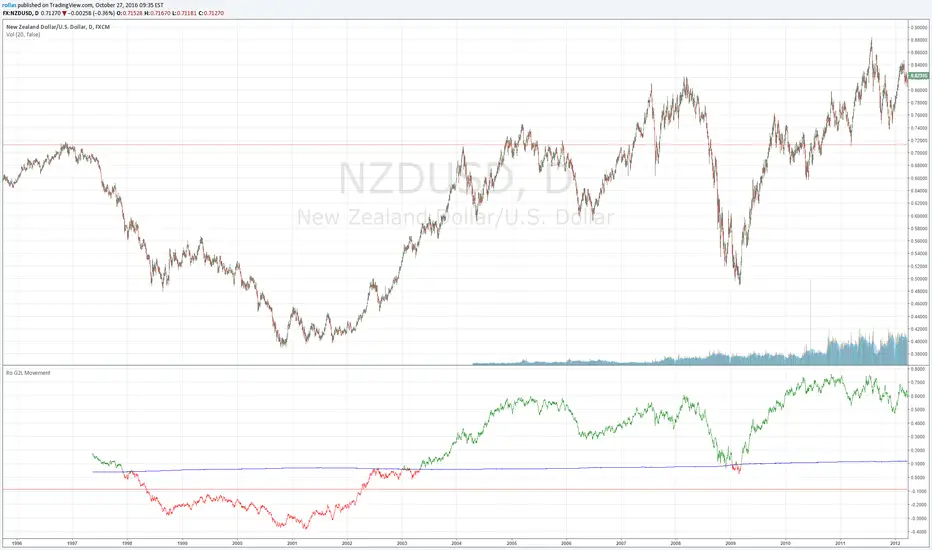
Ro G2L AdvancedGain over Loss Movement indicator with adjustable parameters. Also added an option to show cumulative gain/loss graph.