3RSI 3CCI BB 5orders DCA strategy+This strategy is just an attempt to find the indicator values for the trading bot service that I use (link in profile). Due to the use of the “request.security” function in the code, the indicators can be redrawn, but this is not important in history. The strategy used only 5 orders for the "DCA" - bot, located at the same distance in the price overlap range. I only use this strategy when trading in pairs against bitcoin.
Эта стратегия – просто попытка подобрать значения индикаторов для сервиса торговых ботов, который я использую (ссылка в профиле). Из-за использования в коде функции «request.security» возможна перерисовка индикаторов, но на истории это не важно. В стратегии использовано всего 5 ордеров для «DCA» - бота, находящихся на одинаковом расстоянии в диапазоне перекрытия цены. Я использую данную стратегию только при торговле в парах к биткоину.
M-oscillator

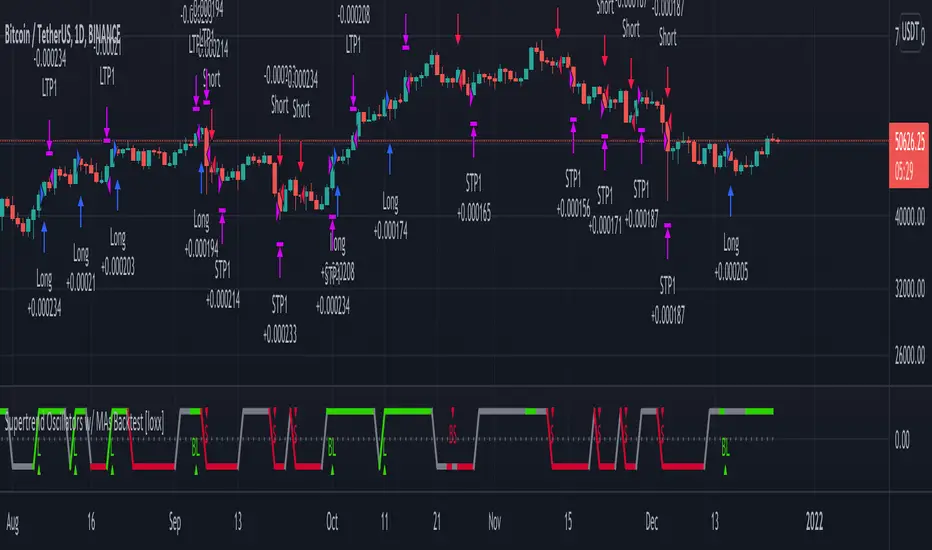
Supertrend Oscillators w/ MAs Backtest [loxx]Backtest for the following indicator:
Features
-3 selectable TPs with ATR
-Adjustable ATR and TPs levels
-Show shorts shorts or longs
-date ranges
Instructions:
-When you select the % per TP you must make sure they add up to 100% between the ones selected or no data will show
-Used to backtest corresponding indicator linked above
Future updates:
-Add lines for TPs and SL
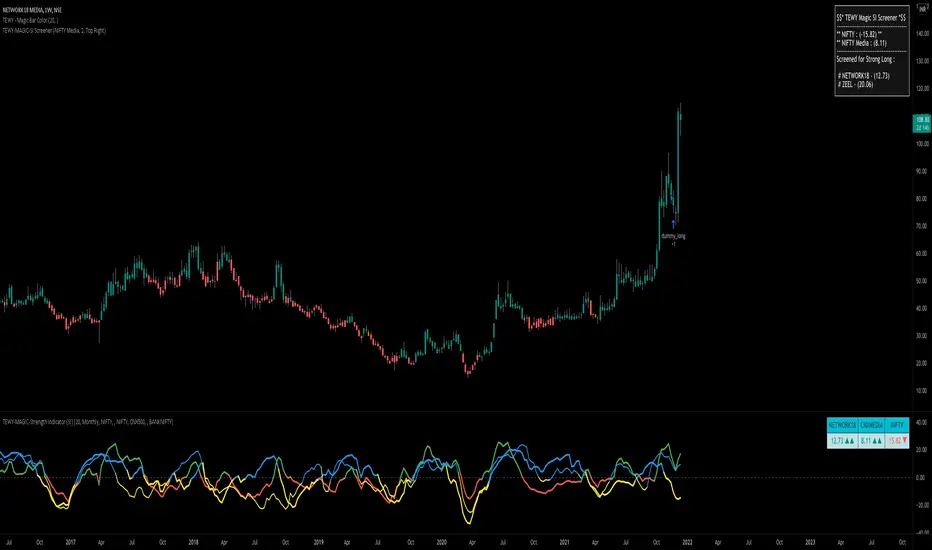
TEWY - Magic Strength Indicator (SI) ScreenerDetail about this indicator
This is screener to identify outperforming Stocks/Ticker based on the indicator "TEWY - Magic Strength Indicator (SI)" I deployed earlier. So please checkout that indicator description to understand more about this screener logic.
Below are the parameters that you may need to use to get outperforming indices/tickers.
1. Screener Set Name :
• Here you can see few of the predefined Index/Ticker sets i created, which you can use to screen Index/Ticker.
• If you select Set for 'Indices' you will get the list of Indices which are out performing NSE:NIFTY. Once you know which index is outperforming, then select the Set for that Index which I already given in the dropdown. That you will get the list of outperforming stock under that index.
• If you want to see all scripts of selected Sector Index that are outperforming NIFTY and may or may not be be outperforming Sector index, then please uncheck the box for "Outperforming Child Index Also". This will get you all the list of Stocks/Tickers which are outperforming Main Index NIFTY.
• If you want to see out-performers for specific period of time then change "How Many Outperforming Candles/Bars" as per your choice
• If you want to see under performers for Short trades then select "Find Short Trades" checkbox
• If you want to see the scripts which are just changed there signal then select "Latest Only" checkbox
Always respect RISKS and follow stop loss. In market stop loss is the only friend of yours.
I have given a sample illustrational image below, which should help you understand this indicator.
Best of luck
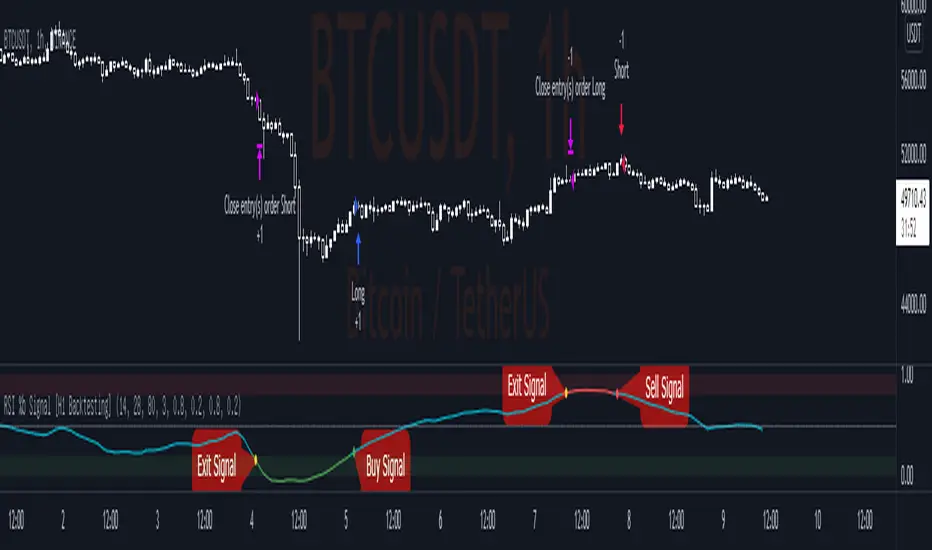
RSI %b Signal [H1 Backtesting]-----------------------------------------------------------------
This simple strategy base on RSI, EMA, Bollinger Bands to get Buy and Sell Signal with detail as below:
-----------------------------------------------------------------
1.Define Oscillator Line
+ Oscillator Line is smoothed by ema(28) of RSI(14) on H1 Timeframe
2.Define Overbought and Oversold
+ Apply Bollinger Bands BB(80,3) on Oscillator Line and calculate %b
+ Overbought Zone marked above level 0.8
+ Oversold Zone marked below level 0.2
3.Buy Signal
+ Entry Long Position when %b crossover Point of Entry Long
+ Deafault Point of Entry Long is 0.2
+ Buy signal marked by Green dot
4.Sell Signal
+ Entry Short Position when %b crossunder Point of Entry Short
+ Deafault Point of Entry Short is 0.8
+ Sell signal marked by Red dot
5.Exit Signal
+ Exit Position (both Long and Short) when %b go into Overbought Zone or Oversold Zone
+ Exit signal marked by Yellow dot
-----------------------------------------------------------------
Joint Conditions Strategy Suite + TradingConnector alerts bot"Please give us combined alerts with the possibility of having several conditions in place to trigger the alert." - was the top voted request from users under one of the recent blogposts by TradingView.
Ask and you shall receive ;)
TradingView is a great platform, with unmatched set of functionalities, yet this particular combo of features indeed seems not to be in place. Fortunately, TradingView is also very open platform, thanks to PineScript coding language, which enables developing combos like the requried one and plenty of other magic.
I have already published numerous "educational" scripts, showing how to code indicators and alerts with PineScript, but... this is not one of them. This one is for real. READY FOR USE on real markets, also by the non-coding traders. Just take my script, set parameters with dropdowns, backtest the strategy, fire the alerts and execute them.
HOW TO USE IT
In "Settings" popup I tried to mimic the CreateAlert popup dropdowns for selecting logic. Let's say you want to enter Long position at Stochastic KxD crossover. In first line of Long Entry conditions set "StochK" + "Crossing Up" + "StochD". Last field doesn't matter because in 3rd dropdown something else than "value" was selected. In second line you could set "maB" + "Greater Than" + "maC" to filter out those entries which are in direction of the uptrend. And yeah, add ADX>25 to make sure the market is actually moving: "ADX" + "Greater Than" + "value" + "25". All condition lines must be TRUE (or skipped) for the entry to be triggered. Toghether with an alert.
The same for Short entries. Combinations are limitless.
INDICATORS AND MTF (MULTI-TIMEFRAME)
In those dropdowns you can select candle values like open/close/high/low/ohlc4, but also some most popular indicators, which I have pre-built into this script: RSI, various Moving Averages, ADX-DMI, Stochastic and Bollinger Bands for start. You can configure parameters of those indicators also in "Settings" popup, in "Indicator Definitions" section. What's important, you can use any of these indicators from higher timeframe, setting MTF multiplier. So if you applied this indicator to 1h chart, but want to use rsi(close,14) from 4h chart, set MTF to 4. If you want to use current timeframe indicators, keep MTF at 1, which is a default setting here.
Note for coders: to keep focus of this script on joining conditions, entire logic for those indicators has been moved to external library, also open source. I encourage you to dig into the code and see how it's done. I love the addition of libraries concept in PineScript.
CUSTOM INDICATOR
Following the "openness" spirit of my master - which is TradingView itself - my work is also open, in 2 ways:
1. This script is open source. So you can grab it, modify or add any functionalities you want. I cannot and don't want to stop you from doing that. I'm asking for only one favor - please mention this source script in your credits.
2. You can import the plot (series) from any other indicator on TradingView. In Settings popup of my script, scroll down to "Indicator Definitions" section, and select the series of your choice in the first dropdown. Now it is ready to use in conditions dropdowns on top of the Settings popup.
Let me give you an example of that last scenario. Take another script of mine, "Pivot Points on SR lines DEMO". You can find it in "Indicators & Strategies" library or here: (). Attach it to your chart. Now come back to THIS script, open Settings popup and in "Custom Indicator aka Imported Source" select "Pivot Points on SR lines: ...". The way it works - it detects if a pivot point happened on Support/Resistance line from the past and returns 1 for PivotLow and -1 for Pivot High. Now in first Long Entry condition set: "custom indicator" + "Greater Than" + "value" + "0" and long entries will be marked on every pivot low noticed on Support/Resistance line.
ALERTS
Last but not least - the alerts. This script produces alerts on the entries calculated by strategy logic, as marked on the chart by the backtester. Moreover, syntax of those alerts is already prepared and fully compatible with TradingConnector - alerts executing tool (bot), if you want to auto-execute those trades. Apart from installing the tool, you need to set
up the alerts in TradingView, here is how:
open CreateAlert popup
in first dropdown select "Joint Conditions Strategy Template"
in second dropdown select "alert() function calls only"
And that's all. You only need to set one alert for the whole script, not one for Longs and one for Shorts as it was in the past. Also, you don't need to setup closing alerts, because stop-loss/take-profit/trailing-stop information is embedded in the entry alert so your broker receives it as early as possible. Alerts sent will look like this: "long sl=40 tp=80", which is exactly what TradingConnector expects.
Phew, that's all folks. If you think I should add something to this template (maybe other indicators?) please let me know in comments or via DM. Happy trading!
P.S. Pyramiding is not supported in this script.
Disclaimer : I'm not saying above combination of conditions will make you money. Actually none of this can be considered financial advice. It is only a software tool. Use it wisely, be aware of the risk and do your own research!

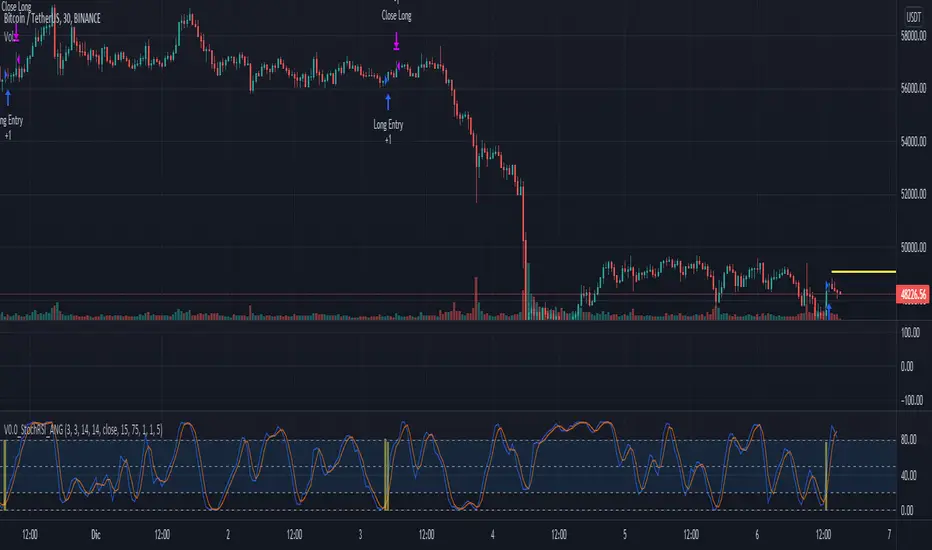
V0.0_StochRSI_ANGTEST 2, en busca de algo nuevo que pueda encontrar puntos de entrada de compra y venta al 1%
robotrading ZeroCCIIt was not me who authored the strategy. I do not know who the real author of this strategy is. I read about it on wikipedia :) And decided to test the strategy on the cryptocurrency market. It turned out that this strategy really works. The strategy is very simple.
Indicator
CCI indicator with default settings is used. The settings can be changed. Nothing else is used.
Strategy
If CCI is more than 0, then open a long position (and close a short position).
If CCI is less than 0, then open a short position (and close a long position).
Reverse trading.

[Fedra Algotrading Strategy Trailing Stop Version]Simpler version of my popular strategy.Optimized for cryptocurrencies. Originally conceived to trade automatically through bots (that's how I use it), it also works to get signals and trade manually in any exchange.
It works in spot.
Buy the dip:
Attempts to buy on the dip, finding entries when the price makes abrupt dips that break deviation of the linear regression of the last periods.
Trend Detection:
Determines whether the market is in an uptrend or downtrend by crossing 2 SMAs + super trend in different temporalities. This affects the performance of the strategy. It works as a filter to avoid making entries in a downtrend.
% Trailing Stop Loss. The Stop Loss is placed a % below the price and accompanies it in the rises to make the most of an uptrend.
Optionally, you can set up a percentage Take Profit
It allows you to easily configure the backtest period to optimize the parameters for consistent results.
The strategy calculates by default a commission of 0.1% on each trade to make the backtest more "pessimistic".
Includes advanced features for compatibility with different bots platforms in the market.
Risk management by % of equity or by maximum series of losses.
////////////////////////////
Versión más simple de mi popular estrategia, optimizada para criptomonedas. Originalmente concebida para operar automáticamente a través de bots (así es como la uso yo), también funciona para obtener señales y operar manualmente en cualquier exchange.
Funciona en spot.
Compra en la caída:
Intenta comprar en la caída, encontrando entradas cuando el precio hace caídas abruptas que rompen la desviación de la regresión lineal de los últimos períodos.
Detección de tendencia:
Determina si el mercado está en tendencia alcista o bajista mediante el cruce de 2 SMAs + super trend en diferentes temporalidades. Esto afecta al rendimiento de la estrategia. Funciona como un filtro para evitar hacer entradas en contra de la tendencia del mercado.
% Trailing Stop Loss. El Stop Loss se coloca un % por debajo del precio y lo acompaña en las subidas para aprovechar una tendencia alcista.
Opcionalmente, se puede establecer un porcentaje de Take Profit
Permite configurar fácilmente el periodo de backtest para optimizar los parámetros y obtener resultados consistentes.
La estrategia calcula por defecto una comisión del 0,1% en cada operación para que el backtest sea más "pesimista".
Incluye características avanzadas para la compatibilidad con diferentes plataformas de bots en el mercado.
Gestión del riesgo por % del capital o por serie máxima de pérdidas.

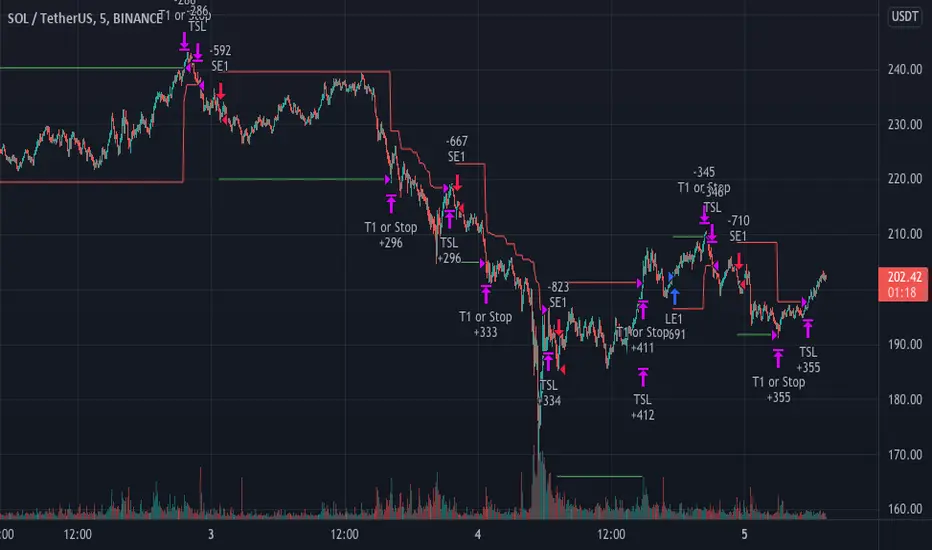
The MACDMI T/SLThis is a combined MACD and DMI strategy script with multiple options for targets and stoploss.
Stoploss and targets sizes are ATR based calculations.
Each of these contains a sets an initial ATR based that will close the entire position if hit. From there, differences between them are as follows:
Trailing stop - immediately begins trailing stoploss from your entry. Entire position is closed when hit.
Single Target - closes entire position once target is hit
T1 + Trail - closes half of the position when first target is hit and then begins trailing stop on the remaining position.
T1 + Trail/T2 + Trail - closes a third of the position at T1 and begins trailing a stop on the rest. Will close another third at T2, continue the trailing stop, and close the final third when the stop is hit.
Linear trendSimple way how to use Linear Regression for trading.
What we use:
• Linear Regression
• EMA 200 as a trend filter
Logic:
Firstly we make two different linear regression movings as oscillator. For this we need to subtract slow moving from fast moving, so we get the single moving around zero. This is the green/red line which appears on the chart.
The trade open when LR cross over the threshold. The trade close when LR cross under the threshold below. Crossing over the threshold is the same as faster moving cross over slower moving.
Also we use EMA as a filter. The trades would be only when the price is over than EMA 200.

AlphaPrime - Backtest AlphaPrime - Backtest AlphaPrime - BacktestAlphaPrime - BacktestAlphaPrime - BacktestAlphaPrime - Backtest

P-Signal Strategy & AlertThanks to your advices I removed in this version something that was not necessary for the strategy but added alert and the chart of the current state of the strategy (white 1 - in trade, 0 - out of trade).

01 BB RSI MACD with built-in webhookThis strategy is intended for use as a way of backtesting various parameters available on 3commas.
Using MACD to sell order (original script take profit by scale)
Using RSI to analyze the market conditions.
.
.
// USER INPUTS
Short MA Window - The length of the Short moving average
Long MA Window - The length of the Long moving average
Upper Band Offset - The offset to use for the upper bollinger offset
Lower Band Offset - The offset to use for the lower bollinger offset
Long Stop Loss % - The stop loss percentage to test
Long Take Profit % - The Take profit percentage to test
Initial SO Deviation % - The price deviation percentage required to place to first safety order
Safety Order Vol Step % - The volume scale to test
Input to link with 3comma to automate your bot
3Commas Bot ID -
Bot Email Token - Found in the deal start message for your bot
3Commas Bot Trading Pair - The pair to include for composite bot start deals
when you create alert you need to write {{strategy.order.alert_message}} in the message box.
.
.
Original script:
1. 3Commas Bollinger Strategy by tedwardd
.
.
Suggestion use with trending pair, SAND, MANA and many altcoin in low tf
P-Signal Strategy (BTCUSD Multi Frame)This is an example of constructing P-Signal strategy on a set of probability spaces. In this case, the daily weekly and monthly time frames are used. Please note that the parameters for each of the spaces (the number of bars in the gear) are different.

Instrument-Z (3Commas Bot)Instrument-Z is what I am currently using as my 3Commas Bot.
It allows you to customize signals from 3 indicators; Crossing MA's, Stochastic RSI, and WaveTrend.
Better yet, it allows you to setup these signals separately depending on whether the Trend MA is going up or down.
So there are 2 sets of inputs for everything, Uptrend inputs and Downtrend inputs.
I have realized that we can't expect a strategy to work the same way in an uptrend vs downtrend, so the inputs should be separated too.
In my testing, separating increased the net profit by 60% on average.
You can select whether you are trading Long or Short.
You can choose your stop loss and take profit levels as well as trade expiration.
You can choose if you only want to trade with the trend (making the opposing signals irrelevant).
The trend is based on the Trend MA.
This script is specifically for cryptocurrencies.
I've noticed that MA crosses on other asset classes are unreliable because the fluctuations are not strong enough to push the MA's across each other in a meaningful way.
If you want to use this as a 3Commas Bot, then you will have to copy the code of the strategy and paste it into your own personal script.
Then you have to change the alert messages at the bottom of the script.
Make sure to change your alert message from this;
{"message_type": "bot", "bot_id": 0000000, "email_token": "0b000a0a-0aa0-00aa-0aa0-000a00000a0a", "delay_seconds": 0}
To this;
{ \"message_type\": \"bot\", \"bot_id\": 0000000, \"email_token\": \"0a000a0a-0aa0-00aa-0aa0-000a00000a0a\", \"delay_seconds\": 0 }
With after each new line and \ before each quotation.
In the Alert setup, select "alert() function calls only".
This indicator is like a middle ground of complexity between the Juicy Trend indicator and the Instrument-A indicator.
And because it does not feature my neural network project, I have made it open script.
Enjoy!

Flip a CoinHave you ever wanted a strategy that is completely random? Well here's the Flip-a-Coin strategy that has entirely random and unpredictable trades! With the randomiser to make it a truly unique strategy to you, and the ability to add martingale logic to the risk means you could either be making millions or losing it all in no time! Please do not trade with this! At best it is a good baseline for testing if your own strategy is better or worse than literally flipping a coin. Enjoy!

P-Signal StrategyThis is an example of building a trading strategy based on a p-signal. The p-signal indicates the entropy of the state of the D frame system for the BTCUSD pair in the Kolmogorov probability space.

Combo Backtest 123 Reversal & TEMA1This is combo strategies for get a cumulative signal.
First strategy
This System was created from the Book "How I Tripled My Money In The
Futures Market" by Ulf Jensen, Page 183. This is reverse type of strategies.
The strategy buys at market, if close price is higher than the previous close
during 2 days and the meaning of 9-days Stochastic Slow Oscillator is lower than 50.
The strategy sells at market, if close price is lower than the previous close price
during 2 days and the meaning of 9-days Stochastic Fast Oscillator is higher than 50.
Second strategy
This study plots the TEMA1 indicator. TEMA1 ia s triple MA (Moving Average),
and is calculated as 3*MA - (3*MA(MA)) + (MA(MA(MA)))
WARNING:
- For purpose educate only
- This script to change bars colors.
SSL-Extendido-Estrategia por Neil--
DESCRIPTION
SSL Strategy with ATR, Volume, ADX, TakeProfit, Profit Cycle Indicator and Extended Trend Control.
The component is based on moving averages, its effectiveness is greater in long periods: 4H, 1D, 1S
HOW DOES IT WORK
The component works with a fluctuation band in which the price moves, it consists of an upper moving average of 10 periods and a lower moving average of 8 periods, both configurable according to the volatility of the asset. Since the band has little width, prices trigger buy and sell alerts frequently, but the component has a trend control based on SMA, EMA, VWAP, HMA that allows to take advantage of the intermediate trend of the asset and cancel the early buy alerts and sale, maximizing the development of the parabola, additionally the component allows to confirm the entries with indicators such as: ATR (valatility), Volume and ADX (direction strength), this to achieve entries with a greater probability of success.
WHY USE IT
Its configuration is simple, it requires adjusting few parameters and although it is ideal for long-term operations, it allows periodic take profit, under the philosophy of profit evaluation at present point and not profit evaluation at future point, ensuring income in less time. additionally it has a visual profit indicator, which allows you to graphically see if a money generation cycle (buy or sell) is a winner or a loser, it also allows you to operate according to the general trend of the asset, that is, you can adjust the behavior of the resource to carry out purchase and sale operations or only purchase or only sale. This component not only graphically indicates when to take profit (takeProfit), but it is responsible for closing the current operation and opening a new operation in the same direction. This is the ideal resource for automated alert-based trading against platforms such as 3Commas.
HOW TO USE IT
Press the "Indicators" option, go to the "Public Library" segment, write the name "SSL-Extendido-Estrategia por Neil", double-click on the record and it will be added to your work panel, now, all that remains is to configure its parameters and use it. By pressing the Reset Values Option, you will have a basic configuration that respects the fundamental concepts of trading and the use of multiple indicators in a single study.
--
DESCRIPCIÓN
Estrategia SSL con ATR, Volume, ADX, TakeProfit, indicador de ciclo de ganancia y control de tendencia extendida.
El componente se basa en medias moviles, su efectividad es mayor en temporalidades largas: 4H,1D,1S
COMO FUNCIONA
El componente trabaja con una banda de fluctuación en la que se mueve el precio, consta de una media movil superior de 10 periodos y una media movil inferior de 8 periodos, ambas configurables segun la volatilidad del activo. Dado que la banda tiene poca amplitud, los precios gatillan alertas de compra y venta frecuentemente, pero el componente posee un control de tendencia basado en SMA, EMA, VWAP, HMA que permite aprovechar la tendencia intermedia del activo y anular las alertas tempranas de compra y venta, maximizando el dearrollo de la parabola, adicionalmente el componente permite confirmar las entradas con indicadores como: ATR (valatilidad), Volumen y ADX (fuerza de la dirección), esto para lograr entradas con mayor probabilidad de exito.
POR QUÉ USARLO
Su configuración es simple, requiere ajustar pocos parametros y aunque es ideal para operaciones de temporalidad larga, permite efectuar take profit periodicos, bajo la filosofía de evaluación de ganancia a punto presente y no evaluación de ganancia a punto futuro, asegurando ingresos en menor tiempo, adicionalmente posee un idicador de ganancia visual, que permite ver graficamente si un ciclo de generación de dinero (compra o venta) es ganador o perdedor, tambien permite operar segun la tendencia general del activo, es decir que usted puede ajustar el comportamiento del recurso para efectuar operaciones de compra y venta o solo compra o solo venta. Este componente no solo indica gráficamente cuando tomar ganancias (takeProfit), sino que se encarga de cerrar la operación en curso y abrir una nueva operación en la misma dirección. Este es el recurso ideal para efectuar trading automatizado basado en alertas, contra plataformas como 3Commas.
COMO USARLO
Presione la opción "Indicadores", ubíquese en el segmento "Libreria Publica", escriba el nombre "SSL-Extendido-Estrategia por Neil", haga doble clic sobre el registro y lo tendrá agregado en su panel de trabajo, ahora, solo resta configurar sus parámetros y usarlo. Presionando la opción Reestablecer Valores, ya tendrá una configuración básica que respeta los conceptos fundamentales del trading y el uso de múltiple de indicadores un un solo estudio.

[cache_that_pass] 1m 15m Function - Weighted Standard DeviationTradingview Community,
As I progress through my journey, I have come to the realization that it is time to give back. This script isn't a life changer, but it has the building blocks for a motivated individual to optimize the parameters and have a production script ready to go.
Credit for the indicator is due to @rumpypumpydumpy
I adapted this indicator to a strategy for crypto markets. 15 minute time frame has worked best for me.
It is a standard deviation script that has 3 important user configured parameters. These 3 things are what the end user should tweak for optimum returns. They are....
1) Lookback Length - I have had luck with it set to 20, but any value from 1-1000 it will accept.
2) stopPer - Stop Loss percentage of each trade
3) takePer - Take Profit percentage of each trade
2 and 3 above are where you will see significant changes in returns by altering them and trying different percentages. An experienced pinescript programmer can take this and build on it even more. If you do, I ask that you please share the script with the community in an open-source fashion.
It also already accounts for the commission percentage of 0.075% that Binance.US uses for people who pay fees with BNB.
How it works...
It calculates a weighted standard deviation of the price for the lookback period set (so 20 candles is default). It recalculates each time a new candle is printed. It trades when price lows crossunder the bottom of that deviation channel, and sells when price highs crossover the top of that deviation channel. It works best in mid to long term sideways channels / Wyckoff accumulation periods.

[Fedra Algotrading Strategy Futures Signals]Linear Regression + Take Profit and Percentage Stop Loss
Optimize the parameters in backtesting to find the best entries, define your profit and risk strategy, take advantage of statistics and make trades without letting the psychological factor make you commit mistakes.
The strategy chooses the time to buy when the price breaks down the deviation of the linear regression calculated on the basis of the last lows prices and allows you to generate alerts.
It also includes an emergency exit at Break Even (1.5%) when it detects a negative trend in the short term.
It also has an advanced trend filter to avoid opening trades against the market.
*************************************
Regresión lineal + Take Profit y Stop loss porcentual
Optimice los parámetros en backtesting para encontrar las mejores entradas, defina su estrategia de profit y riesgo, apreveche las estadísticas y haga operaciones son dejar que el factor psicológico le haga cometer errores.
La estrategia elige el momento de compra cuando el precio rompe hacia abajo la desviación de la regresión lineal calculada en base a lows últimos precios y permite generar alertas.
También incluye una salida de emergencia en Break Even (1.5%) cuando detecta una tendencia negativa en el corto plazo.
Tiene también un filtro avanzado de tendencia para no abrir operaciones en contra del mercado.
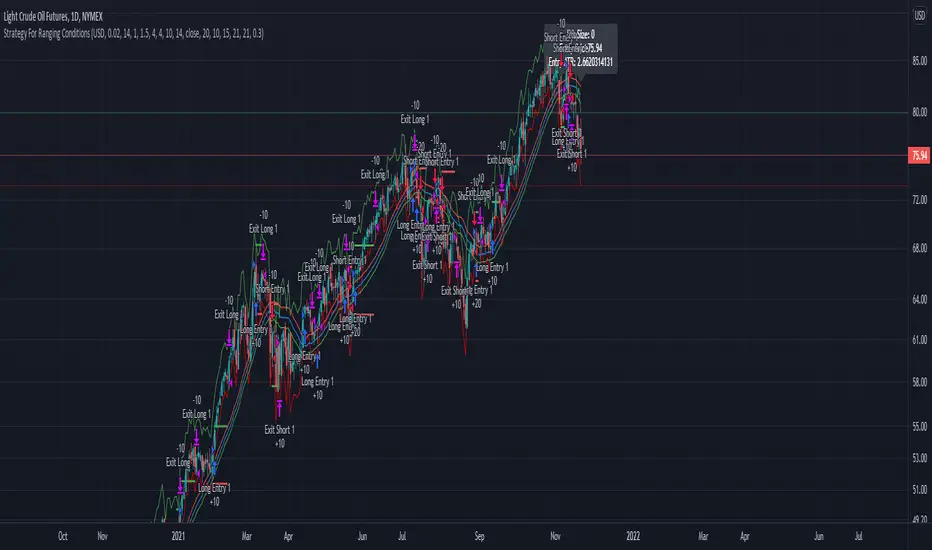
Strategy For Ranging ConditionsThis is a Trading strategy that uses a stochastic indicator in order to place buy and sell positions while using an exponential moving average as a filter. This is great for assets that normally move within a range and helps to keep one out of reversals or out of the grasps of crashes downwards and its loss of appreciation gained due to price takers. A lot of trades are taken but they are normally exited quickly due to this strategy's nature. Again diligence will be needed to know if one should apply this to their current asset being looked at or add it to a set of different trading strategies in your arsenal. Take a deep look at the condition your asset is in whether it be ranging or trending and use this strategy as one deems fit.