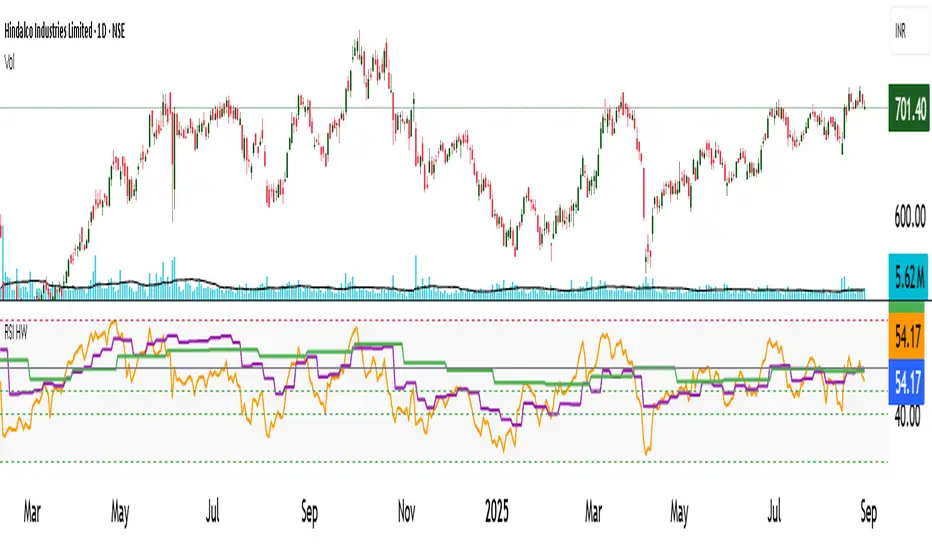
RSI Oscillator fxdealBased on the Pine Script code you provided, here is a detailed description of the indicator's features and functionality.
Indicator Overview
This is the Heikin Ashi RSI Oscillator (HARSI), a custom-built indicator for TradingView. It combines the principles of Heikin Ashi candles and the Relative Strength Index (RSI) to provide a smoothed, trend-focused oscillator in a separate pane below the main chart. The indicator visualizes trend strength, overbought/oversold conditions, and momentum changes using a series of configurable plots and lines.
Key Components and Features
Heikin Ashi RSI Candles: This is the core component. Instead of traditional price data, the indicator uses a custom Heikin Ashi calculation applied to the RSI values. This creates a smoothed, momentum-driven "candle" visualization that filters out market noise, making it easier to identify the direction and strength of the trend. The color of these candles changes to reflect bullish (teal) or bearish (red) momentum.
RSI Plot & Histogram: The indicator includes a standard RSI line plot and an optional histogram. The RSI can be displayed in "Smoothed Mode," which applies a Heikin Ashi-like smoothing to the RSI line itself to reduce volatility and improve trend identification. The histogram visually represents the RSI's value, with its height corresponding to the magnitude of the RSI.
Stochastic RSI: An optional Stochastic RSI is included to provide a different perspective on momentum. This is a "momentum of momentum" indicator that can be used for confirming trend changes or identifying overbought/oversold conditions within the RSI's own range. It can be plotted as either a ribbon (showing the K and D lines filled) or as individual lines.
Bollinger Bands (Stepline Style): The indicator overlays Bollinger Bands on the RSI. These bands adapt to the volatility of the RSI, providing dynamic overbought and oversold levels. The middle band is a simple moving average of the RSI. The upper and lower bands are plotted using a stepline style, giving them a distinct, staggered appearance.
Horizontal Lines: Several fixed horizontal lines are plotted to define key zones:
Overbought/Oversold (OB/OS) Zones: Customizable horizontal lines define overbought and oversold regions, with additional lines for "extreme" levels. These are based on the indicator's zero-median scale.
Traditional RSI Levels: Optional dotted horizontal lines at 70, 50, and 30 help users who are accustomed to traditional RSI readings quickly identify overbought, neutral, and oversold conditions.
M-oscillator

Dual Stochastic with Trend FilterThe "Dual Stochastic with Trend Filter" is an oscillator indicator designed to provide clearer, trend-aligned trading signals. It uses two distinct stochastic oscillators to identify potential entry points and incorporates an optional EMA-based trend filter to ensure that you are trading in the direction of the broader market momentum.
How It Works and How to Use It
This indicator combines two key technical analysis concepts: momentum (via stochastics) and trend (via moving averages).
Core Components:
Dual Stochastic Oscillators:
Signal Line 1 (Blue): A standard stochastic oscillator.
Signal Line 2 (Red): A second stochastic oscillator, often using a different source (like hlcc4) to provide a smoother, more reliable signal.
A buy signal is generated when the Blue Line (d1) crosses above the Red Line (d2).
A sell signal is generated when the Blue Line (d1) crosses below the Red Line (d2).
Trend Filter (Optional):
This feature uses a fast and a slow Exponential Moving Average (EMA) to determine the overall market trend.
When the fast EMA is above the slow EMA, the background will turn green, indicating an uptrend.
When the fast EMA is below the slow EMA, the background will turn red, indicating a downtrend.
This filter can be toggled on or off in the indicator settings.
How to Use:
With Trend Filter Enabled (Recommended):
Long (Buy) Entry: Look for a green triangle buy signal (▲). This signal only appears when:
The Blue Signal Line crosses above the Red Signal Line.
The market is in a confirmed uptrend (green background).
Short (Sell) Entry: Look for a red triangle sell signal (▼). This signal only appears when:
The Blue Signal Line crosses below the Red Signal Line.
The market is in a confirmed downtrend (red background).
Exit Signal:
A yellow circle (●) appears to suggest closing an open trade. This signal is triggered for a long position if either the stochastics have a bearish cross or the trend flips to a downtrend. Conversely, for a short position, it's triggered by a bullish stochastic cross or a trend flip to an uptrend.
With Trend Filter Disabled:
If you turn off the "Use Trend Filter" option, the indicator will function as a simple dual stochastic crossover system.
A green triangle (▲) will appear every time the Blue Line crosses above the Red Line.
A red triangle (▼) will appear every time the Blue Line crosses below the Red Line.
The background coloring and exit signals based on trend flips will be deactivated. This mode is more sensitive but may produce more false signals in choppy markets.
Key Visuals:
Blue Line: The primary signal line.
Red Line: The secondary, often smoother, signal line.
Green Triangle (▲): Bullish entry signal.
Red Triangle (▼): Bearish entry signal.
Yellow Circle (●): Suggested trade exit/stop.
Green/Red Background: Visual confirmation of the current uptrend or downtrend.
By filtering stochastic signals with the dominant trend, this indicator helps traders avoid common pitfalls like entering short positions during a strong uptrend or buying into a bearish market. This alignment of momentum and trend is key to improving signal quality.
Disclaimer
This indicator is provided for educational and informational purposes only and should not be considered as financial advice or a recommendation to buy or sell any asset. All trading and investment decisions are your own sole responsibility.
Trading financial markets involves a high level of risk, and you may lose more than your initial investment. Past performance is not indicative of future results. The signals generated by this indicator are not guaranteed to be accurate, and you should always use this tool in conjunction with other forms of analysis and sound risk management practices.
Before using this indicator in a live trading environment, it is strongly recommended that you backtest it thoroughly and practice with it on a demo account. The author is not responsible for any financial losses you may incur from using this script.

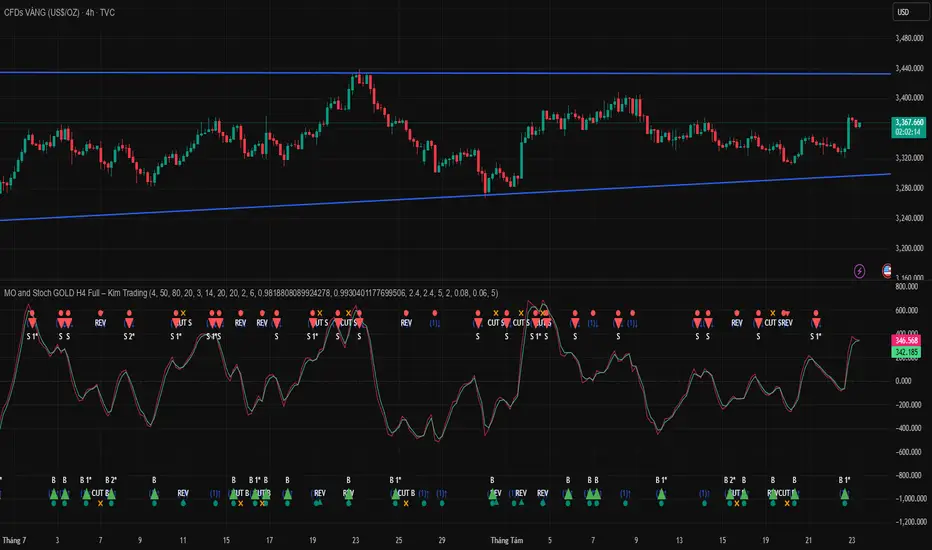
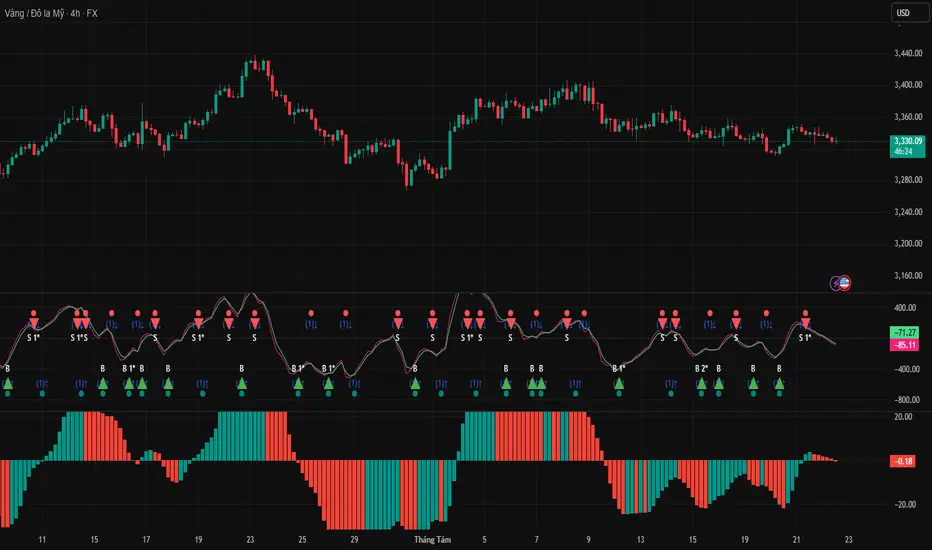
MO and Stoch GOLD H4 Full – Kim TradingMO and Stoch GOLD H4 Full – Kim Trading
Slogan: “Trading Is a Profession, Trading Is Life”
Market: XAUUSD • Timeframe: H4
Regime Gate (strong-trend filter) – turn on to suppress noise during strong trends; trade-off: you may miss some opportunities.
Cut & Reverse – use when you prefer to disable the strong-trend filter and react fast (cut the losing side and reverse with the new signal).
Entry/Exit Rules. When B/B1★/B2★/B3★ (buy) or S/S1★/S2★/S3★ (sell) labels appear, follow the prevailing trend and consider DCA (scale-in) with the trend. Combine with other confluences (levels, candlesticks, volume, timing) to form an optimal setup.
Signal Confidence Tiers:
B — S
B1★ — S1★
B2★ — S2★
B3★ — S3★
Enter only when one of the four labels appears. Use Alerts → Once Per Bar Close.
Notes. Educational tool, not financial advice. Source code remains Protected.
Author: Kim Trading • Version: V1 • Date: 2025-08-25
#XAUUSD #Gold #H4 #MO #Stoch #KimTrading
DK RSI [NMTUAN]The RSI Lines in RSI DK
A basic RSI DK indicator typically consists of the following components:
The Main RSI Line: Usually set to a period of 14, this is the most common line for most traders. It provides an overall view of market momentum.
The Short-Term RSI Line: Usually set to a period of 7, 5, or even 3. This line moves faster and is more sensitive to short-term fluctuations. It can be used to identify early entry/exit points.
The Long-Term RSI Line: Typically set to a period of 21, 28, or 30. This line moves more slowly, providing a stable view of the long-term trend. It helps filter out "noise" and confirm the main trend.
How to Use RSI DK
Combining multiple RSI lines offers several advantages:
Signal Confirmation: When different RSI lines confirm a signal (e.g., all are in the overbought or oversold zone), the reliability of that signal increases significantly.
Divergence: This is one of the strongest signals of the RSI. With RSI DK, traders can easily spot potential divergence signals when a short-term RSI line diverges from price, while the long-term RSI line is still confirming the trend.
Crossovers: Similar to other momentum indicators, crossovers between RSI lines in RSI DK are also very useful. For example, when the short-term RSI line crosses above the long-term one, it could be a signal that upward momentum is gaining strength.
Multi-Timeframe Analysis: RSI DK lets you analyze momentum across different timeframes right on one chart, which saves time and improves analysis efficiency.

MO and Stoch GOLD H4 V1 – Kim Trading (with Regime Gate ML)MO and Stoch GOLD H4 – Kim Trading (with Regime Gate ML)
Slogan: “Trading Is a Profession, Trading Is Life”
Market: XAUUSD (spot gold) • Timeframe: H4 (4 hours)
Overview. The script combines a Momentum Oscillator (MO) cross with Stochastic RSI context and evaluates signals on bar close to reduce repaint. An optional Regime Gate (ML) filter classifies market conditions (e.g., strong-trend vs. choppy) from historical patterns to suppress counter-trend noise and highlight powerful waves.
Entry/Exit Rules
When a B, B1★ … (buy) or S, S1★ … (sell) label appears, first reference the prevailing trend and consider applying DCA (scale-in) in the direction of that trend. You’re encouraged to combine this tool with other methods (price levels, candlesticks, volume/timing) to build an optimal setup.
Signal Confidence Tiers
B — S
B1★ — S1★
B2★ — S2★
B3★ — S3★
Enter trades only when one of the four signal types above is printed.
Notes. Use Once Per Bar Close alerts. This is an educational tool and not financial advice. Source code remains protected.
Author: Kim Trading • Version: V1 • Date: 2025-08-25
#XAUUSD #Gold #H4 #MO #Stoch #KimTrading

BTC Dominance & Price RSI Analyzer by Sajad BagheriThis indicator analyzes the Relative Strength Index (RSI) for three key cryptocurrency metrics:
Bitcoin Price (BTC/USDT)
Bitcoin Dominance (BTC.D)
Tether Dominance (USDT.D)
It provides a comprehensive view of market momentum by displaying three RSI lines in a single pane, allowing traders to identify overbought and oversold conditions across these important metrics simultaneously.
Constance Brown Composite Index EnhancedWhat This Indicator Does
Implements Constance Brown's copyrighted Composite Index formula (1996) from her Master's thesis - a breakthrough oscillator that solves the critical problem where RSI fails to show divergences in long-horizon trends, providing early warning signals for major market reversals.
The Problem It Solves
Traditional RSI frequently fails to display divergence signals in Global Equity Indexes and long-term charts, leaving asset managers without warning of major price reversals. Brown's research showed RSI failed to provide divergence signals 42 times across major markets - failures that would have been "extremely costly for asset managers."
Key Components
Composite Line: RSI Momentum (9-period) + Smoothed RSI Average - the core breakthrough formula
Fast/Slow Moving Averages: Trend direction confirmation (13/33 periods default)
Bollinger Bands: Volatility envelope around the composite signal
Enhanced Divergence Detection: Significantly improved trend reversal timing vs standard RSI
Research-Proven Performance
Based on Brown's extensive study across 6 major markets (1919-2015):
42 divergence signals triggered where RSI showed none
33 signals passed with meaningful reversals (78% success rate)
Only 5 failures - exceptional performance in monthly/2-month timeframes
Tested on: German DAX, French CAC 40, Shanghai Composite, Dow Jones, US/Japanese Government Bonds
New Customization Features
Moving Average Types: Choose SMA or EMA for fast/slow lines
Optional Fills: Toggle composite and Bollinger band fills on/off
All Periods Adjustable: RSI length, momentum, smoothing periods
Visual Styling: Customize colors and line widths in Style tab
Default Settings (Original Formula)
RSI Length: 14
RSI Momentum: 9 periods
RSI MA Length: 3
SMA Length: 3
Fast SMA: 13, Slow SMA: 33
Bollinger STD: 2.0
Applications
Long-term investing: Monthly/2-month charts for major trend changes
Elliott Wave analysis: Maximum displacement at 3rd-of-3rd waves, divergence at 5th waves
Multi-timeframe: Pairs well with MACD, works across all timeframes
Global markets: Proven effective on equities, bonds, currencies, commodities
Perfect for serious traders and asset managers seeking the proven mathematical edge that traditional RSI cannot provide.

Relative Weighted Rate of Change (WROC) vs Nifty 50Relative Weighted Rate of Change (WROC) vs Nifty 50

Donchian Squeeze Oscillator# Donchian Squeeze Oscillator (DSO) - User Guide
## Overview
The Donchian Squeeze Oscillator is a technical indicator designed to identify periods of low volatility (squeeze) and high volatility (expansion) in financial markets by measuring the distance between Donchian Channel bands. The indicator normalizes this measurement to a 0-100 scale, making it easy to interpret across different timeframes and instruments.
## How It Works
The DSO calculates the width of Donchian Channels as a percentage of the middle line, smooths this data, and then normalizes it using historical highs and lows over a specified lookback period. The result is inverted so that:
- **High values (80+)** = Narrow channels = Low volatility = Squeeze
- **Low values (20-)** = Wide channels = High volatility = Expansion
## Key Parameters
### Core Settings
- **Donchian Channel Period (20)**: The number of bars used to calculate the highest high and lowest low for the Donchian Channels
- **Smoothing Period (5)**: Applies moving average smoothing to reduce noise in the oscillator
- **Normalization Lookback (200)**: Historical period used to normalize the oscillator between 0-100
### Threshold Levels
- **Over Squeeze (80)**: Values above this level indicate strong squeeze conditions
- **Over Expansion (20)**: Values below this level indicate strong expansion conditions
## Reading the Indicator
### Color Coding
- **Red Line**: Squeeze condition (above 80 threshold) - Markets are consolidating
- **Orange Line**: Neutral/trending condition with upward momentum
- **Green Line**: Expansion condition or downward momentum
### Visual Elements
- **Red Dashed Line (80)**: Squeeze threshold - potential breakout zone
- **Gray Dotted Line (50)**: Middle line - neutral zone
- **Green Dashed Line (20)**: Expansion threshold - high volatility zone
- **Red Background**: Highlights active squeeze periods
## Trading Applications
### 1. Breakout Trading
- **Setup**: Wait for DSO to reach 80+ (squeeze zone)
- **Entry**: Look for breakouts when DSO starts declining from squeeze levels
- **Logic**: Prolonged low volatility often precedes significant price movements
### 2. Volatility Cycle Trading
- **Squeeze Phase**: DSO > 80 - Prepare for potential breakout
- **Breakout Phase**: DSO declining from 80 - Trade the direction of breakout
- **Expansion Phase**: DSO < 20 - Expect trend continuation or reversal
### 3. Trend Confirmation
- **Orange Color**: Suggests bullish momentum during expansion
- **Green Color**: Suggests bearish momentum or consolidation
- Use in conjunction with price action for trend confirmation
## Best Practices
### Timeframe Selection
- **Higher Timeframes (Daily, 4H)**: More reliable signals, fewer false breakouts
- **Lower Timeframes (1H, 15M)**: More frequent signals but higher noise
- **Multi-timeframe Analysis**: Confirm squeeze on higher TF, enter on lower TF
### Parameter Optimization
- **Volatile Markets**: Increase Donchian period (25-30) and smoothing (7-10)
- **Range-bound Markets**: Decrease Donchian period (15-20) for more sensitivity
- **Trending Markets**: Use longer normalization lookback (300-400)
### Signal Confirmation
Always combine DSO signals with:
- **Price Action**: Support/resistance levels, chart patterns
- **Volume**: Confirm breakouts with increasing volume
- **Other Indicators**: RSI, MACD, or momentum oscillators
## Alert System
The indicator includes built-in alerts for:
- **Squeeze Started**: When DSO crosses above the squeeze threshold
- **Expansion Started**: When DSO crosses below the expansion threshold
## Common Pitfalls to Avoid
1. **False Breakouts**: Don't trade every squeeze - wait for confirmation
2. **Parameter Over-optimization**: Stick to default settings initially
3. **Ignoring Market Context**: Consider overall market conditions and news
4. **Single Indicator Reliance**: Always use additional confirmation tools
## Advanced Tips
- Monitor squeeze duration - longer squeezes often lead to bigger moves
- Look for squeeze patterns at key support/resistance levels
- Use DSO divergences with price for potential reversal signals
- Combine with Bollinger Band squeezes for enhanced accuracy
## Conclusion
The Donchian Squeeze Oscillator is a powerful tool for identifying volatility cycles and potential breakout opportunities. Like all technical indicators, it should be used as part of a comprehensive trading strategy rather than as a standalone signal generator. Practice with the indicator on historical data before implementing it in live trading to understand its behavior in different market conditions.

EMA Oscillator [Alpha Extract]A precision mean reversion analysis tool that combines advanced Z-score methodology with dual threshold systems to identify extreme price deviations from trend equilibrium. Utilizing sophisticated statistical normalization and adaptive percentage-based thresholds, this indicator provides high-probability reversal signals based on standard deviation analysis and dynamic range calculations with institutional-grade accuracy for systematic counter-trend trading opportunities.
🔶 Advanced Statistical Normalization
Calculates normalized distance between price and exponential moving average using rolling standard deviation methodology for consistent interpretation across timeframes. The system applies Z-score transformation to quantify price displacement significance, ensuring statistical validity regardless of market volatility conditions.
// Core EMA and Oscillator Calculation
ema_values = ta.ema(close, ema_period)
oscillator_values = close - ema_values
rolling_std = ta.stdev(oscillator_values, ema_period)
z_score = oscillator_values / rolling_std
🔶 Dual Threshold System
Implements both statistical significance thresholds (±1σ, ±2σ, ±3σ) and percentage-based dynamic thresholds calculated from recent oscillator range extremes. This hybrid approach ensures consistent probability-based signals while adapting to varying market volatility regimes and maintaining signal relevance during structural market changes.
// Statistical Thresholds
mild_threshold = 1.0 // ±1σ (68% confidence)
moderate_threshold = 2.0 // ±2σ (95% confidence)
extreme_threshold = 3.0 // ±3σ (99.7% confidence)
// Percentage-Based Dynamic Thresholds
osc_high = ta.highest(math.abs(z_score), lookback_period)
mild_pct_thresh = osc_high * (mild_pct / 100.0)
moderate_pct_thresh = osc_high * (moderate_pct / 100.0)
extreme_pct_thresh = osc_high * (extreme_pct / 100.0)
🔶 Signal Generation Framework
Triggers buy/sell alerts when Z-score crosses extreme threshold boundaries, indicating statistically significant price deviations with high mean reversion probability. The system generates continuation signals at moderate levels and reversal signals at extreme boundaries with comprehensive alert integration.
// Extreme Signal Detection
sell_signal = ta.crossover(z_score, selected_extreme)
buy_signal = ta.crossunder(z_score, -selected_extreme)
// Dynamic Color Coding
signal_color = z_score >= selected_extreme ? #ff0303 : // Extremely Overbought
z_score >= selected_moderate ? #ff6a6a : // Overbought
z_score >= selected_mild ? #b86456 : // Mildly Overbought
z_score > -selected_mild ? #a1a1a1 : // Neutral
z_score > -selected_moderate ? #01b844 : // Mildly Oversold
z_score > -selected_extreme ? #00ff66 : // Oversold
#00ff66 // Extremely Oversold
🔶 Visual Structure Analysis
Provides a six-tier color gradient system with dynamic background zones indicating mild, moderate, and extreme conditions. The histogram visualization displays Z-score intensity with threshold reference lines and zero-line equilibrium context for precise mean reversion timing.
snapshot
4H
1D
🔶 Adaptive Threshold Selection
Features intelligent threshold switching between statistical significance levels and percentage-based dynamic ranges. The percentage system automatically adjusts to current volatility conditions using configurable lookback periods, while statistical thresholds maintain consistent probability-based signal generation across market cycles.
🔶 Performance Optimization
Utilizes efficient rolling calculations with configurable EMA periods and threshold parameters for optimal performance across all timeframes. The system includes comprehensive alert functionality with customizable notification preferences and visual signal overlay options.
🔶 Market Oscillator Interpretation
Z-score > +3σ indicates statistically significant overbought conditions with high reversal probability, while Z-score < -3σ signals extreme oversold levels suitable for counter-trend entries. Moderate thresholds (±2σ) capture 95% of normal price distributions, making breaches statistically significant for systematic trading approaches.
snapshot
🔶 Intelligent Signal Management
Automatic signal filtering prevents false alerts through extreme threshold crossover requirements, while maintaining sensitivity to genuine statistical deviations. The dual threshold system provides both conservative statistical approaches and adaptive market condition responses for varying trading styles.
Why Choose EMA Oscillator ?
This indicator provides traders with statistically-grounded mean reversion analysis through sophisticated Z-score normalization methodology. By combining traditional statistical significance thresholds with adaptive percentage-based extremes, it maintains effectiveness across varying market conditions while delivering high-probability reversal signals based on quantifiable price displacement from trend equilibrium, enabling systematic counter-trend trading approaches with defined statistical confidence levels and comprehensive risk management parameters.

Reverse RSI Signals [AlgoAlpha]🟠 OVERVIEW
This script introduces the Reverse RSI Signals system, an original approach that inverts traditional RSI values back into price levels and then overlays them directly on the chart as dynamic bands. Instead of showing RSI in a subwindow, the script calculates the exact price thresholds that correspond to common RSI levels (30/70/50) and displays them as upper, lower, and midline bands. These are further enhanced with an adaptive Supertrend filter and divergence detection, allowing traders to see overbought/oversold zones translated into actionable price ranges and trend signals. The script combines concepts of RSI inversion, volatility envelopes, and divergence tracking to provide a context-driven tool for spotting reversals and regime shifts.
🟠 CONCEPTS
The script relies on inverting RSI math: by solving for the price that would yield a given RSI level, it generates real chart levels tied to oscillator conditions. These RSI-derived price bands act like support/resistance, adapting each bar as RSI changes. On top of this, a Supertrend built around the RSI midline introduces directional bias, switching regimes when the midline is breached. Regular bullish and bearish divergences are detected by comparing RSI pivots against price pivots, highlighting early reversal conditions. This layered approach means the indicator is not just RSI on price but a hybrid of oscillator translation, volatility-tracking midline envelopes, and divergence analysis.
🟠 FEATURES
Inverted RSI bands: upper (70), lower (30), and midline (50), smoothed with EMA for noise reduction.
Supertrend overlay on the RSI midline to confirm regime direction (bullish or bearish).
Gradient-filled zones between outer and inner RSI bands to visualize proximity and exhaustion.
Non-repainting bullish and bearish divergence markers plotted directly on chart highs/lows.
🟠 USAGE
Apply the indicator to any chart and use the plotted RSI price bands as adaptive support/resistance. The midline defines equilibrium, while upper and lower bands represent classic RSI thresholds translated into real price action. In bullish regimes (green candles), long trades are stronger when price approaches or bounces from the lower band; in bearish regimes (red candles), shorts are favored near the upper band. Divergence markers (▲ for bullish, ▼ for bearish) flag potential reversal points early. Traders can combine the band proximity, divergence alerts, and Supertrend context to time entries, exits, or to refine ongoing trend trades. Adjust smoothing and Supertrend ATR settings to match the volatility of the instrument being analyzed.

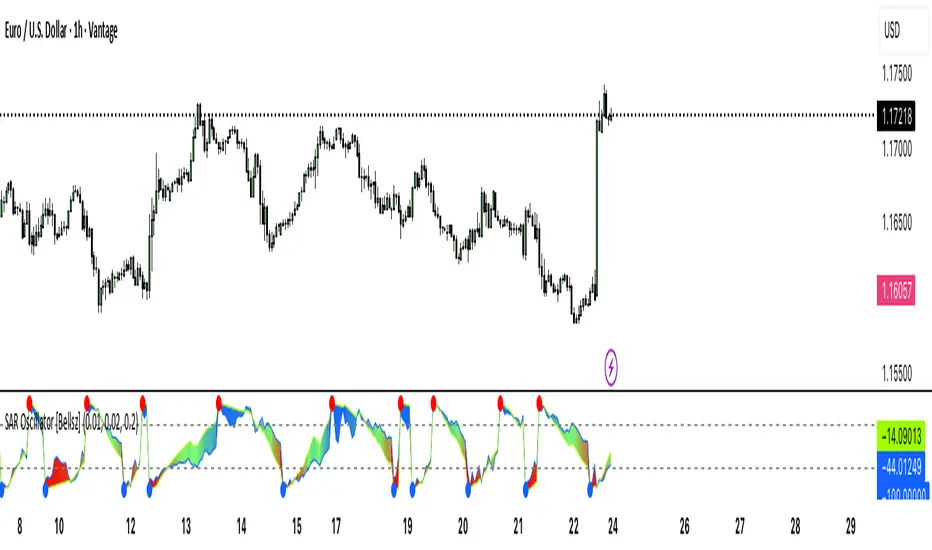
SAR Oscillator [Bellsz]Converts Parabolic SAR into a normalized oscillator with crossover signals, gradient fills, and trend strength levels. A cleaner way to read SAR momentum. Making it easier to read momentum shifts, trend strength, and reversals directly in the sub-chart. Instead of dots on price only, this tool converts SAR dynamics into a smooth oscillator that highlights bias and turning points.
What it shows
Normalized Price Line — scaled view of price relative to SAR.
Normalized SAR Line — SAR value normalized across the high/low range.
SAR Dots — visual cue when crossovers occur (potential reversal or trend acceleration).
Gradient Fill — color-coded background for quick read of momentum direction/intensity.
Guide Levels — ±50 baseline to track trend strength and overextension.
Why use it
Converts SAR into an oscillator format, easier to compare across instruments & timeframes.
Highlights momentum shifts early (crossovers, gradient flips).
Adds structure with gradient fill and baselines, making SAR more actionable than standard dot plots.
Works as a trend bias filter or confirmation tool alongside other indicators.
Inputs
Acceleration / Increment / Maximum — adjust SAR sensitivity.
Custom Colors — choose your scheme for price, SAR, and gradients.
Best practices
Use on intraday or swing TFs as a trend bias filter.
Look for Normalized Price crossing Normalized SAR as potential entry signals.
Watch how SAR dots cluster near ±100 for exhaustion or reversal signals.
Notes
This is a visual enhancement of SAR; it does not repaint.
Combine with volume, FVGs, or session models for added context.
MACD Quadrant Matrix – 10 US MajorsThis script provides a quadrant matrix visualization of the MACD indicator across 10 major U.S. stocks (AAPL, MSFT, NVDA, AMZN, GOOGL, META, TSLA, BRK.B, UNH, LLY).
It is designed as a visual screening tool to quickly analyze the relative MACD conditions of large-cap U.S. equities.
# Quadrant Logic
Q1 (Green): MACD > 0 and MACD > Signal
Q2 (Orange): MACD > 0 and MACD < Signal
Q3 (Blue): MACD < 0 and MACD > Signal
Q4 (Red): MACD < 0 and MACD < Signal
# Features
Adjustable timeframe (default: Daily)
Quadrant background visualization
Optional jitter to reduce overlap of bubbles
Tooltip display with MACD, Signal, and Delta values
Counts of how many symbols fall into each quadrant
# Limitations
Symbol list is fixed to 10 large-cap U.S. stocks (modifiable in code).
This is a visualization tool only. It does not generate buy/sell signals.
Results and quadrant positioning will vary depending on timeframe selection.
# Disclaimer
This script is for educational and analytical purposes only.
It is not financial advice, and should not be relied upon for trading or investment decisions.
Trading and investing carry risk, and users should perform their own due diligence.

ATAI Volume Pressure Analyzer V 1.0 — Pure Up/DownATAI Volume Pressure Analyzer V 1.0 — Pure Up/Down
Overview
Volume is a foundational tool for understanding the supply–demand balance. Classic charts show only total volume and don’t tell us what portion came from buying (Up) versus selling (Down). The ATAI Volume Pressure Analyzer fills that gap. Built on Pine Script v6, it scans a lower timeframe to estimate Up/Down volume for each host‑timeframe candle, and presents “volume pressure” in a compact HUD table that’s comparable across symbols and timeframes.
1) Architecture & Global Settings
Global Period (P, bars)
A single global input P defines the computation window. All measures—host‑TF volume moving averages and the half‑window segment sums—use this length. Default: 55.
Timeframe Handling
The core of the indicator is estimating Up/Down volume using lower‑timeframe data. You can set a custom lower timeframe, or rely on auto‑selection:
◉ Second charts → 1S
◉ Intraday → 1 minute
◉ Daily → 5 minutes
◉ Otherwise → 60 minutes
Lower TFs give more precise estimates but shorter history; higher TFs approximate buy/sell splits but provide longer history. As a rule of thumb, scan thin symbols at 5–15m, and liquid symbols at 1m.
2) Up/Down Volume & Derived Series
The script uses TradingView’s library function tvta.requestUpAndDownVolume(lowerTf) to obtain three values:
◉ Up volume (buyers)
◉ Down volume (sellers)
◉ Delta (Up − Down)
From these we define:
◉ TF_buy = |Up volume|
◉ TF_sell = |Down volume|
◉ TF_tot = TF_buy + TF_sell
◉ TF_delta = TF_buy − TF_sell
A positive TF_delta indicates buyer dominance; a negative value indicates selling pressure. To smooth noise, simple moving averages of TF_buy and TF_sell are computed over P and used as baselines.
3) Key Performance Indicators (KPIs)
Half‑window segmentation
To track momentum shifts, the P‑bar window is split in half:
◉ C→B: the older half
◉ B→A: the newer half (toward the current bar)
For each half, the script sums buy, sell, and delta. Comparing the two halves reveals strengthening/weakening pressure. Example: if AtoB_delta < CtoB_delta, recent buying pressure has faded.
[ 4) HUD (Table) Display /i]
Colors & Appearance
Two main color inputs define the theme: a primary color and a negative color (used when Δ is negative). The panel background uses a translucent version of the primary color; borders use the solid primary color. Text defaults to the primary color and flips to the negative color when a block’s Δ is negative.
Layout
The HUD is a 4×5 table updated on the last bar of each candle:
◉ Row 1 (Meta): indicator name, P length, lower TF, host TF
◉ Row 2 (Host TF): current ↑Buy, ↓Sell, ΔDelta; plus Σ total and SMA(↑/↓)
◉ Row 3 (Segments): C→B and B→A blocks with ↑/↓/Δ
◉ Rows 4–5: reserved for advanced modules (Wings, α/β, OB/OS, Top
5) Advanced Modules
5.1 Wings
“Wings” visualize volume‑driven movement over C→B (left wing) and B→A (right wing) with top/bottom lines and a filled band. Slopes are ATR‑per‑bar normalized for cross‑symbol/TF comparability and converted to angles (degrees). Coloring mirrors HUD sign logic with a near‑zero threshold (default ~3°):
◉ Both lines rising → blue (bullish)
◉ Both falling → red (bearish)
◉ Mixed/near‑zero → gray
Left wing reflects the origin of the recent move; right wing reflects the current state.
5.2 α / β at Point B
We compute the oriented angle between the two wings at the midpoint B:
β is the bottom‑arc angle; α = 360° − β is the top‑arc angle.
◉ Large α (>180°) or small β (<180°) flags meaningful imbalance.
◉ Intuition: large α suggests potential selling pressure; small β implies fragile support. HUD cells highlight these conditions.
5.3 OB/OS Spike
OverBought/OverSold (OB/OS) labels appear when directional volume spikes align with a 7‑oscillator vote (RSI, Stoch, %R, CCI, MFI, DeMarker, StochRSI).
◉ OB label (red): unusually high sell volume + enough OB votes
◉ OS label (teal): unusually high buy volume + enough OS votes
Minimum votes and sync window are user‑configurable; dotted connectors can link labels to the candle wick.
5.4 Top3 Volume Peaks
Within the P window the script ranks the top three BUY peaks (B1–B3) and top three SELL peaks (S1–S3).
◉ B1 and S1 are drawn as horizontal resistance (at B1 High) and support (at S1 Low) zones with adjustable thickness (ticks/percent/ATR).
◉ The HUD dedicates six cells to show ↑/↓/Δ for each rank, and prints the exact High (B1) and Low (S1) inline in their cells.
6) Reading the HUD — A Quick Checklist
◉ Meta: Confirm P and both timeframes (host & lower).
◉ Host TF block: Compare current ↑/↓/Δ against their SMAs.
◉ Segments: Contrast C→B vs B→A deltas to gauge momentum change.
◉ Wings: Right‑wing color/angle = now; left wing = recent origin.
◉ α / β: Look for α > 180° or β < 180° as imbalance cues.
◉ OB/OS: Note labels, color (red/teal), and the vote count.
◉Top3: Keep B1 (resistance) and S1 (support) on your radar.
Use these together to sketch scenarios and invalidation levels; never rely on a single signal in isolation.
[ 7) Example Highlights (What the table conveys) /i]
◉ Row 1 shows the indicator name, the analysis length P (default 55), and both TFs used for computation and display.
◉ B1 / S1 blocks summarize each side’s peak within the window, with Δ indicating buyer/seller dominance at that peak and inline price (B1 High / S1 Low) for actionable levels.
◉ Angle cells for each wing report the top/bottom line angles vs. the horizontal, reflecting the directional posture.
◉ Ranks B2/B3 and S2/S3 extend context beyond the top peak on each side.
◉ α / β cells quantify the orientation gap at B; changes reflect shifting buyer/seller influence on trend strength.
Together these visuals often reveal whether the “wings” resemble a strong, upward‑tilted arm supported by buyer volume—but always corroborate with your broader toolkit
8) Practical Tips & Tuning
◉ Choose P by market structure. For daily charts, 34–89 bars often works well.
◉ Lower TF choice: Thin symbols → 5–15m; liquid symbols → 1m.
◉ Near‑zero angle: In noisy markets, consider 5–7° instead of 3°.
◉ OB/OS votes: Daily charts often work with 3–4 votes; lower TFs may prefer 4–5.
◉ Zone thickness: Tie B1/S1 zone thickness to ATR so it scales with volatility.
◉ Colors: Feel free to theme the primary/negative colors; keep Δ<0 mapped to the negative color for readability.
Combine with price action: Use this indicator alongside structure, trendlines, and other tools for stronger decisions.
Technical Notes
Pine Script v6.
◉ Up/Down split via TradingView/ta library call requestUpAndDownVolume(lowerTf).
◉ HUD‑first design; drawings for Wings/αβ/OBOS/Top3 align with the same sign/threshold logic used in the table.
Disclaimer: This indicator is provided solely for educational and analytical purposes. It does not constitute financial advice, nor is it a recommendation to buy or sell any security. Always conduct your own research and use multiple tools before making trading decisions.

Advanced Trend Momentum [Alpha Extract]The Advanced Trend Momentum indicator provides traders with deep insights into market dynamics by combining exponential moving average analysis with RSI momentum assessment and dynamic support/resistance detection. This sophisticated multi-dimensional tool helps identify trend changes, momentum divergences, and key structural levels, offering actionable buy and sell signals based on trend strength and momentum convergence.
🔶 CALCULATION
The indicator processes market data through multiple analytical methods:
Dual EMA Analysis: Calculates fast and slow exponential moving averages with dynamic trend direction assessment and ATR-normalized strength measurement.
RSI Momentum Engine: Implements RSI-based momentum analysis with enhanced overbought/oversold detection and momentum velocity calculations.
Pivot-Based Structure: Identifies and tracks dynamic support and resistance levels using pivot point analysis with configurable level management.
Signal Integration: Combines trend direction, momentum characteristics, and structural proximity to generate high-probability trading signals.
Formula:
Fast EMA = EMA(Close, Fast Length)
Slow EMA = EMA(Close, Slow Length)
Trend Direction = Fast EMA > Slow EMA ? 1 : -1
Trend Strength = |Fast EMA - Slow EMA| / ATR(Period) × 100
RSI Momentum = RSI(Close, RSI Length)
Momentum Value = Change(Close, 5) / ATR(10) × 100
Pivot Support/Resistance = Dynamic pivot arrays with configurable lookback periods
Bullish Signal = Trend Change + Momentum Confirmation + Strength > 1%
Bearish Signal = Trend Change + Momentum Confirmation + Strength > 1%
🔶 DETAILS
Visual Features:
Trend EMAs: Fast and slow exponential moving averages with dynamic color coding (bullish/bearish)
Enhanced RSI: RSI oscillator with color-coded zones, gradient fills, and reference bands at overbought/oversold levels
Trend Fill: Dynamic gradient between EMAs indicating trend strength and direction
Support/Resistance Lines: Horizontal levels extending from pivot-based calculations with configurable maximum levels
Momentum Candles: Color-coded candlestick overlay reflecting combined trend and momentum conditions
Divergence Markers: Diamond-shaped signals highlighting bullish and bearish momentum divergences
Analysis Table: Real-time summary of trend direction, strength percentage, RSI value, and momentum reading
Interpretation:
Trend Direction: Bullish when Fast EMA crosses above Slow EMA with strength confirmation
Trend Strength > 1%: Strong trending conditions with institutional participation
RSI > 70: Overbought conditions, potential selling opportunity
RSI < 30: Oversold conditions, potential buying opportunity
Momentum Divergence: Price and momentum moving opposite directions signal potential reversals
Support/Resistance Proximity: Dynamic levels provide optimal entry/exit zones
Combined Signals: Trend changes with momentum confirmation generate high-probability opportunities
🔶 EXAMPLES
Trend Confirmation: Fast EMA crossing above Slow EMA with trend strength exceeding 1% and positive momentum confirms strong bullish conditions.
Example: During institutional accumulation phases, EMA crossovers with momentum confirmation have historically preceded significant upward moves, providing optimal long entry points.
15min
4H
Momentum Divergence Detection: RSI reaching overbought levels while momentum decreases despite rising prices signals potential trend exhaustion.
Example: Bearish divergence signals appearing at resistance levels have marked major market tops, allowing traders to secure profits before corrections.
Support/Resistance Integration: Dynamic pivot-based levels combined with trend and momentum signals create high-probability trading zones.
Example: Bullish trend changes occurring near established support levels offer optimal risk-reward entries with clearly defined stop-loss levels.
Multi-Dimensional Confirmation: The indicator's combination of trend, momentum, and structural analysis provides comprehensive market validation.
Example: When trend direction aligns with momentum characteristics near key structural levels, the confluence creates institutional-grade trading opportunities with enhanced probability of success.
🔶 SETTINGS
Customization Options:
Trend Analysis: Fast EMA Length (default: 12), Slow EMA Length (default: 26), Trend Strength Period (default: 14)
Support & Resistance: Pivot Length for level detection (default: 10), Maximum S/R Levels displayed (default: 3), Toggle S/R visibility
Momentum Settings: RSI Length (default: 14), Oversold Level (default: 30), Overbought Level (default: 70)
Visual Configuration: Color schemes for bullish/bearish/neutral conditions, transparency settings for fills, momentum candle overlay toggle
Display Options: Analysis table visibility, divergence marker size, alert system configuration
The Advanced Trend Momentum indicator provides traders with comprehensive insights into market dynamics through its sophisticated integration of trend analysis, momentum assessment, and structural level detection. By combining multiple analytical dimensions into a unified framework, this tool helps identify high-probability opportunities while filtering out market noise through its multi-confirmation approach, enabling traders to make informed decisions across various market cycles and timeframes.

RSI MTF HWThis Pine Script indicator is designed to provide a comprehensive view of market momentum by plotting the Relative Strength Index (RSI) from four different time frames simultaneously on a single chart. This allows traders to quickly identify alignment or divergence in momentum across various time horizons, which can be a powerful tool for confirming trade setups or spotting potential trend reversals.
Key Features:
Customizable Inputs: The indicator provides a flexible set of user inputs, including a dropdown menu to select the data source for the RSI calculation (e.g., close, open, high, low). You can also define four separate RSI lengths to analyze different periods.
Multi-Time Frame Analysis: A key feature is the ability to choose a time frame for each of the four RSI lines from a predefined list (Chart, 1 day, 1 week, 1 month). The script uses the request.security() function with lookahead enabled to ensure the most accurate, real-time data is used for each calculation, eliminating look-ahead bias and calculation errors.
Visual Levels: The indicator plots standard RSI levels at 30, 50, and 70, with a shaded background between the oversold (30) and overbought (70) zones to provide a clear visual reference.
Momentum Alignment Signals: The script includes an optional feature that highlights the chart's background with a red or green color when all four RSIs simultaneously enter an overbought or oversold state. This serves as an immediate visual alert for a strong, multi-time frame momentum condition.
This indicator is a robust tool for technical analysis, suitable for traders who use a top-down approach to their market analysis.
MO and Stoch GOLD H4 V1 – Kim TradingMO and Stoch GOLD H4 V1 – Kim Trading
Slogan: “Trading Is a Profession, Trading Is Life”
Market: XAUUSD (spot gold) • Timeframe: H4 (4 hours)
Entry/Exit Rules
When a B, B1★ … (buy) or S, S1★ … (sell) signal appears, first reference the prevailing trend and consider applying DCA in the direction of that trend. In addition, combine with other methods to build the most optimal setup.
Signal Confidence Tiers
B — S
B1★ — S1★
B2★ — S2★
B3★ — S3★
Enter trades only when one of the four signal types above is printed.
Author: Kim Trading • Version: V1 • Date: 2025-08-22
#XAUUSD #Gold #H4 #MO #Stoch #KimTrading
FUMO 200 MagnetWhat it does
FUMO Magnet measures how far price has stretched away from its long-term “magnet” — a blended EMA/SMA moving average (200 by default).
It plots a logarithmic deviation (optionally normalized) as an oscillator around zero.
Above 0** → price is above the magnet (stretched up)
Below 0** → price is below the magnet (stretched down)
Guide levels** highlight potential overbought/oversold zones
---
Why log deviation?
Log returns make extremes comparable across cycles and compress exponential trends — especially useful for BTC and other crypto assets.
Normalization modes further adjust the scale, keeping the oscillator readable on any chart.
---
Inputs
**Base**
* Source (default: Close)
* Base Length (default: 200 EMA/SMA)
* EMA vs SMA weight (%) — 0% = pure SMA, 100% = pure EMA, 50% = blended
* EMA smoothing of deviation — acts as a noise filter
**Normalization**
* None (Log Deviation) — raw log stretch in % terms
* Z-score — deviation in standard deviations (σ)
* Robust Z (MAD) — deviation vs median absolute deviation, resistant to outliers
* Tanh squash — smooth nonlinear squash of extremes for compact scale
* Normalization window (for Z / MAD)
* Tanh scale (lower = stronger squash)
* Clamp after normalization — hard cap at ±X
**Levels**
* Guide levels (Upper / Lower) — visual thresholds (default ±12)
* Zero line toggle
---
### How to read it
* **Trend bias**: sustained time above 0 = uptrend, below 0 = downtrend
* **Stretch / mean reversion**: the farther from 0, the higher the reversion risk
* **Cross-checks**: combine with structure (HH/HL, LH/LL), volume, or momentum (RSI, MACD)
---
### Recommended settings by timeframe
**Long-term (1D / 1W)**
* Normalization: None (Log Deviation)
* Base Length: 200
* EMA vs SMA weight: 50% (adjust 35–65% for faster/slower magnet)
* Deviation smoothing: 20 (10–30 range)
* Guide levels: ±12 to ±20
* Use case: cycle extremes, portfolio rebalancing, trim/add logic
**Swing (4H – 1D)**
* Normalization: Z-score
* Window: 200 (100–250)
* Smoothing: 14–20
* Guide levels: ±2σ to ±3σ
* Use case: stretched conditions across regimes; ±3σ is rare, often mean-reverts
**Intraday / Active swing (1H – 4H)**
* Normalization: Robust Z (MAD)
* Window: 200 (150 for faster response)
* Smoothing: 10–16
* Guide levels: ±3 to ±4 (robust units)
* Use case: handles spikes better than σ, fewer false overbought/oversold signals
**Scalping / Universal readability (15m – 1H)**
* Normalization: Tanh squash
* Tanh scale: 6–10 (start with 8)
* Smoothing: 8–12
* Guide levels: ±8 to ±12
* Use case: compact panel across assets and timeframes; not % or σ, but visually consistent
---
### Optional
* Clamp: enable ±20 (or ±25) for strict bounded range (useful for public charts)
---
### Quick setups
**BTC Daily (“cycle view”)**
* Normalization: None
* Blend: 50%
* Smooth: 20
* Levels: ±12–15
**BTC 4H (“swing”)**
* Normalization: Z-score
* Window: 200
* Smooth: 16
* Levels: ±2.5σ to ±3σ
**Alts 1H (“volatile”)**
* Normalization: Robust Z (MAD)
* Window: 200
* Smooth: 12
* Levels: ±3.5 to ±4.5
**Mixed assets 15m (“compact panel”)**
* Normalization: Tanh squash
* Scale: 8
* Smooth: 10
* Levels: ±8–12
* Clamp: ±20

Sniper-2025 Sniper-2025 Indicator Explanation
Overview
The Sniper-2025 indicator is a versatile technical analysis tool designed for TradingView, combining a Hyper Wave oscillator, Smart Money Flow analysis, divergence detection, reversal signals, confluence visualization, and a machine learning-based k-Nearest Neighbors (k-NN) prediction model. It provides traders with actionable buy and sell signals, trend insights, and confluence indicators to enhance decision-making across various trading strategies. The indicator is highly customizable, allowing users to adjust sensitivity, colors, and display options to suit their preferences.
Key Features
1. Hyper Wave Oscillator: A normalized oscillator based on price data, smoothed with either a Simple Moving Average (SMA) or Exponential Moving Average (EMA), highlighting momentum and potential reversal points.
2. Smart Money Flow: Tracks bullish and bearish money flow using a smoothed Money Flow Index (MFI), providing insights into market strength and direction.
3. Divergence Detection: Identifies bullish and bearish divergences between price and the oscillator, with optional labels displaying price levels.
4. Reversal Signals: Detects major and minor reversal conditions based on volume, oscillator values, and RSI, visualized as triangles and circles on the chart.
5. Confluence Meter and Areas: Visualizes alignment between the oscillator and MFI, indicating bullish or bearish confluence with customizable colors and shaded areas.
6. Signal and Divergence Labels: Displays labels for key oscillator levels (e.g., Z-Buy, Z-V-Sell) and money flow conditions (e.g., C-Buy, T-Sell) with customizable visibility and sizes.
7. Trend and Control Table: Shows the current trend (Bullish/Bearish) and control (Bull/Bear) in a customizable table positioned on the chart.
8. k-NN Prediction: Uses a k-Nearest Neighbors algorithm to predict price movement direction based on RSI indicators, with adjustable prediction sensitivity.
9. Gradient Fills and Alerts: Visualizes overbought and oversold zones with gradient fills and provides alert conditions for key crossovers and crossunders.
How It Works
- Hyper Wave Oscillator: The oscillator is calculated by normalizing the close price relative to the highest, lowest, and average prices over a user-defined length (default: 15). It is smoothed using SMA or EMA (default: SMA, length 3) to generate a signal line. Crossovers and crossunders of the oscillator and signal line are plotted as circles, indicating potential buy or sell signals.
- Smart Money Flow: The MFI is calculated over a user-defined length (default: 10) and smoothed (default: 6). It tracks bullish (positive) or bearish (negative) money flow, with colors changing based on direction (blue for bullish, red for bearish). The indicator compares current MFI to its historical average to identify strong trends.
- Divergence Detection: The script identifies divergences by comparing oscillator peaks/troughs with price highs/lows. Bullish divergences (price makes lower lows, oscillator does not) and bearish divergences (price makes higher highs, oscillator does not) are plotted as lines, with optional labels showing the divergence type and price.
- Reversal Signals: Major reversals are detected when volume exceeds a threshold (based on a 7-period SMA and reversal factor, default: 4) and the oscillator exceeds ±4. Minor reversals consider RSI (±20) and oscillator crossovers. Signals are plotted as triangles (major) or circles (minor), with blue for bullish and red for bearish.
- Confluence Meter and Areas: The confluence meter, displayed on the right, shows alignment between the oscillator and MFI using a gradient from red (bearish) to blue (bullish). Shaded areas at ±55 highlight strong bullish or bearish confluence when both indicators align.
- Signal and Divergence Labels: Labels are plotted on the candlestick chart when the oscillator crosses key levels (±20, ±40) or when money flow conditions are met (e.g., MFI crossing 0 or ±20/±40). Users can toggle label visibility and adjust sizes (Small, Normal, Large, Huge).
- Trend and Control Table: A table displays the trend (based on oscillator SMA) and control (based on MFI direction), with customizable position (default: Top Right), text color, and background color. Sensitivity for trend and control calculations can be adjusted.
- k-NN Prediction: The k-NN algorithm predicts price movement direction by comparing current RSI values (5-period and 20-period WMAs) to historical data. The number of neighbors (default: 200) and trend length (default: 20) control prediction sensitivity. A green line shows the prediction, with gradient fills indicating overbought (lime) and oversold (red) zones.
- Gradient Fills and Alerts: Gradient fills highlight the prediction's position relative to overbought/oversold zones, calculated using a 2000-period lookback and standard deviation. Alerts are triggered for crossovers/crossunders of the prediction line with its WMA, overbought/oversold levels, or the zero line.
Usage Instructions
1. Add the Sniper-2025 indicator to your TradingView chart.
2. Interpret signals:
- Z-Buy/Z-V-Buy (green labels): Potential buy signals when the oscillator crosses below -20/-40.
- Z-Sell/Z-V-Sell (red labels): Potential sell signals when the oscillator crosses above 20/40.
- C-Buy/C-Sell (green/red labels): Money flow shifts to bullish/bearish when MFI crosses 0.
- T-Buy/T-Sell (green/red labels): Money flow crosses ±20, indicating stronger trends.
- T-V-Buy/T-V-Sell (green/red labels): Money flow crosses ±40, indicating very strong trends.
- Divergence Labels: Green (D-Bullish) or red (D-Bearish) labels indicate potential reversals.
- Reversal Signals: Blue triangles/circles for bullish reversals, red for bearish.
- Confluence Meter: Blue (bullish) or red (bearish) gradient indicates alignment strength.
- Table: Check "Trend" and "Control" for market direction (🟩/🟥 for trend, 🟢/🔴 for control).
- k-NN Prediction: Green line above 0 suggests bullish momentum; below 0 suggests bearish. Watch for crossovers with the WMA or overbought/oversold zones.
3. Set alerts for crossovers/crossunders of the prediction line, oscillator, or MFI to automate trading signals.
Customization Options
- Hyper Wave: Adjust Main Length (mL, default: 15) for oscillator sensitivity, Signal Type (sT, SMA/EMA), and Signal Length (sLHW, default: 3). Customize colors and transparency.
- Smart Money Flow: Set Money Flow Length (mfL, default: 10) and Smooth (mfS, default: 6) for MFI sensitivity. Choose bullish/bearish colors.
- Divergence: Modify Divergence Sensibility (dvT, default: 20) for short-term (lower) or long-term (higher) divergences. Toggle visibility and price display on labels.
- Reversal: Adjust Reversal Factor (rsF, default: 4) for signal strength (higher = fewer, stronger signals). Set colors for bullish/bearish signals.
- Confluence: Toggle Confluence Meter (sCNF) and Areas (sCNB), and customize colors.
- Labels: Enable/disable specific signal labels (e.g., showZBuy, showHSell) and adjust Label Size (default: Normal).
- Table: Toggle Trend and Control display, adjust sensitivities, and set position and colors.
- k-NN Prediction: Adjust Prediction Data (numNeighbors, default: 200) for sensitivity and Trend Length (momentumWindow, default: 20) for responsiveness.
Conclusion
The Sniper-2025 indicator is a powerful tool for traders seeking a comprehensive analysis of price momentum, money flow, divergences, reversals, and predictive signals. Its customizable settings and clear visualizations make it suitable for both novice and experienced traders. Use the indicator to identify high-probability trading opportunities, monitor market trends, and refine strategies with its machine learning-driven predictions.

ETH Valuation Indicator╔═══════════════════════ RUBIXCUBE ════════════════════════════╗
This indicator combines multiple on-chain and market-based metrics into a single valuation score for Ethereum. It highlights periods of relative undervaluation (green zones) and overvaluation (red zones) by normalising several metrics into a 0–1 range and averaging them.
Price chart signals (top panel): Green arrows mark points where the indicator flagged historically attractive buying opportunities.
Valuation oscillator (bottom panel): Shows the combined score over time, cycling between undervalued and overvalued extremes.
Metric breakdown (side panel): Displays the contribution of each metric, their rate of change, and their current score.
This tool is designed for macro insight, not short-term trading. It helps contextualise Ethereum’s position in the market cycle and provides a data-driven framework for long-term investors.
╚═══════════════════════════════════════════════════════════╝

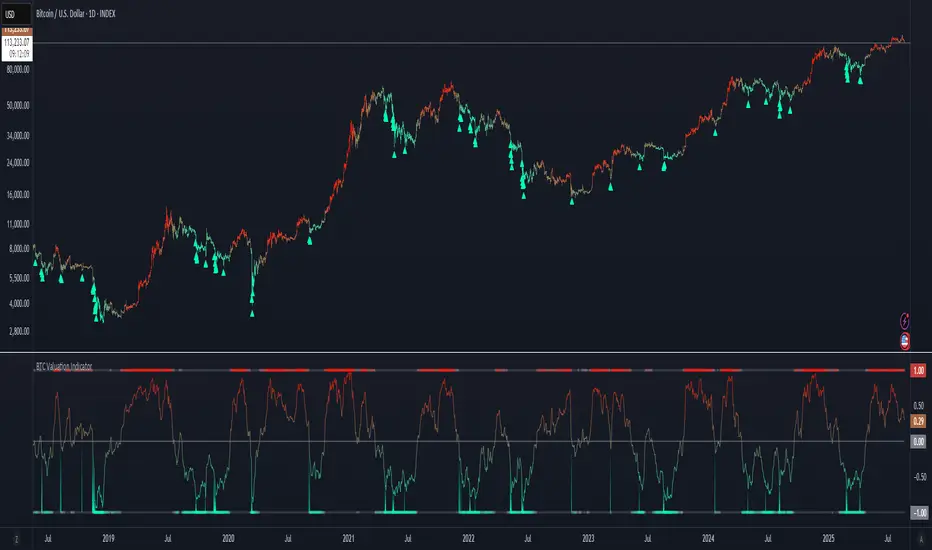
BTC Valuation Indicator╔═══════════════════ RUBIXCUBE ══════════════════════╗
This indicator combines multiple on-chain and market-based metrics into a single valuation score for Bitcoin. It highlights periods of relative undervaluation (green zones) and overvaluation (red zones) by normalising several metrics into a 0–1 range and averaging them.
- Price chart signals (top panel): Green arrows mark points where the indicator flagged historically attractive buying opportunities.
- Valuation oscillator (bottom panel): Shows the combined score over time, cycling between undervalued and overvalued extremes.
- Metric breakdown (side panel): Displays the contribution of each metric, their rate of change, and their current score.
This tool is designed for macro insight, not short-term trading. It helps contextualise Bitcoin’s position in the market cycle and provides a data-driven framework for long-term investors.
╚═════════════════════════════════════════════════╝
VSOVSO
This is similar to LazyBear's WaveTrend oscillator but handles momentum calculation differently and has some extra components for trade analysis.
The oscillator calculates an adaptive mean, then measures how far price deviates from that mean. Instead of just looking at raw deviation, it normalizes this by dividing by smoothed absolute deviation values.
The key difference is how it separates momentum - it splits the deviation into positive (up) and negative (down) components, then applies directional strength smoothing to each separately before combining them:
100 * (up_strength - down_strength) / (up_strength + down_strength)
This directional strength calculation gives more weight to sustained moves in either direction rather than just price volatility. The result is the main Momentum Wave oscillating between -100 and +100. The Signal Wave is just a smoothed version of this. The Momentum Gap shows the difference between them.
You'll see the Momentum Wave as a colored area/line with four color states, the Signal Wave as a white area, the Momentum Gap as a yellow line, the Drip Rate as cyan/purple area, and Velocity as a colored line at the bottom. The overbought/oversold zones are shaded, volatility bands adapt to current conditions, and major/minor signals show up as circles when the waves cross.
For trading, the Drip Rate is your long-term signal for bigger shifts. When it makes lower lows into resistance, look for reversals. Works great across multiple timeframes. Volatility squeezes signal big moves coming - use these with support/resistance and divergences. Top/bottom signals show momentum shifts and usually lead to pumps or drops.
Velocity shows breakout speed or rejections. Higher readings mean faster moves, regardless of direction. Wave colors reveal continuation patterns - green to purple to green means strong continuation up, red to cyan to red means continuation down.
The Momentum Gap can signal divergence on its own. The angle it crosses zero often hints at how fast the next move will be. When momentum goes outside the volatility bands, watch the next wave for divergence or confirmation.
Works best when you combine the Drip Rate across timeframes with squeeze setups and color changes for high-probability entries.
Works well with Heikin Ashi candles, or use the smoothed candle mode in the settings to mimic them. You can set the candle colors to the momentum wave colors as well, it can be helpful.
Here is a trade setup and how you can use it to take trades.
