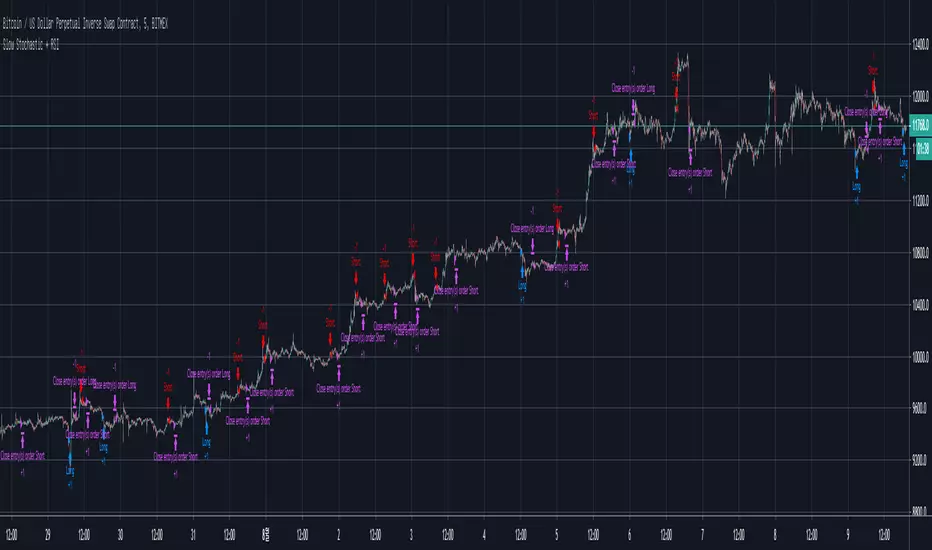
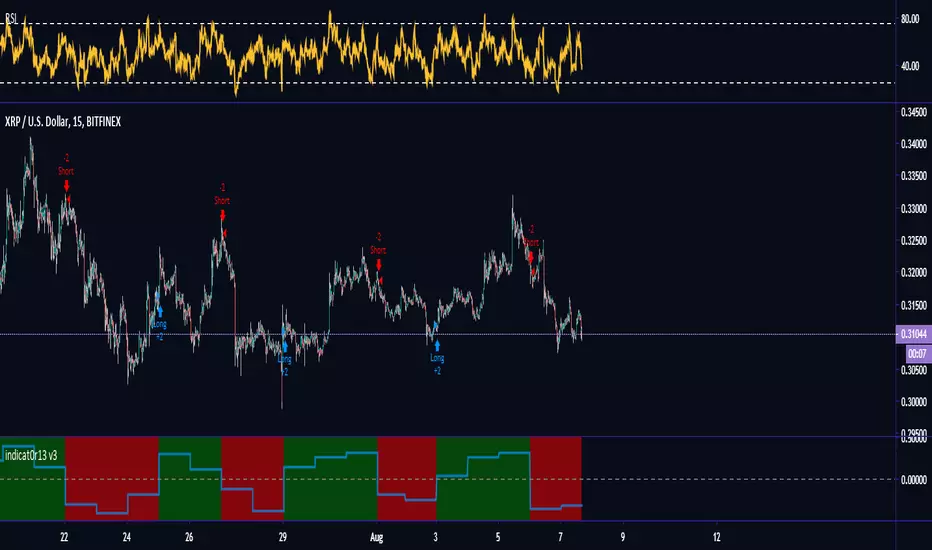
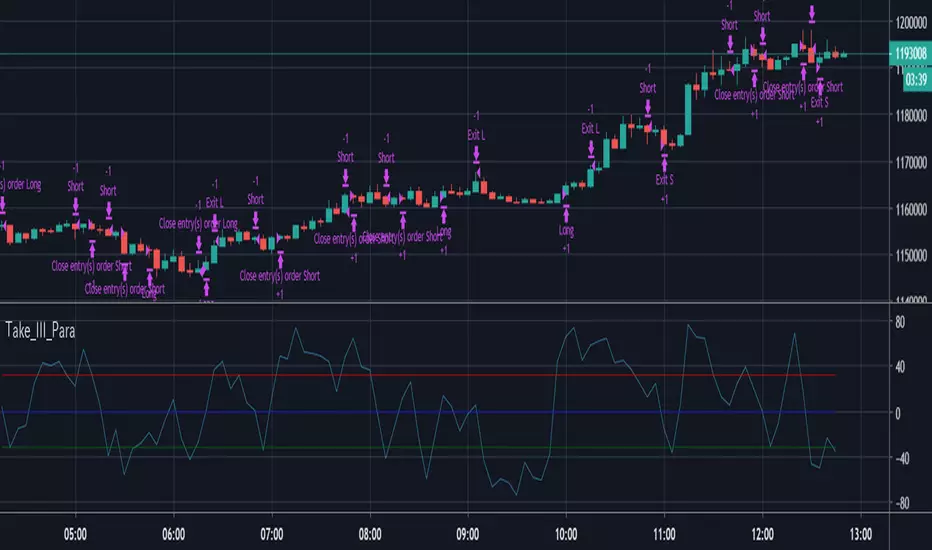
[XBTUSD 5M] Slow Stochastic + RSI Strategyhis Strategy is Low lisk, middle Return
But, The signal does not occur often.
I think a good strategy is to buy (or sell) as a split
In this way, most transactions will be profitable.
Caution! It seems good to end the deal at once.
Even if you are losing money
Do not be greedy
If it helped, please leave a comment and Like
Good Luck :)
안녕하세요.
처음으로 전략 스크립트 글을 남깁니다.
이 전략은 비트맥스 스캘핑용 전략이며,
낮은 위험성으로 중간의 수익률을 기대할 수 있습니다.
하지만 시그널이 자주 발생하지는 않습니다.
전략의 핵심은 시그널이 발생했을 때, 분할로 매수하거나 매도하며
클로즈 시그널이 나왔을 때, 한 번에 파는 것이 중요합니다.
전략은 한번에 끝내는 것이 좋습니다.
손실을 보고 있거나, 더 큰 수익률을 위해 욕심을 부리지 마세요.
만약 도움이 되었다면 좋아요와 댓글을 남겨주세요.
감사합니다.
M-oscillator
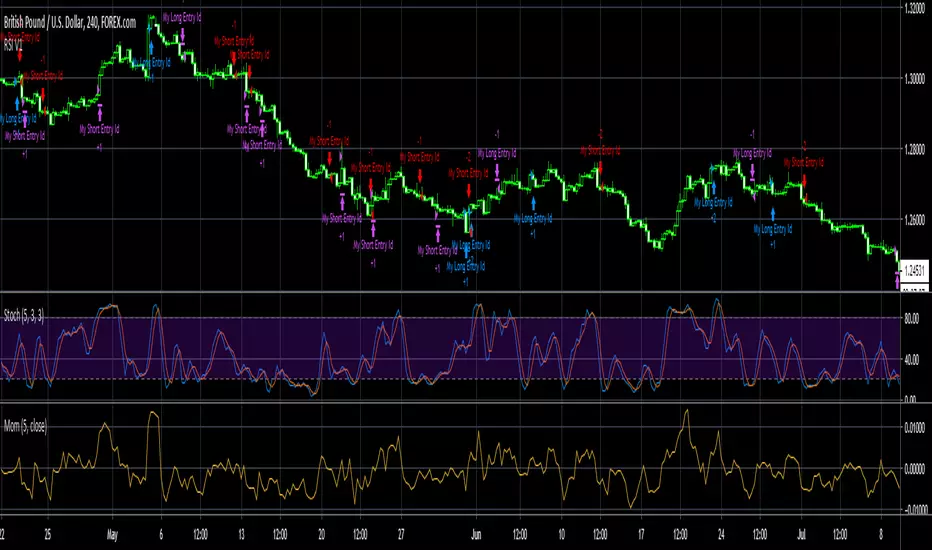
Combo Backtest 123 Reversal & Chande Forecast Oscillator This is combo strategies for get a cumulative signal.
First strategy
This System was created from the Book "How I Tripled My Money In The
Futures Market" by Ulf Jensen, Page 183. This is reverse type of strategies.
The strategy buys at market, if close price is higher than the previous close
during 2 days and the meaning of 9-days Stochastic Slow Oscillator is lower than 50.
The strategy sells at market, if close price is lower than the previous close price
during 2 days and the meaning of 9-days Stochastic Fast Oscillator is higher than 50.
Second strategy
The Chande Forecast Oscillator developed by Tushar Chande The Forecast
Oscillator plots the percentage difference between the closing price and
the n-period linear regression forecasted price. The oscillator is above
zero when the forecast price is greater than the closing price and less
than zero if it is below.
WARNING:
- For purpose educate only
- This script to change bars colors.
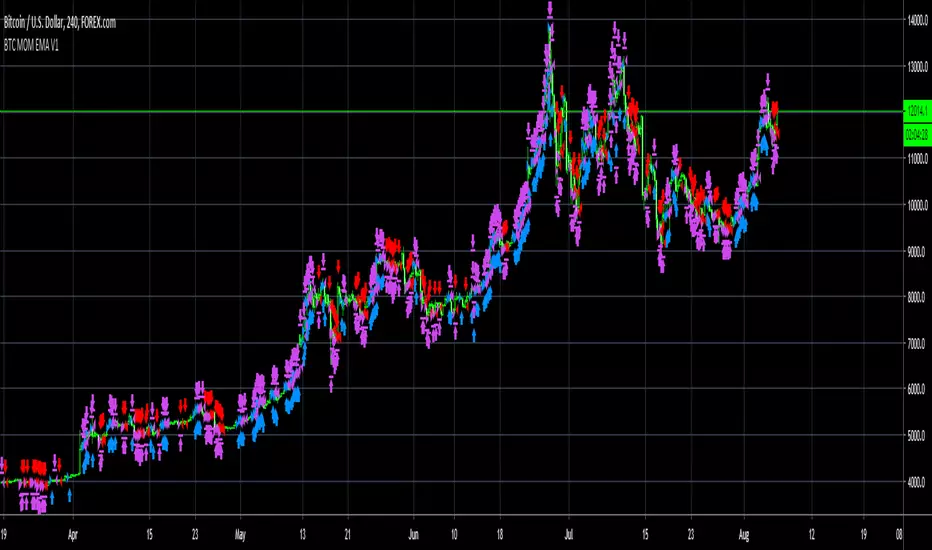
NOT-ONLY-SHORTThis script is the same as NOT-ONLY-LONG but without the security() function.
It use the following indicators: RMI + ADX + RSI + ICHIMOKU cloud only.
The fuchsia dot is the average price of the positions. The Take Profit is calculated from there.
It does not have Stop Loss, instead it makes a re-entry to try to improve the liquidation price.
Enjoy!

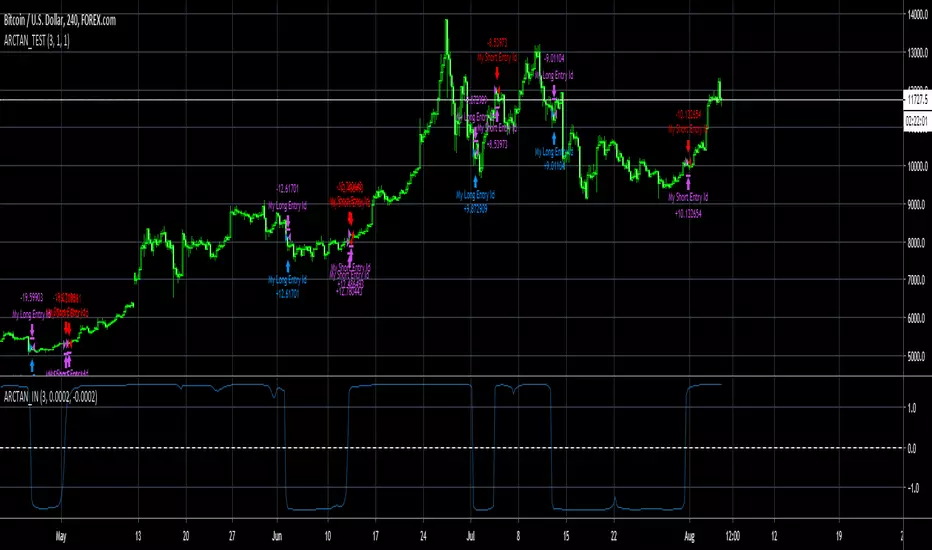
ARCTAN_TEST BTCusing the angle of the the difference between a fast and slow ema to signal sells and buys


RePaNoCHa V4 [Backtest]This is the Backtest version of the previous one.
It's important to correctly set the "TICKS / PIPS CORRECTION" parameter in each different chart.
Enjoy!

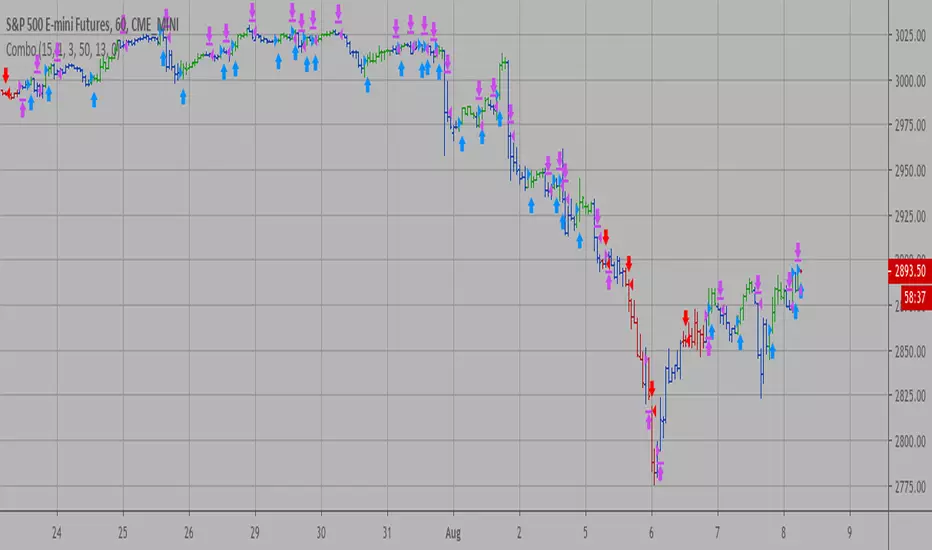
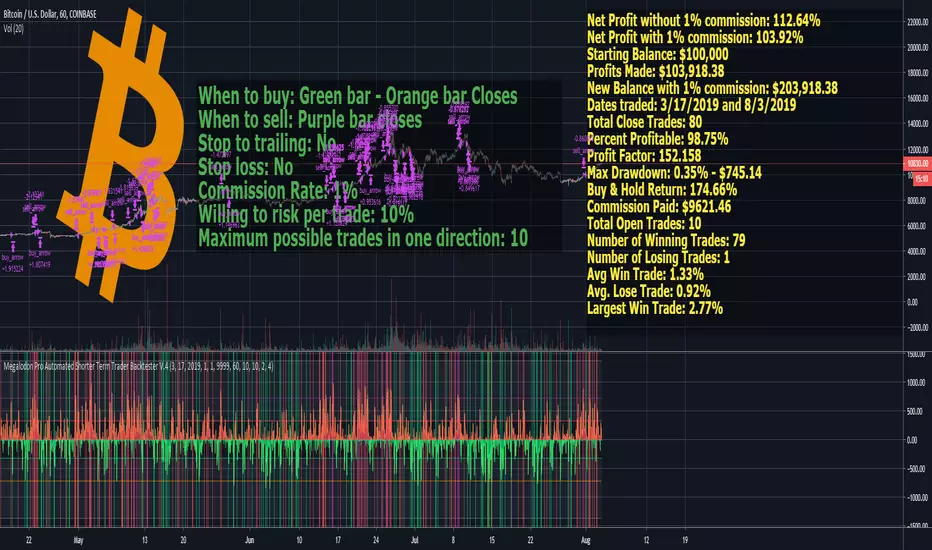
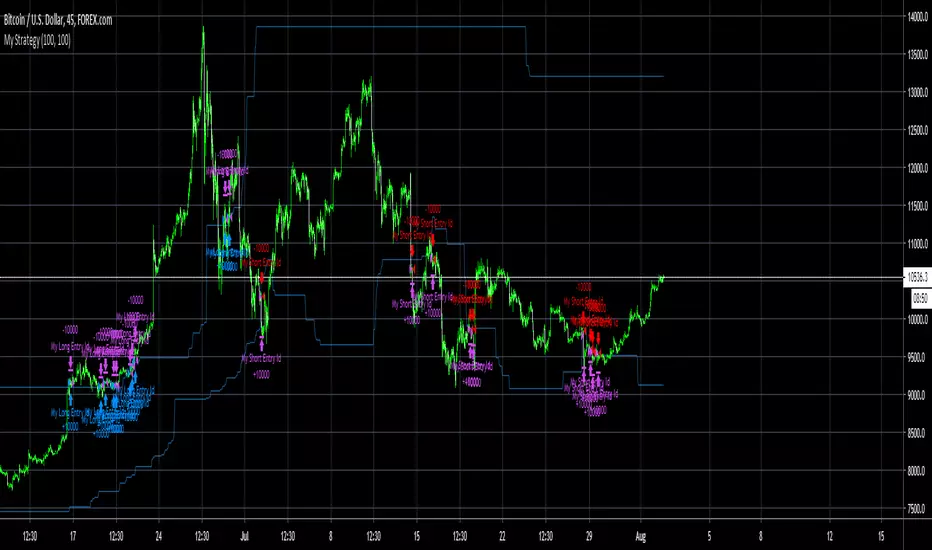
Megalodon Pro Automated Shorter Term Trader BacktesterSTRATEGY
When to buy: Green bar - Orange bar Closes
When to sell: Purple bar closes
Stop to trailing: No
Stop loss: No
Commission Rate: 1%
Willing to risk per trade: 10%
Maximum possible trades in one direction: 10
RESULTS
Net Profit without 1% commission: 112.64%
Net Profit with 1% commission: 103.92%
Starting Balance: $100,000
Profits Made: $103,918.38
New Balance with 1% commission: $203,918.38
Dates traded: 3/17/2019 and 8/3/2019
Total Close Trades: 80
Percent Profitable: 98.75%
Profit Factor: 152.158
Max Drawdown: 0.35% - $745.14
Buy & Hold Return: 174.66%
Commission Paid: $9621.46
Total Open Trades: 10
Number of Winning Trades: 79
Number of Losing Trades: 1
Avg Win Trade: 1.33%
Avg. Lose Trade: 0.92%
Largest Win Trade: 2.77%
Let me know what you guys think about the results?
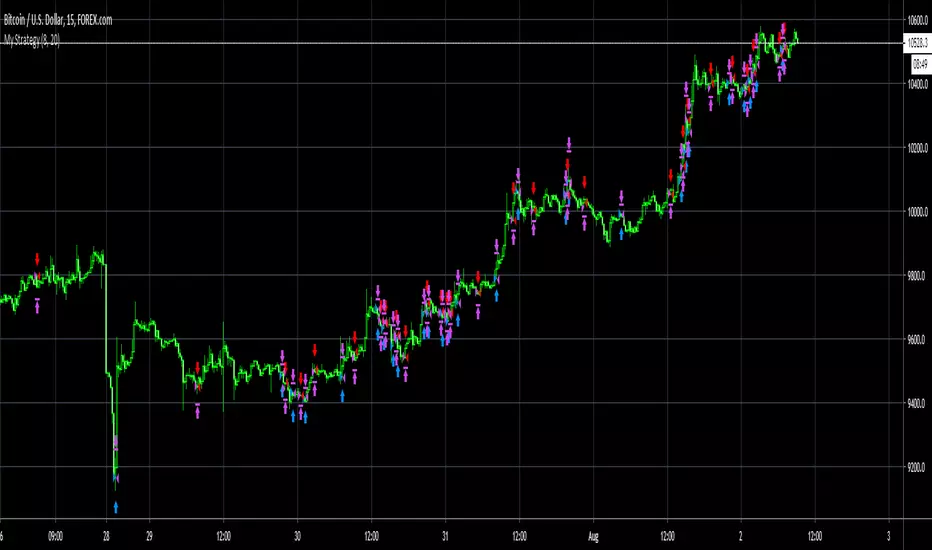
Due to the tradingview's limitations on providing the shorter time frame price data, we had to provide a 60 minute time frame backtesting results.
The shorter time frames including 1 minute and 15 minutes backtesting results are way more accurate and precise than 60 minutes time frame results.
Megalodon Trading
Enlightening the Modern Investors
Volty Expan Close StrategyVolty Expan Close Strategy, didnt really do anything except for change the parameters, would like to use a genetic algo to find the best params but i will leave it like this.


Profit Runner Strategy v2.0This is the strategy version of the recently posted Profit Runner v2.0 study. We include both together so that users can use the strategy for backtesting and figuring out the optimal settings for their specific usage and then implement those settings in the study version(which includes alerts for automated trading).
Green background highlights are buy signals and red background highlights are sell signals. Red and green filled area show the user's stop loss .
