Macd-v

GBPJPY MACD 1min Long OnlyThis MACD indicator uses two lines for long and sell long. It also uses a MACD indicator line with a historian. When the MACD historian crosses over the buy line, a long signal is executed. When the MACD historian crosses over the sell line, a close entry is signal is executed. There is a also a built in stop loss and you can adjust the buy and sell lines accordingly.
This does not repaint and I use it for autoview with an alert to autotrade this strategy.

GBPUSD MACD 1min Long OnlyThis MACD indicator uses two lines for long and sell long. It also uses a MACD indicator line with a historian. When the MACD historian crosses over the buy line, a long signal is executed. When the MACD historian crosses over the sell line, a close entry is signal is executed. There is a also a built in stop loss and you can adjust the buy and sell lines accordingly.
This does not repaint and I use it for autoview with an alert to autotrade this strategy.

EURUSD MACD 1 min Long OnlyThis MACD indicator uses two lines for long and sell long. It also uses a MACD indicator line with a historian. When the MACD historian crosses over the buy line, a long signal is executed. When the MACD historian crosses over the sell line, a close entry is signal is executed. There is a also a built in stop loss and you can adjust the buy and sell lines accordingly.
This does not repaint and I use it for autoview with an alert to autotrade this strategy.

MACD - EURUSD - 1min Long OnlyMACD strategy with a specified level the MACD and signal line must be under. Once the two lines cross under the specified level, a long entry is executed. When the MACD line crosses over the historian, the close entry will be executed. This strategy is designed around the high probability of a reversal in an under-bought trend.

CK_RedbeardsBacktestJust a quick strategy backtest for Redbeard.
For testing and entertainment only.
MBY_Trade1HBITFINEX:ETHUSD
Hi.
This is MBY_LAB.
This indicator is a paid indicator.
The color of the moving average reflects MACD.
The signal line in the middle of the screen is the Ichimoku baseline.
And you can also trade through the Bollinger Band at the same time, and you can turn it off when you need it.
You can see the Fibonacci resistance line and supporting line at a glance.
We have set the background color to distinguish between bearish and burlish.
Please use strategy test in 1 hour time frame.
Please give me a message.

MACD Enhanced Strategy MTF with Stop Loss [LTB]I developed this script to analyse MACD, MACD Signal, MACD Histogram movements by using current and higher time frame. Script calculates higher time frame automatically, no manuel entry. I also added trailing stop loss line. You can change the parameters as you wish ;)
btw. you should know that MACD is more successful when there is trend.
If you like it please comment and check out my other scripts.

Volatile Stocks - Simple Strategy w/Profit and StopThis strategy is based off of a script I wrote for another highly volatile asset, cryptocurrencies. It prints BUY and SELL signals based off of inputs that you can specify. I used this script as a time saver. If there is no signal on the chart, I'm less interested in analyzing it.
BUY SIGNALS
Bullish EMA Cross
Positive MACD Cross
Single-candle gains
SELL SIGNALS
Profit %
Stop Loss %
Naturally, I don't trade based off of the BUY and SELL signals alone, but it does help me identify the most important charts to look at.

Simple Alt Coin Strategy - EMA and MACD w/Profit and StopThis script prints BUY and SELL signals based on settings you input. I use it to save time while scrolling through charts deciding what alts I want to look at.
BUY SIGNALS
Positive EMA Crossover
Positive MACD Crossover
Single Candle Gains
SELL SIGNALS
Profit Capture
Stop Loss
I don't trade based just on the BUY or SELL from this strategy, but I have found that these indicators do very well well looking at the large cap alt coins. It backtests well.
Default Settings EMA 5/12/50, MACD 9/12/26, Single Candle Gain 10%, Stop 10%, Profit Capture 45%

MACD/EMA Long StrategyThis incredibly simple strategy uses a combination of the 20 EMA and bullish/bearish MACD crosses as a low risk method of getting in and out of markets.
Depending on whether the market is above or below the 200 SMA, the script determines if the market is in bullish or bearish territory. Above the 200 SMA, the script will ignore the 20 EMA as a buy condition and buy solely on the confirmation of a bullish MACD cross upon the close of a candle. In this bullish market, the script will only enable the sell condition if both the MACD is bearish AND a close below the 20 EMA occurs. This is to reduce the chances of the script selling prematurely in the event of a bearish MACD cross, if the market is still in overall bullish territory.
When the market is below the 200 SMA, the confirmation occurs in the opposite direction. The buy condition will only be met if both the MACD is bullish AND a close above the 20 EMA occurs. However, the sell condition ignores the 20 EMA and will sell solely on the confirmation of a bearish MACD cross upon the close of the candle.
This strategy can be used in both bullish and bearish markets. This conservative strategy will slightly underperform in a bull market, with the sell condition occasionally being met and then potentially buying back higher. However, it will successfully get you out of a turning market and automatically switch into a more 'risk-off' mentality during a bear market. This strategy is not recommended for sideways markets, as trading around the 20 EMA coupled with a relatively flat MACD profile can cause the strategy to buy the peaks and sell troughs easily.

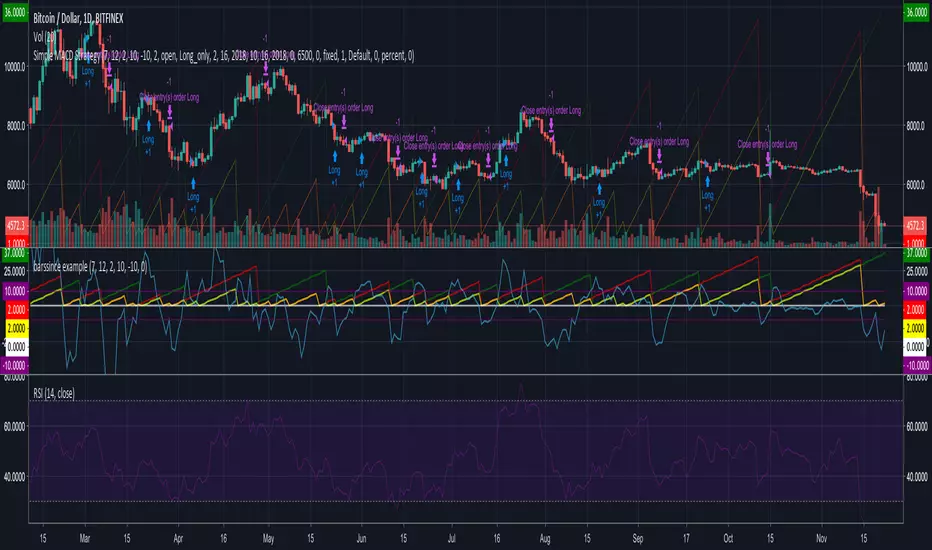
MACD_Long_OnlyI created this indicator to calculate the gains that can be made purely by going long on the market. For exchanges without the ability to short, the standard MACD strategy is unable to accurately calculate the profit/loss from entering and exiting a position, as it includes profit/loss from actively shorting the market, which may either not be possible, or be undesirable for a specific asset.


Adjustable MACD StrategyThis script provide a backtest version MACD, and provide some adjustable options.
Multiple MACD RSI simple strategySimple strategy script I've had for a while but looks like I never published.
Although it is one of my most simple it seems to have the best profitability. It is pretty rough though. the Stoch RSI has only a little weight to the trade trigger. I'll refine it more over time or you can by all means. Basically the Stoch RSI current K line has to be OVER 40 to trigger a SELL. It has no effect on buy side.
The triggers are roughly as follows:
Year - since so many assets have gone 2x, 3x, 10x+ since 2013 having a strategy that earns a 500% return from 2013 to now isn't that good if buy-and-holding would have got you 800%. This eliminates some of that noise and makes it a little easier to quickly gauge success. So buy/sell trigger need a value of greater or equal to 2018 (default)
MACD 1 - First MACD (short) needs to indicate greater than 0 to buy or less than 0 to sell.
MACD 2 - Same as MACD1 but for second MACD set (long)
Uptrend - Latest close + high divided by last periods close + high needs to be grater than 1. So if latest is 34.30 close and 34.60 high and previous interval is 34.80 close and 34.82 high, that is 0.99 and will not trigger a buy trade.
Downtrend - Same thing but close + low and less than 1.
This script/strategy is pretty rough but if there is interest I'll polish it more since it is a pretty solid but simple strategy for most assets.

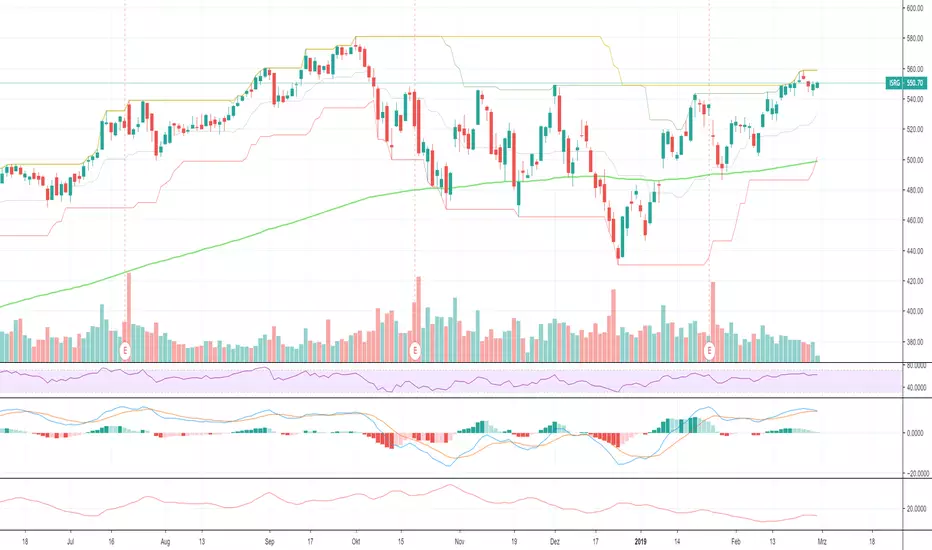
Gold trading strategy with trend follow and TDOW conceptMy strategy uses a combination of three indicators MACD Stochastic RSI.
The Idea is to buy when ( MACD > Signal and RSI > 50 and Stochastic > 50) occures at the same time
This strategy works well on stocks and cryptos especially during market breaking up after consolidation
The best results are on Daily charts , so its NOT a scalping strategy. But it can work also on 1H charts.
The strategy does not have any stops and profit targets, so we can take all the market can give us at the moment.
The exit point only when MACD goes under Signal
In addition I've decided to add a stop loss and "Trading day of week" concept
So the results are much more stable and we get more profit !
So, use it, trade it.
If it will help you to imprive your trading results, please donate me
BTC: 12kd1F8buWisUBdq27BBwRkUvzW7Ey3og5

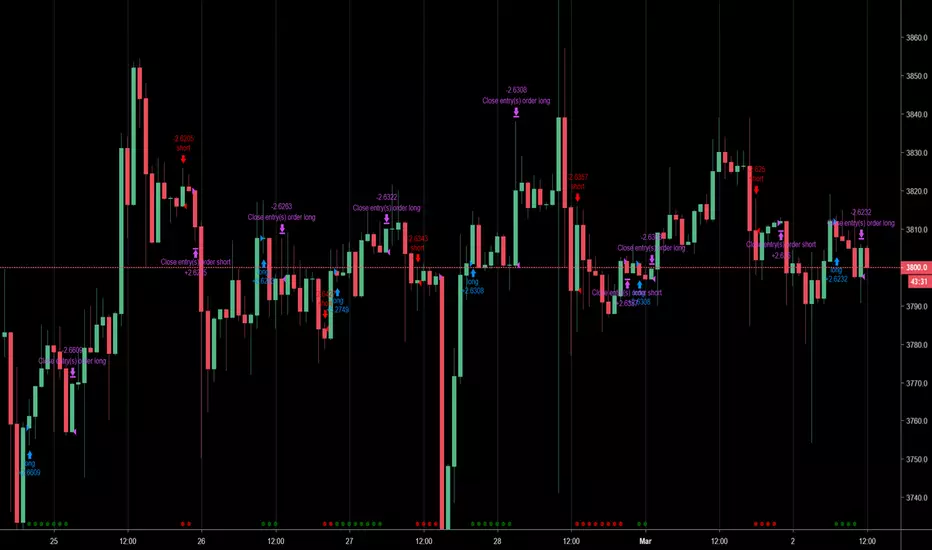
advanced MACD strategy(lirshah)advanced MACD strategy has been derived from MACD strategy, The lag parameter of that enabled the strategy to makes entry at the peaks and as the results more profitability.
macd strategy shows good results on H1 and daily time frame and has the best performance in crypto-currencies.

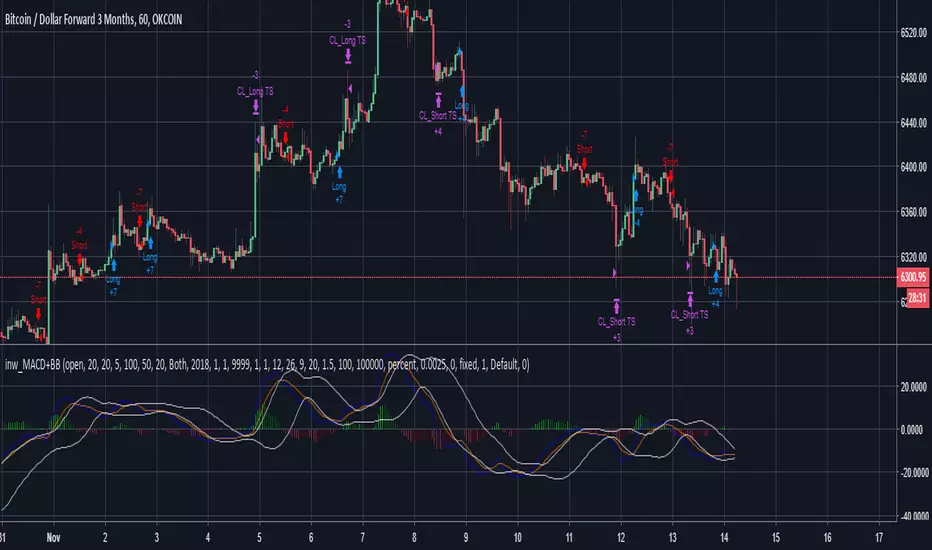
inwCoin MACD + BB Cross StrategySimple yet effective strategy by using MACD and BB the MACD line then cross it for short/long entry.
This strategy using trailing stop to exit position.
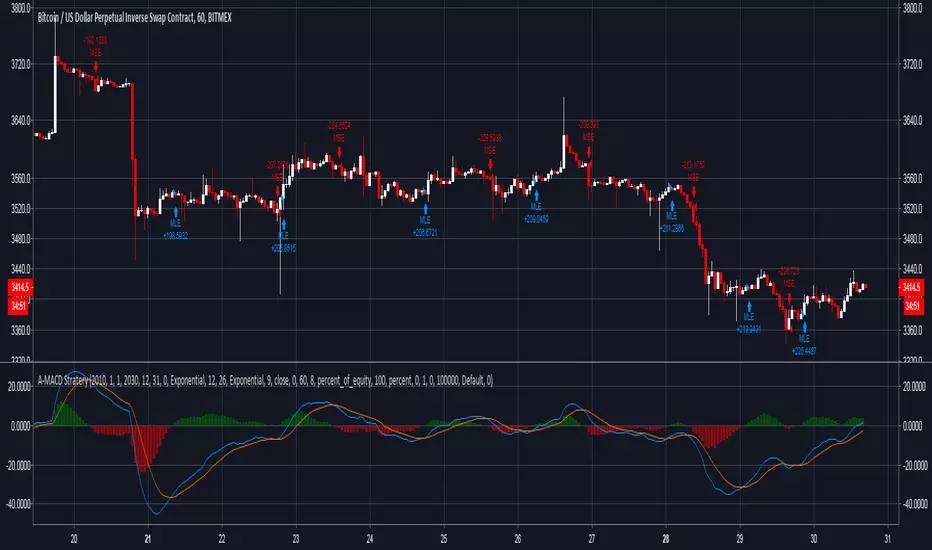
VMACD - StrategyUpdated a basic strategy (Same with MACD) these are the results on XBT-USD (It's Version 3 so no Repainting) probably some of my best work.
BUY = Histo > 0
SELL = Histo < 0
uses my VMA formula modified with change to catch see the overall direction of volume compared to price. Much more efficent than VWAP.

Simple MACD StrategyThis simple MACD strategy takes in account a given a time frame and the basic MACD parameters ( short, long, signal values).
The current implementation does not takes persistance or thresholds in accounts.
MACD LONG/SHORT STRATEGYThis indicator is just a note that I fell to myself. Please make your own assessment before using.ı wish succesful trade

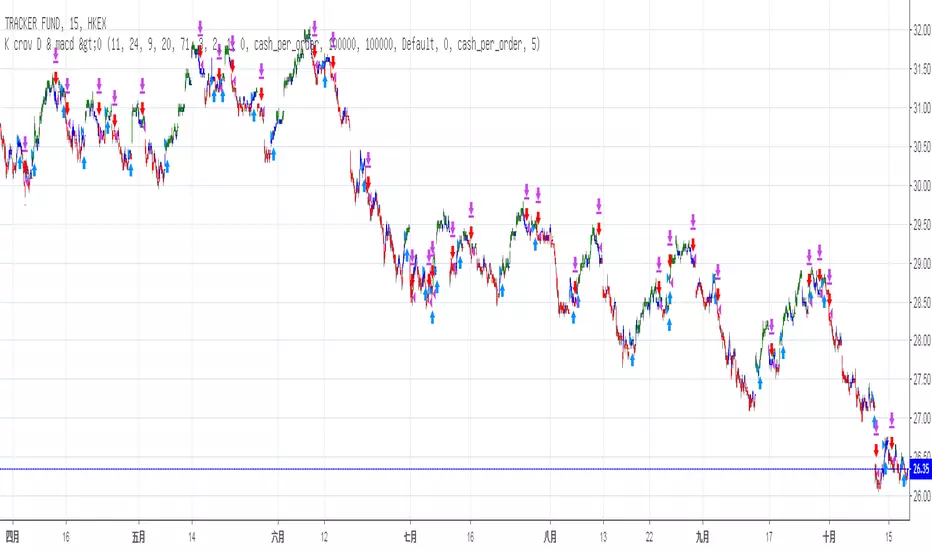
Stochastic & MACD Strategy Ver 1.0This strategy is inspired by ChartArt and jasonluk28.
The following input changes from the initial ChartArt version to achieve higher stability and profit:
Fast MA Len:11
Slow MA len: 24
Stoch Len: 20
No difference is found in minor changes (+-10) lv. of overbought/oversold
It works above 40% winning rate in Heng Heng Index, Shanghai Composite, Dow Jones Industrial Averge, S&P 500 NASDAQ, VT (World Total Market) and in 15 mins chart
Profit: above ~10 to 30% in less than 1year backtest for most major indice of China and US and ~62% in Heng Seng Index (Hong Kong) & 40.5% in SZSE Composite (Shen Zhen)
P.S. Profit: 700 (Tencent) +150.5%, 939 (CCB) +66.5%, 1299 (AIA) +45%, 2628 (CLIC) +41%, 1 (CK Hutchison) +31%
NFLX +82.5%, BABA +55.5%, AMZN +44%, GOOG +38%, MCD +24.5%
However, Loss in FB -19% , AMD -38.5%
Not suitable for stocks with great influences in News or Events ???