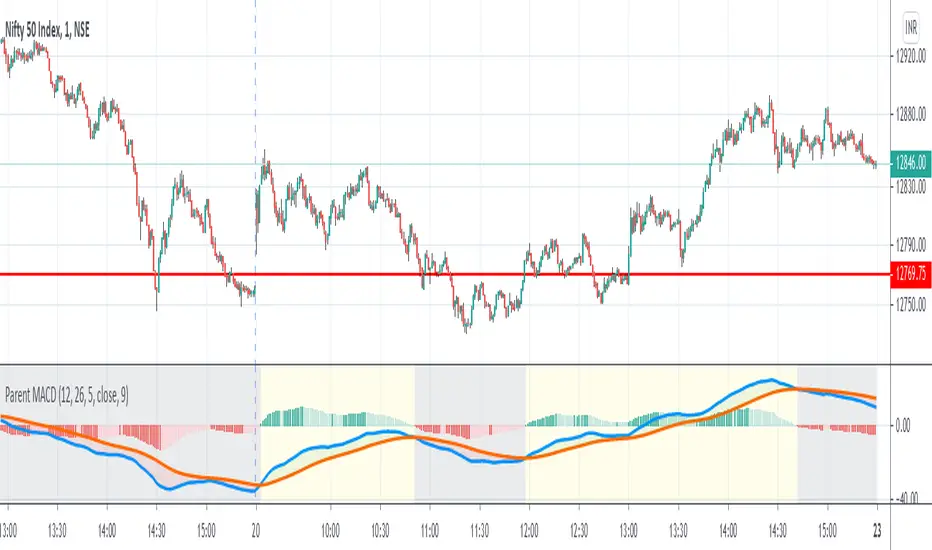
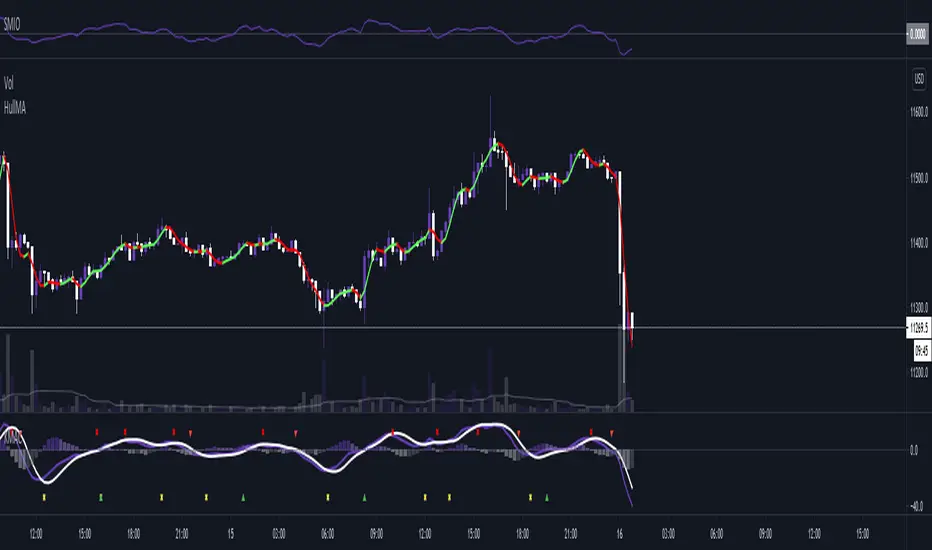
1 Parent MACDWhat is Parent MACD ?
Parent MACD is standard MACD indicator with one additional parameter of Parent. Parent MACD is designed so that you should be able to see cyclical behavior of current trend without having to switch to higher timeframe.
Why You Need This Indicator ?
Technical Analysis is defined as Art of Identifying trend in its early stages and riding on that trend until weight of evidence shows or proves the trend has finally reversed.
Technical Trading is literally 2 step process,
STEP 1 Find Direction of Trend
STEP 2 Trade in Direction of Trend
The direction of trend is taken from higher timeframe (aka parent timeframe) than your trading timeframe. The parent timeframe is 4,5 or 6 times of your trading timeframe if noise is less, if noise is extreme 6,7 or 8 is used as parent. Default Parent in this indicator is 5 and can be modified according to need of trader .
This indicator will tell you that parent timeframe is gaining momentum, if parent is gianing momentum most likely the trading time frame will also gain momentum.
How To Use This Indicator
STEP 1: Select The Time Frame You Want To Trade
STEP 2: Add the indicator on Screen
STEP 3:When you see price gaining momentum add a confirmation indicator to take trade.
Personally I use Profit Max indicator by KivancOzbilgi to confirm trade. If you are planning to use it too, don't forget to say thank you to KivancOzbilgi at in.tradingview.com
Practical Application To Trading
The indicator's most practical application is Option Trading and Trading Assets that trade 24 hours a day.
It can also be used to trade all kind of Index Options.
Indian Index Nifty
Indian Financial Index Nifty Bank
Dow Jones Industrial Average
BTC Index
IMPORTANT : The indicator only helps in trading in direction of Trend by identifying is trend regaining momentum after correction, it doesn't help you identify Trend, you have to identify trend.
Regards,
Nrupen
Macd-v
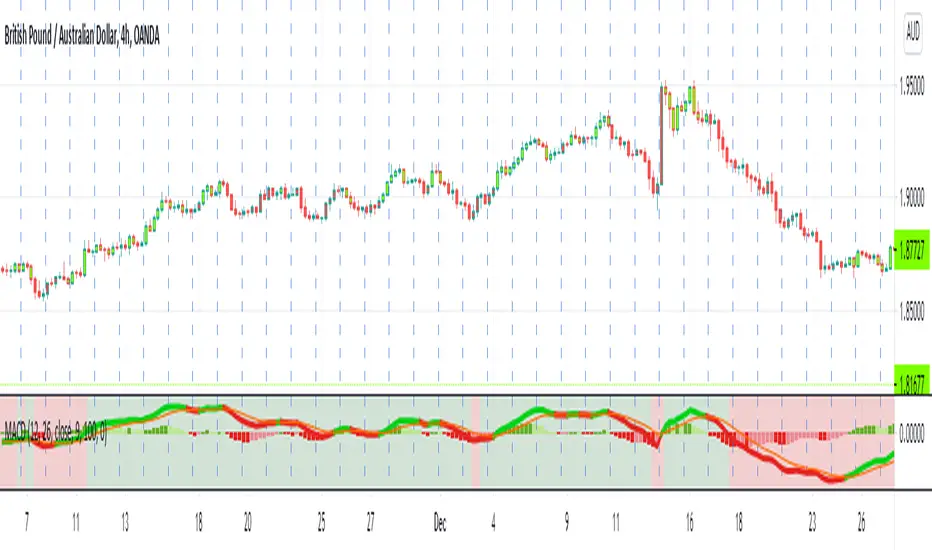
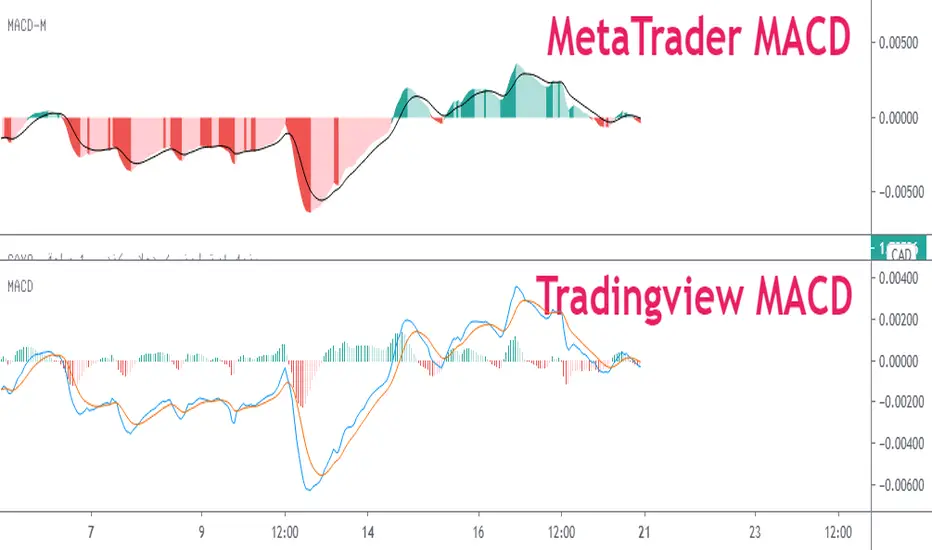
MACD with 3 strategiesMACD WITH 3 STRATEGIES
- Macd line change colour when cross the signal line
- Background Color change colour based on a moving average, on settings the value of the moving average can be changed 50,100,150,200
- Strategy one based on Macd lines with bar changing colours
- Strategy two based on Macd lines but with a different method
- Strategy three based on two other trending indicators
This indicator can be used to spot trends and changing of direction of the market and with the bar coloured its easier to identify them.
The strategy one can be used as confirmation of a trend or as changing direction integrated with other indicators like Rsi , Stochastic, Supertrend , Bollinger band, with ema option mode works better.
The strategy two can be use together with the back ground colour: When is red and the candles are red can be identified as strong drown trend.
When is green and the candles are green can be identified as strong up trend.
The strategy three can be used after checked the strategy two for more confirmation for a trend.
VERY IMPORTANT WHEN YOU TRY A NEW STRATEGY TEST IT IN A DEMO ACCOUNT FOR AT LEAST 3 MONTHS
Every donations will be devolved to cancer research and you ll have one month free trial.
If you want to purchase this indicator 30% will be devolved to cancer research.
Please leave a comment or message me if you want you have two weeks trial.
Enjoy!
The best MACD line + MACD signal + MACD histogram DivergencesHi everyone,
Here is a script that synthesizes divergence signals from the MACD indicator, including 3 options:
- MACD divegence
- MACD signal divergence
- MACD histogram divergence
Scripts are used for learning and research purposes. THESE ARE NOT BUY/SELL SIGNALS.
If you have a better idea, share it here or contact me via msg. I will improve this script better in next version.
Settings:
Basically, you only need to care about 2 parameters:
- MACD Source: There are 3 options: macdLine, signLine and histLine.
- Lookback Level For Divs: Number of previously adjacent peak.
- Other parameters, you can research more
Feel free to use, share, comment & provide feedback.
Get indicator or strategy trading signals at yummyprofit.
Good luck!

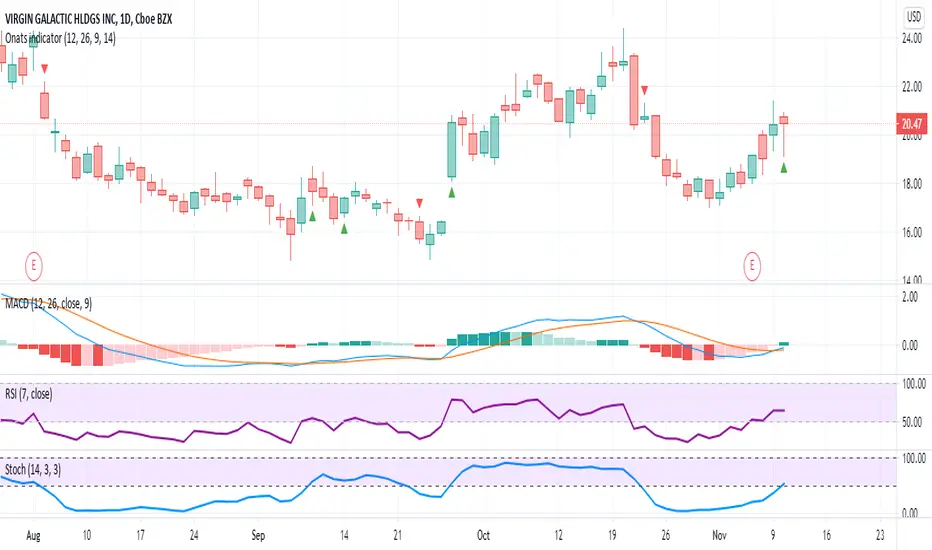
Onats indicatorBuy signal when RSI=>50, Stoch=>50, and MACD is above signal line. Set buy to the high of Buy signal candle and add 0.01.
Sell signal when RSI<50, Stoch<50, and MACD is below signal line. Set sell to the low of Sell signal candle and subtract 0.01.
Works well on Daily charts.
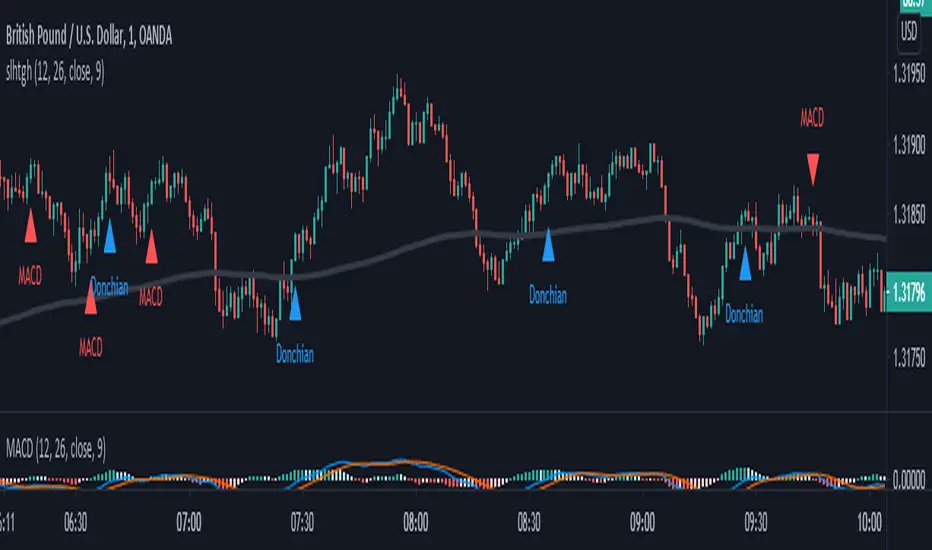
SALEH All in One Strategythis script is based on MACD strategy
for MACD:
when we have an uptrend ( the price is above the EMA 200) & the macd line cross up the signal line while they are both under the 0 level of histogram it generates buy signals.
when we have a downtrend ( the price is below the EMA 200) & the macd line cross below the signal line while they are both above the 0 level of histogram it generates sell signals.
donchian channel works as a confirmation for the macd signal.
this strategy works best at London session.
feel free to comment
best regards Forexsquad2020
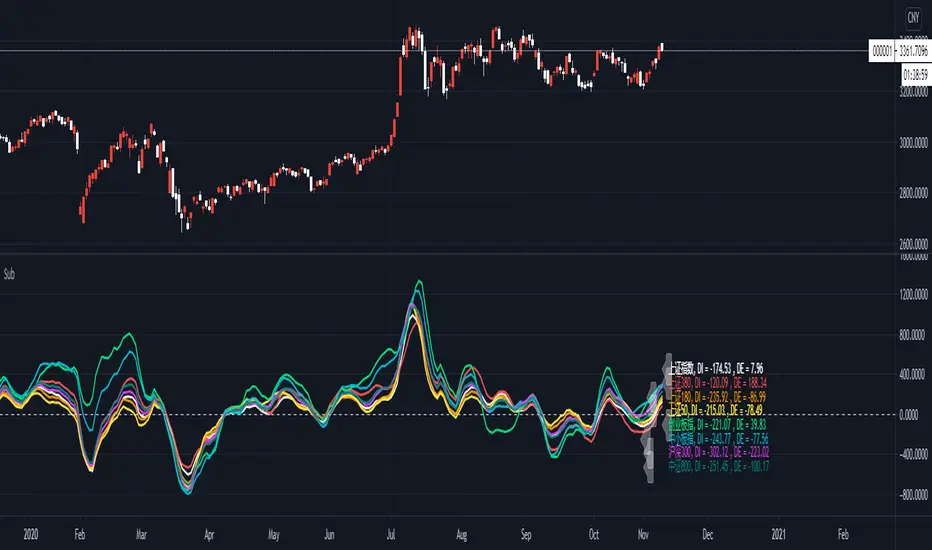
Deviation rate of Chinese stock market index// Deviation rate of Chinese stock market index
//The purpose of the indicator is to monitor the Chinese stock market index deviation rate to the 20EMA, so each major index can be observed longitudinally at the same time.
//This indicator give signal of which Index or instrument should you be focused and when should you enter the market to get a long or short position.
//The chart shows the deviation rate between the current price of each major index current price to the 20EMA.
//Also it count a deductive ratio between current price to the previous 20th bar close price to (which lead to the slope of the 20SMA)
//When using, adjust the corresponding period according to the chart period.
//The word DI (divergence) represents the deviation value between the current price and 20EMA, and DE (deduction) represents the deviation value between the current price and the 20 deduction price.
//Attention marker: The marker tells one of the moving average (EMA20 and MA20) is turning towards the opposite direction. When DE and DI one is plus , one is minus attention marker appear on the instrument title.
//Take the bull trend as an example. If the price is higher than ema20, the EMA20 is turning.If the price is higher than the close price of the bar 20 days ago , the sma20 is turning.
//When the ema20 has not turned around to opposite direction , and the ma20 is turning , the deviation rate of the moving average and the deviation rate of the deductible price are different in positive or negative.
//The marker as a reminder will appear on the instrument title.
//How to use this watchlist: You can freely replace the major indices with the instrument you are focused.
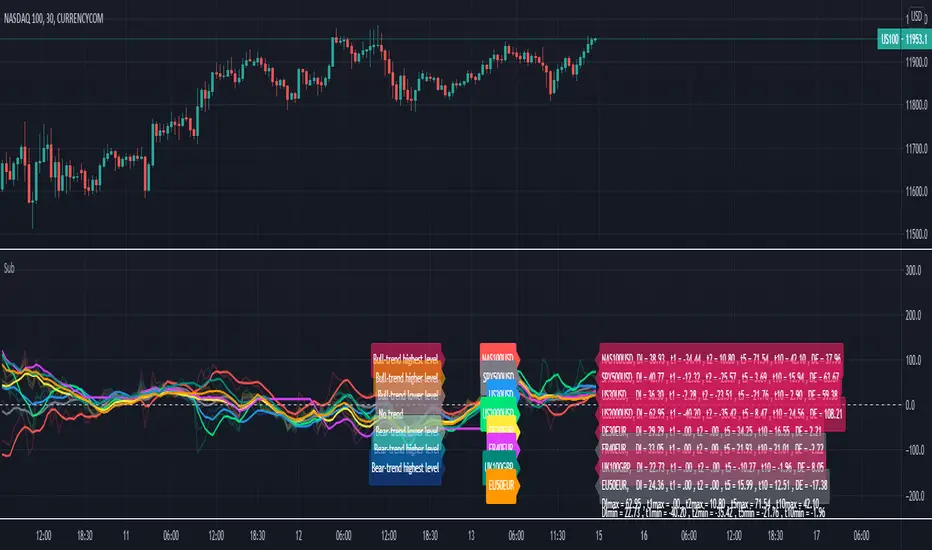
Relative Strength Index of EU and US Stock Index Trends quality//Relative Strength Index of European and US Stock Index Trends quality
//This indicator reveals the relative strength of European and US stock index futures.
//take Bull trend as an example , the current closed price>EMA20 value and the current closed price >20th previous bar closed price( deduction price),
//it's defined as a lower level bull trend .If the current price EMA20>EMA60, it's defined as a higher level bull trend .If the EMA20>EMA60>EMA120,it's defined as the highest level bull trend.
//You can choose to draw the curve with the deviation rate of the original major indexes to 20EMA, or draw the deviation rate with the average value (default value is 5 bars).
//In addition, a more technical method is added to analyze the deviation changes of the major indexes.The deviation rate changing velocity value, parameter tan (abbreviated by t) of 1, 2, 5, 10 is introduced.
//You can have the option of calculate the tan using average value of 5 candlesticks or original value.
//Taking tan1 as an example, it indicates how much the deviation rate between the current price and the previous candlestick has changed.
//The indicator of the index color and the description of the trend quality color can be switched off in option.
//In addition, this code color scheme is only suitable for black background (the code color needs to be changed by yourself if you use white background).
RogTrader AlgoA simple BUY/SELL algorithm based on Moving Averages (EMA), MACD, RSI, Stochastic, ADX, ATR, CCI, OBV, Pivot Points, and Parabolic Sar, and Volume averaged.
Simple algo that uses multiples indicator strengths and weight them to generate buy and sell signals
Indicator strengths are displayed on each candle (green is bullish and red is bearish)
Green Buy and Red Sell shall be primarily used for long positions
Bull and Bear Strengths are created based on Price Action, and Volume, the length of the array shows upward or downward strength
Indicators' Signal Strength shows number Indicators' indication for the direction.
Bollinger Bands are in red and green filled
VWAP Bands are in gray, green, and red
Linear Regression is the blue line
Check multiple timeframes.


MACD/EMA Golden CrossThis is a slight modification to the MACD indicator. The golden cross indicator makes use of EMA 7 and EMA 21 as well as MACD together, in which it will turn the MACD line yellow & fill the MACD with a yellow background when MACD is above the signal line and EMA7 is above EMA21. This is best suited for swing trading on a daily timeframe.

My BTST RSI MACD X-BODYMy trial of script base on EMA , RSI and MACD to filter the best Candle which has likely hood of uptrend in a practice of " Buy Today Sell Tomorrow".
Blue candle : 40 to 70 % RSI
Orange candle > 80 % RSI
Yellow candle < 30 % RSI - buy and can hold
Lime candle buy above MACD line.
Also i added the label when 2 EMAs and SMA cross each other in solid body candle.
Buy on Blue, Lime.
Buy and hold on Yellow candle.
Good luck!

NIFTY Money Flow - Scalping/SwingBrief Description About Script
It considers the change of price in the direction
change of price is +Ve then considered as +Ve money flow
-Ve then considered as -Ve money flow
and it multplied by Volume change
This Strategy works best with NIFTY
For Scalping:-
Settings:- 1 Min Candle Time Frame, Length 20
For Swing:-
Setting:- 30 Min Candle Time Frame, Length 11
How to use it?
Common usage:-
Buy - When turns Red to Green Buy by keeping 1.5 * ATR as SL or Trailing SL(Optional) at the same time frame
Sell - When turns Green to Red SL by keeping 1.5 * ATR as SL or Trailing SL(Optional) at the same time frame
Trend reversal:-
Draw Divergence between indicator and price
Buy - Indicator forms Higher Highs(Red Side), Price Lower Lows
Sell - Indicator forms Lower Lows(Green Side), Price Higher Highs
Breakouts:-(Less Accurate compared to other scenarios)
End of Triangel/Box Indicator Turns Red to Green - Bullish Breakout, Green to Red Bearish Breakout
can use for breakouts chart patterns and guess which side it's going to break
can use for reversal as well by observing divergence between price & indicator
Note:-
In the future, an updated version is coming with it auto-generated buy/sell signal on the chart & gives backtesting results as a strategy

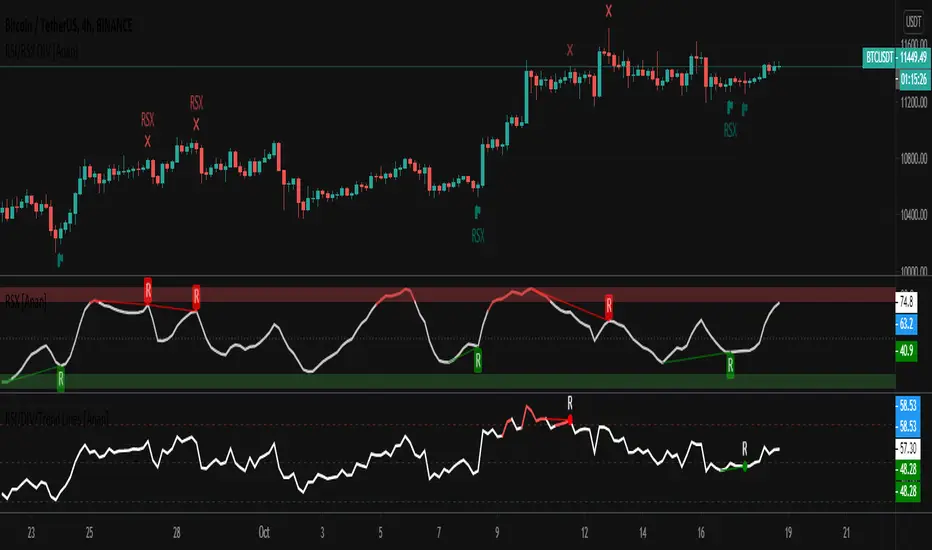
RSI/RSX Divergance on chart [Anan]This script points Regular/Hidden Bull/Bear RSI/RSX divergences on the chart.
Options:
-RSI/RSX source
-RSI/RSX length
-Show/hide Regular/hidden Bull/Bear divergences
KMACThis is a heavily modified MACD indicator that includes two different measurements, either regular, or weighted. Weighted is either EMA or KAMA dependent. I personally only use this in certain scenarios but it has proved handy for overall trend as it's slower.
This indicator also has a colorized histogram for the rising/falling of momentum, as well as arrows and crosses to indicate the "death" crosses, "golden" crosses, and falling above/below the "0-Line". 0-Line is embedded into the indicator as well, the user need not worry about drawing it on top of the indicator.
BSKL Short-Term Momentum TradingIndicator to identify the beginning of a Momentum, designed to use for the Malaysian market(I haven't tried it on other markets).
Best to use on 30 minute timeframe. When all criteria is fulfilled, there will be a "^" logo appearing below the candlestick .
Not to be commercialised, feel free to PM me for any improvement or suggestion.
Happy trading.

Divergence of Market Breadth & Price deduction indicatorHow it begin?
Traders and investors use market breadth in order to assess the index’s overall health. Market breadth can be a reliable, if not an accurate, indicator of an upcoming price rise in the index. Similarly, it can also provide early warning signs for a future price decline.
What is it?
market breadth in this case refer to percentage of stocks above 20 Simple Moving Average,which could be used as a barometer for the market.
How it works?
This paticular indicator compare the divergence of Nasdaq 100 and Russell 2000 percentage of stocks above 20 Simple Moving Average.
This indicator also include a deduction price method ,which is inspired from LEI & LoneCapital

RSI and market strength with alerts By combining the true strength of the Nasdaq (NDX) and S&P500 ( SPY ) we can then compare that against the volatility /fear index ( VIX ). The true strength of the Volatility Index ( VIX ) is shown by the red area and the Nasdaq (NDX) and S&P500 ( SPY ) by the silver /teal areas.
The yellow EMA area shows the average difference between the VIX and the NDX/ SPY indexes. When the yellow area crosses above the zero line and is climbing it means that the NDX/ SPY are strengthening. When the yellow area is decreasing or crosses under the zero line it means the fear/volatility index ( VIX ) is becoming stronger and NDX/ SPY are weakening. The RSI is overlaid as a white line to show the correlation of the instrument strength compared to the market.
When looking at charts of companies/components listed on the Nasdaq and/or S&P 500 you will notice a frequent correlation between the movement of the yellow area depicting index health and the RSI of the chart you are viewing. It’s a very quick and effective method of seeing the strength and fear within the market indexes and how they are effecting your chart.
The background color changes when the market strength combined with the active symbol RSI and higher timeframe MACD signals are aligned. Green is a buy zone, Red is a sell zone.
There are also red and green indicator x’s at the top/bottom of the indicator. They show a drastic change in Relative strength within a short period. This often indicates a buy or sell opportunity.
It is tested and works well on all timeframes with Stocks listed on NASDAQ & S&P500 .
Buy, Sell, Exit Buy and Exit Sell alerts are included.
There are also red and green indicator x’s at the top/bottom of the indicator. They show a drastic change in Relative strength within a short period. This often indicates a buy or sell opportunity.

MA MTF Momentum HistogramMy own interpretation indicator which i call multi time frame moving averages momentum with NO LAG EMA support (Optional).
The indicator is calculated by subtracting the long-term EMA from the short-term EMA .
This pretty much resembles the MACD moving averages calculation but without the smoothing of the histogram.
Can also be used to find divergences.
The background shows the main trend with higher time frame which can be set in the settings.
Aimed to use with Higher time frame (Double or more) but can also work with lower time frame.
How to use the indicator?
==Histogram==
Green: Momentum of asset is positive and increasing.
Lighter Green: Momentum of asset is still positive but decreasing and can revert to negative momentum.
Red: Momentum of asset is negative and increasing.
Lighter Red: Momentum of asset is still negative but increasing and revert to positive momentum.
==Background Color - Main Trend==
Green: HTF (Higher time frame) momentum is positive.
RED: HTF momentum is negative.
Feel free to comment and Follow to stay updated with upcoming scripts: www.tradingview.com
NOTE: BARS ARE COLORED BY DEFAULT WITH HISTOGRAM COLORS! (Can be changed in settings)

MACD and EMA200 With SignalsThis is my first indicator. It PROVIDES BUY, SHORT, and FALSE Signals by taking the MACD and the 200EMA.

PWTPROv5 TrendIndicator with LONG/SHORT BTC ETH alerts
This PWTPRO indicator is based on VWAP , MACD and EMAs
Best fits for BTC /USDT and ETH/USDT trading for 1H timeframe for positional trading (3-5 trades per week)
15min TF is good for intraday scalping. 4H is good for longterm. Fits for any coin, forex, metals, oil and bonds.
There are 4 types of entries, 1,3 and 4 are on by default. It's more accurate. Rest you can test.
Warning. Not yet works with huge trend continuation. Use it manually with you own risk management, don't forget stop-losses.
Show take profits and stop-loss (It's off by defaults)
You can now add 3 take-profit and 1 stop-loss labels on chart in %
Use 0 values to remove any of them from the charts.
New option: Show entering position price as label
Minor visual improvements with price labels (y position is now correctly above/below bars)
+added new option to round prices for integer values (i.e. 9251 for btc instead of 9251.35) off by defaults and now fits for altcoins and any asses that has price below 1 (usd, btc etc)
This is invite only script. PM me if you want to test it.

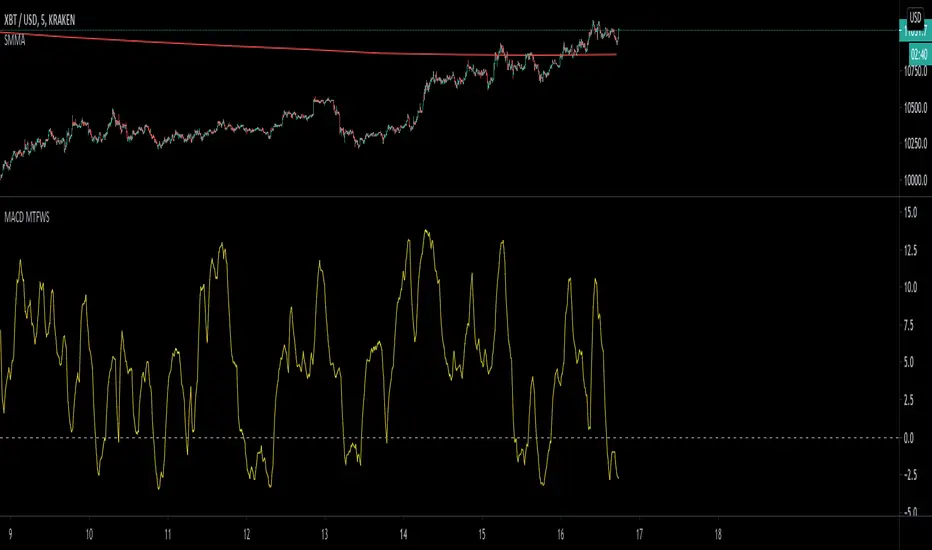
MACD Multiple Time Frames Weighted Momentum Score OscillatorThis script looks at the current momentum direction (up or down) for the 5 minute, 30 minute, 1 hour, 4 hour and daily and allows you to set scores of importance to these.
These scores are then added up to create an oscillator matching your preferences. Tune the indicator to match what you believe is the most important time frames that people use and score it accordingly. The values I put by default are just for demonstration.
For example, (and if you want to test to verify it's working), set the scores to 0 for everything except for the daily). Look at the daily macD by adding it as an indicator and set a score. Whenever the macD is trending up it will add the appropriate value to the score and likewise remove it when it's not.
Enjoy!
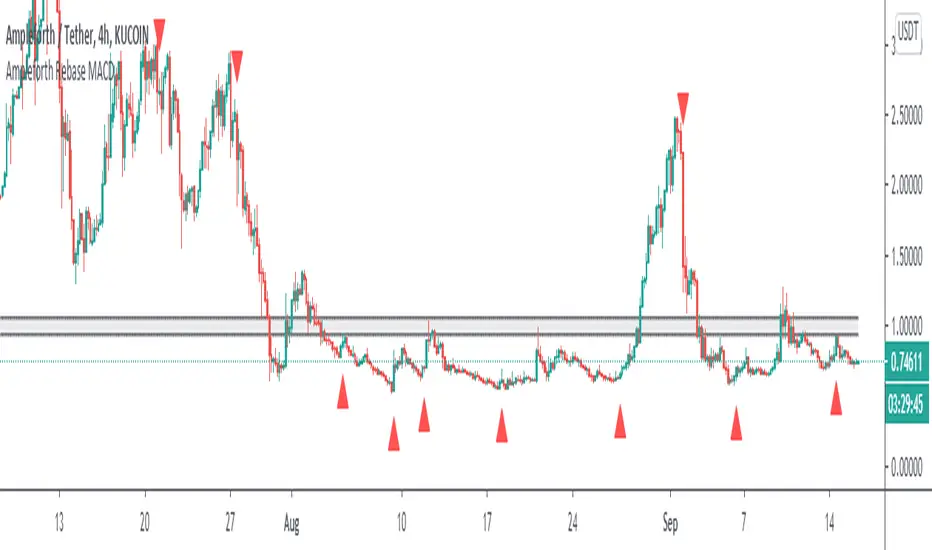
Ampleforth Rebase MACDThis script reveals Ampleforth rebase levels which are going to always work. In addition to that is MACD crossovers serving as potential buy/sell entries. You can set alerts for MACD crossovers and price entering balanced value area (0.96 - 1.06).
MACD signals can be used to automatically open a position and entering a balanced value area can be used as take-profit. Since the price will always move to this level, using this strategy without leverage should be profitable.
Ampleforth seems like a nice asset to trade since it is unlikely to correlate with anything else. At least not when it gets to the extreme levels.