Advanced Divergence Hunter [JOAT]Advanced Divergence Hunter
Introduction
The Advanced Divergence Hunter is an open-source multi-oscillator indicator that simultaneously tracks divergences across six different momentum indicators: RSI, MACD, Stochastic RSI, CCI, MFI, and Williams %R. This mashup creates a comprehensive divergence detection system designed to identify momentum exhaustion and potential reversals by analyzing when multiple oscillators simultaneously show divergence from price action.
The indicator addresses a critical limitation of single-oscillator divergence detection: false signals. By requiring confluence across multiple oscillators using different calculation methods, this tool significantly reduces false divergence signals and highlights only the most reliable momentum exhaustion patterns that occur when price and momentum fundamentally disconnect across multiple measurement frameworks.
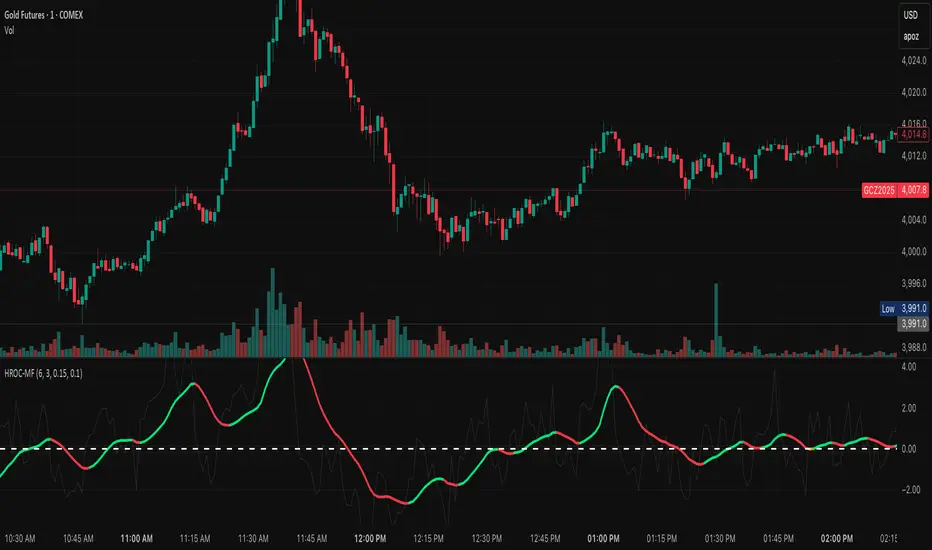
Chart showing multiple divergence signals across oscillators with dashboard on 1H timeframe
Why This Mashup Exists
This indicator combines six oscillators that detect divergences using fundamentally different methodologies:
RSI: Momentum oscillator based on average gains vs losses
MACD: Trend-following momentum using EMA convergence/divergence
Stochastic RSI: Stochastic calculation applied to RSI for enhanced sensitivity
CCI (Commodity Channel Index): Measures deviation from statistical mean
MFI (Money Flow Index): Volume-weighted RSI showing buying/selling pressure
Williams %R: Momentum indicator measuring overbought/oversold using highest high/lowest low
Each oscillator responds to different market dynamics: RSI tracks momentum speed, MACD shows trend strength changes, Stochastic RSI catches early shifts, CCI identifies statistical extremes, MFI incorporates volume, and Williams %R uses price extremes. When multiple oscillators show divergence simultaneously, it indicates genuine momentum exhaustion rather than noise from a single calculation method.
The mashup is justified because these oscillators use distinct mathematical approaches (rate of change, moving average convergence, stochastic, statistical deviation, volume-weighted, price extremes) that respond to different aspects of price movement. Confluence across multiple methods provides significantly higher reliability than any single divergence signal.
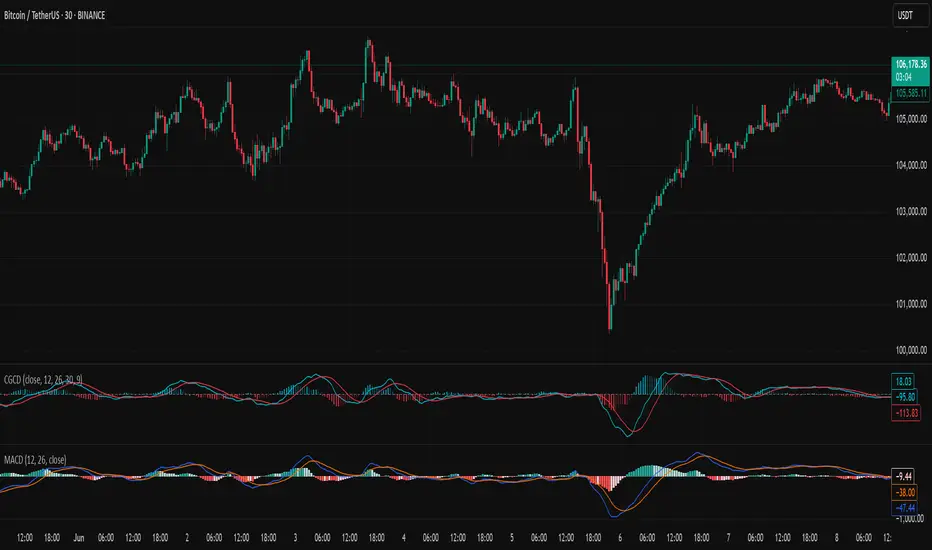
Example showing all six oscillators with divergence markers and alignment indicators
Core Components Explained
1. RSI Divergence Detection
Standard RSI calculation with pivot-based divergence logic:
rsi = ta.rsi(close, 14)
// Identify swing points
pivotHigh = ta.pivothigh(rsi, 5, 5)
pivotLow = ta.pivotlow(rsi, 5, 5)
// Regular Bullish Divergence
// Price: Lower Low, RSI: Higher Low
bullDiv = priceLow < prevPriceLow AND rsiLow > prevRSILow
// Regular Bearish Divergence
// Price: Higher High, RSI: Lower High
bearDiv = priceHigh > prevPriceHigh AND rsiHigh < prevRSIHigh
2. MACD Histogram Divergence
MACD histogram divergences often lead price divergences:
= ta.macd(close, 12, 26, 9)
// Histogram divergence detection
// Bullish: Price LL, Histogram HL
// Bearish: Price HH, Histogram LH
The indicator plots MACD histogram with enhanced visualization and tracks divergences separately from RSI.
3. Stochastic RSI Divergence
More sensitive than regular RSI, catches early momentum shifts:
stochRSI = ta.stoch(rsi, rsi, rsi, 14)
// K and D line divergences
// Often diverges before regular RSI
Stochastic RSI K and D lines are plotted, and divergences on both lines are tracked independently.
4. CCI Divergence Detection
CCI measures price deviation from statistical mean:
cci = ta.cci(close, 20)
// CCI divergences indicate statistical exhaustion
// Bullish: Price LL, CCI HL
// Bearish: Price HH, CCI LH
CCI divergences are particularly reliable at extreme levels (> +100 or < -100).
5. MFI Divergence (Volume-Weighted)
MFI incorporates volume, making divergences more significant:
// Calculate typical price
typicalPrice = (high + low + close) / 3
// Money flow with volume
rawMoneyFlow = typicalPrice * volume
// MFI calculation
mfi = 100 - (100 / (1 + positiveFlow / negativeFlow))
// Volume divergences often lead price
// Bullish: Price LL, MFI HL (buying pressure increasing)
// Bearish: Price HH, MFI LH (selling pressure increasing)
MFI divergences are weighted more heavily in the confluence system because they incorporate volume.
6. Williams %R Divergence
Williams %R uses highest high and lowest low:
williamsR = -100 * (ta.highest(high, 14) - close) / (ta.highest(high, 14) - ta.lowest(low, 14))
// Divergences at extreme levels (-80 to -100 or -20 to 0)
// Bullish: Price LL, Williams %R HL
// Bearish: Price HH, Williams %R LH
Williams %R divergences are most reliable when oscillator is in extreme zones.
Divergence Confluence System
The indicator tracks divergences across all six oscillators and calculates confluence:
Divergence Confluence Score:
- Single oscillator divergence: 1 point
- Two oscillators: 2 points
- Three oscillators: 4 points
- Four oscillators: 7 points
- Five oscillators: 11 points
- All six oscillators: 15 points (MEGA divergence)
Divergence classification:
Weak Divergence: 1-2 oscillators (score 1-2)
Moderate Divergence: 3 oscillators (score 4)
Strong Divergence: 4 oscillators (score 7)
Very Strong Divergence: 5 oscillators (score 11)
MEGA Divergence: All 6 oscillators (score 15)
The dashboard displays which oscillators are showing divergence and the total confluence score.
Oscillator Alignment Analysis
Beyond divergences, the indicator tracks oscillator alignment:
Alignment Score:
- RSI in healthy range (40-60 bull, 60-40 bear): +1
- MACD histogram direction: +1
- Stochastic RSI position: +1
- CCI direction: +1
- MFI level: +1
- Williams %R position: +1
Total Alignment: 0-6 points
Alignment interpretation:
5-6 aligned: Strong momentum consensus
3-4 aligned: Moderate momentum
0-2 aligned: Weak or conflicting momentum
Enhanced Dashboard System
The indicator features an 11-row dashboard showing:
Row 1: Overall momentum direction (BULL/BEAR/NEUTRAL)
Row 2: Divergence confluence score with color coding
Row 3: RSI value and divergence status
Row 4: MACD histogram status
Row 5: Stochastic RSI K value
Row 6: CCI value and status
Row 7: MFI value and divergence status
Row 8: Williams %R value
Row 9: Momentum strength (0-100)
Row 10: Oscillator alignment (X/6 aligned)
Row 11: Active divergences count
Dashboard showing divergence confluence with individual oscillator breakdown
Visual Elements
Oscillator Lines: All six oscillators plotted with distinct colors
Divergence Labels: "DIV" markers at divergence points, sized by confluence
Confluence Markers: Large diamond shapes for MEGA divergences (6/6)
Background Zones: Color-coded backgrounds for extreme conditions
Overbought/Oversold Lines: Reference levels for each oscillator
Zero/Midpoint Lines: Centerline references
Histogram Bars: MACD histogram with gradient coloring
Dashboard: Comprehensive table with all oscillator readings
How Components Work Together
The mashup creates layered divergence analysis:
Layer 1 - Individual Detection: Each oscillator independently detects divergences
Layer 2 - Confluence Calculation: System counts how many oscillators show divergence
Layer 3 - Weighting: Volume-based divergences (MFI) weighted more heavily
Layer 4 - Alignment Check: Verifies overall oscillator consensus
Layer 5 - Extreme Zones: Identifies when divergences occur at statistical extremes
Layer 6 - Signal Generation: Produces graded signals based on confluence strength
Example scenario: Price makes higher high, but RSI, MACD, Stochastic RSI, and MFI all make lower highs (4/6 divergence). CCI and Williams %R are in extreme overbought zones. Confluence score is 7 (Strong Divergence), and dashboard shows 4 active divergences. This signals high-probability bearish reversal setup.
Input Parameters
Oscillator Settings:
RSI Length: Period for RSI (default: 14)
MACD Settings: Fast 12, Slow 26, Signal 9
Stochastic RSI Length: Period for Stoch RSI (default: 14)
CCI Length: Period for CCI (default: 20)
MFI Length: Period for MFI (default: 14)
Williams %R Length: Period for Williams %R (default: 14)
Divergence Settings:
Pivot Lookback: Bars for pivot detection (default: 5)
Min Confluence: Minimum oscillators for signal (default: 3)
Show All Divergences: Display single-oscillator divergences (default: disabled)
Show Only Strong: Display only 4+ confluence (default: enabled)
Display Options:
Show Dashboard: Toggle dashboard (default: enabled)
Show Oscillators: Toggle oscillator plots (default: enabled)
Show Background Zones: Toggle extreme zone coloring (default: enabled)
Dashboard Position: Top-right, bottom-right, etc.
How to Use This Indicator
Step 1: Monitor Divergence Confluence
Watch the dashboard divergence score. Wait for 3+ oscillators showing divergence (score 4+) before considering reversal trades.
Step 2: Check Oscillator Extremes
Divergences are most reliable when oscillators are in extreme zones (RSI > 70 or < 30, MFI > 80 or < 20, etc.).
Step 3: Verify Alignment
Check oscillator alignment score. Low alignment (0-2) with high divergence confluence suggests strong reversal potential.
Step 4: Identify MEGA Divergences
When all 6 oscillators show divergence (MEGA), it signals extremely high probability reversal setup. These are rare but very reliable.
Step 5: Confirm with Price Action
Wait for price action confirmation (reversal candlestick patterns, trendline breaks) before entering trades based on divergences.
Step 6: Use for Exit Signals
If holding trend-following position and strong divergence appears, consider taking profits or tightening stops.
Best Practices
Use on 15-minute to 4-hour timeframes for optimal divergence reliability
Wait for 3+ oscillator confluence before acting on divergence signals
MEGA divergences (6/6) are rare but extremely reliable - don't ignore them
MFI divergences are particularly significant because they incorporate volume
Divergences in strong trends often lead to pullbacks, not full reversals
Combine with support/resistance levels for precise entry timing
Hidden divergences signal trend continuation, regular divergences signal reversal
Multiple consecutive divergences increase reversal probability
Use oscillator alignment to gauge overall momentum health
Indicator Limitations
Divergences can persist for extended periods before reversal occurs
Strong trends can continue despite multiple oscillator divergences
Pivot-based detection means divergences are confirmed with lag
False divergences can occur in choppy, ranging markets
MEGA divergences are rare - waiting only for these may miss opportunities
Oscillator calculations vary in sensitivity - some may diverge prematurely
Requires understanding of each oscillator's characteristics
No divergence system eliminates false signals entirely
Performance varies across different markets and volatility regimes
Technical Implementation
Built with Pine Script v6 using:
Six independent oscillator calculations
Pivot-based divergence detection for each oscillator
Confluence scoring algorithm with weighted components
Oscillator alignment tracking system
Enhanced 11-row dashboard with real-time updates
Dynamic background zones for extreme conditions
Anti-overlap logic for divergence labels
Gradient coloring for MACD histogram
The code is fully open-source and can be modified to adjust oscillator parameters, confluence thresholds, and visual preferences.
Originality Statement
This indicator is original in its multi-oscillator divergence confluence approach. While individual oscillators (RSI, MACD, Stochastic RSI, CCI, MFI, Williams %R) are established tools, this mashup is justified because:
It tracks divergences across six oscillators using fundamentally different calculations
The confluence scoring system quantifies divergence strength across multiple methods
Integration of volume-weighted divergence (MFI) with price-based oscillators
Oscillator alignment analysis provides momentum consensus measurement
Enhanced dashboard presents complex multi-oscillator data clearly
MEGA divergence detection identifies extremely rare, high-probability setups
Each oscillator contributes unique divergence information: RSI shows momentum speed divergence, MACD shows trend strength divergence, Stochastic RSI catches early divergences, CCI shows statistical divergence, MFI shows volume-weighted divergence, and Williams %R shows price extreme divergence. The mashup's value lies in identifying when multiple independent calculation methods simultaneously show momentum exhaustion, significantly reducing false signals.
Disclaimer
This indicator is provided for educational and informational purposes only. It is not financial advice or a recommendation to buy or sell any financial instrument. Trading involves substantial risk of loss and is not suitable for all investors.
Divergence indicators are analytical tools that identify potential momentum exhaustion, not guarantees of reversals. Divergences can persist for extended periods, and strong trends can continue despite multiple divergence signals. Past divergence performance does not guarantee future results.
The confluence score is a mathematical calculation based on current oscillator readings, not a prediction of future price movement. High confluence scores do not ensure profitable trades. Market conditions change, and divergence patterns that worked historically may not work in the future.
Always use proper risk management, including stop losses and position sizing appropriate for your account size and risk tolerance. Never risk more than you can afford to lose. Consider consulting with a qualified financial advisor before making investment decisions.
The author is not responsible for any losses incurred from using this indicator. Users assume full responsibility for all trading decisions made using this tool.
-Made with passion by officialjackofalltrades
Indicatore Pine Script®