BTC Hashrate ribbonsBTC Hash Rate ribbons / Hash Rate cross
This strategy goes long when BTCs Hash Rate 30 day moving average crosses above the 60 day moving average, signifying that miner capitulation is over and recovery has started.
When the opposite signal is given, which signifies the beginning of miner capitulation, the strategy goes short (or flat, depending on configuration). This is generally considered the most popular Hash Rate related strategy.
The strategy is based on this medium article: medium.com
Thanks to the recent integration of IntoTheBlock data into Tradingview, we can now effortlessly show Hash Rate data on our chart,
keep in mind however, that IntoTheBlock doesn't provide Hash Rate data on timeframes below daily, so this strategy is based used on the daily, weekly or even monthly time frames.
Hash Rate definition:
The Bitcoin hash rate is the number of times per second that computers on the Bitcoin network are hashing data to verify transactions and perform the encryption that secures the network. The hash rate is an indicator of how healthy the Bitcoin network is at any given time, and is driven primarily by difficulty mining and the number of miners. Generally, a high hash rate is considered a good thing.
More precisely, the Bitcoin hash rate is the number of times per second that computers on the Bitcoin network are hashing data to verify transactions and perform the encryption that secures the network.
Macro

BTC Hashrate with smoothingBTC Hashrate with smoothing - thanks to the recent integration of IntoTheBlock data into Tradingview, we can now effortlessly show Hashrate data on our chart.
One popular use for Hashrate is to buy when the 30 day moving average crosses above the 60 day moving average, signifying that miner capitulation is over and recovery has started.
Definition
The Bitcoin hash rate is the number of times per second that computers on the Bitcoin network are hashing data to verify transactions and perform the encryption that secures the network. The hash rate is an indicator of how healthy the Bitcoin network is at any given time, and is driven primarily by difficulty mining and the number of miners. Generally, a high hash rate is considered a good thing.
More precisely, the Bitcoin hash rate is the number of times per second that computers on the Bitcoin network are hashing data to verify transactions and perform the encryption that secures the network.

Directional Index Macro IndicatorWhat is This For?
The default settings for this indicator are for BINANCE:BTCUSDT and intended to be used on the 3D timeframe to identify market trends. This indicator does a great job identifying whether the market is bullish, bearish, or consolidating. This can also work well on lower time frames to help identify when a trend is strong or when it's reversing.
Directional Index Rate of Change
Core to this indicator is the rate at which DI+ and DI- are moving away or towards each other. This is called The Rate of Change (ROC). "The ROC length dictates how many bars back you want to compare to the current bar to see how much it has changed. It is calculated like this:
(source - source /source ) * 100"
The rate of change is smoothed using an EMA. A shorter EMA length will cause the ROC to flip back and forth between positive and negative while a larger EMA length will cause the ROC to change less often. Since the rate of change is used to indicate periods of 'consolidation', you want to find a setting that doesn't flip back and forth too often. Between the DI+ and DI- is a blue centerline. Offset from this centerline is a channel that is used to filter out false crosses of the DI+ and DI-. Sometimes, the DI+ and DI- lines will come together in this channel and cross momentarily before resuming the direction prior to the cross. When this happens, you don't want to flip your bias too soon. The wider the channel, the later the indicator will signal a DI reversal. A narrower channel will call it sooner but risks being more choppy and indicating a false cross.
Indicator Status Line
This indicator has 4 values in the status line (in order):
DI+
DI-
Distance between DI+ and DI-
DI Rate of Change ( how quickly are DI+ and DI- moving away or towards center )
Indicator Plots
This indicator plots DI+ (green), DI- (red), and a center channel between DI- and DI+. Across the top of the indicator, red and green triangles indicate the market trend while the background changes to show whether the price is in an impulse wave or consolidating. This makes up 4 possible scenarios:
Bullish impulse wave ( green triangle up + green background )
Bullish consolidation ( green triangle up + yellow background )
Bearish impulse wave ( red triangle down + red background )
Bearish consolidation ( red triangle down + yellow background )
Summary
Combined with support and resistance levels, volume, and your other favorite indicators, this can be a useful tool for validating that your entries are not going against the trend.
Disclaimer
This is not financial advice. Do not take trades only based on the DI+ and DI- crossing. Always use multiple indicators to validate your entries and never take a trade when you aren’t emotionally grounded. Have a plan. Stick to the plan.
The screenshot for this strategy is of a manual historical review of BTC on the 3 day chart. The indicator was built to try and mimic the chart above. You’ll see that it nails it sometimes, is a little late sometimes, and chops around between consolidation and impulse waves when it should stay in consolidation. Share your settings if you are able to improve the choppiness without sacrificing catching the reversals early.

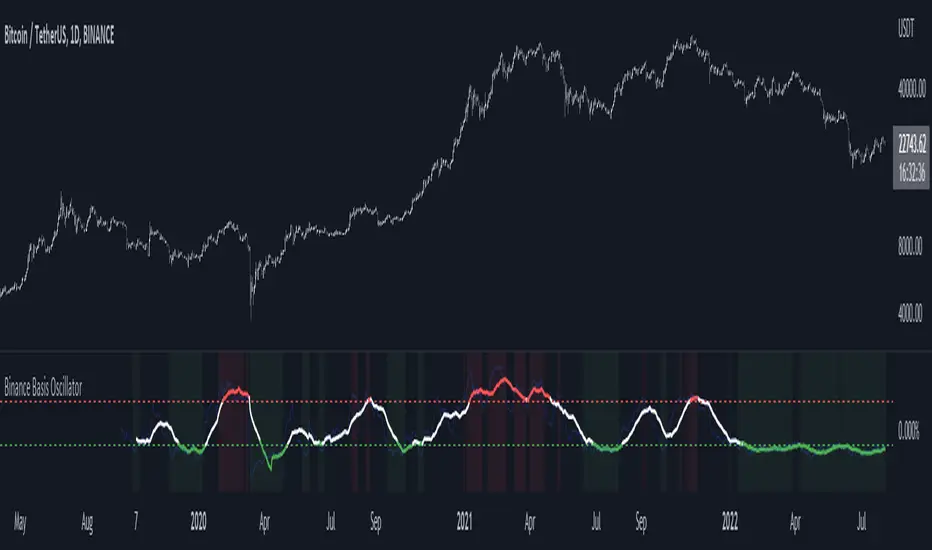
Binance Basis OscillatorBinance Basis Oscillator illustrates the premium or discount between Binance spot vs perps.
This indicates whether speculators (i.e. traders on perps) are paying premium vs spot. If true then speculation is leading, indicating euphoria (at certain levels).
Conversely, spot leading perps (i.e. perps at a discount) shows extreme bearish conditions, where speculation is on the short side. Indicating times of despair.
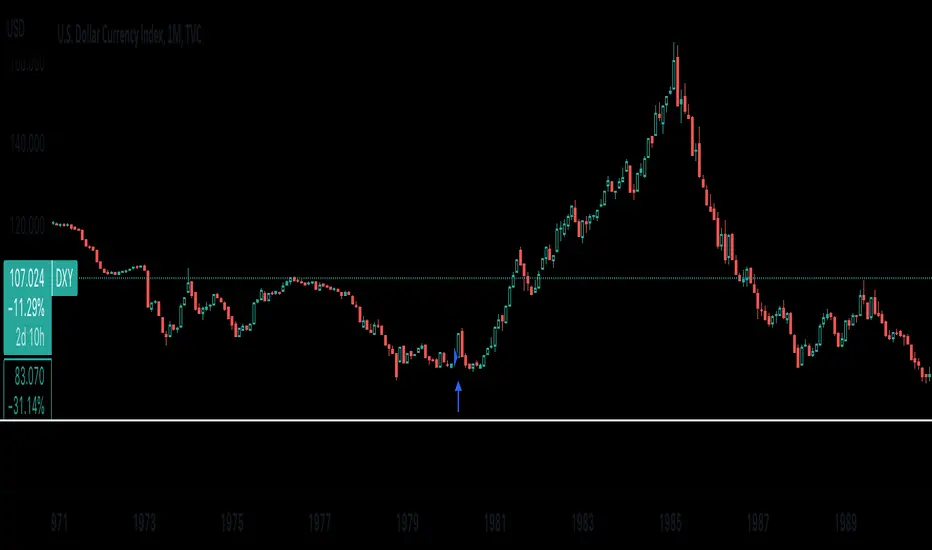
When was the last time we were in stagflation?Here I coded a strategy that indicates when we should enter a long position in the US dollar. The three indicators I used were the Inflation Rate, 10Y interest rate, and GDP growth rate. Right now in our economy, It seems as though we are in stagflation due to high inflation and declining GDP growth. Thoughts on how our government should handle the oversupply of money in the economy right now are another conversation. The reason I built this indicator is to see when the last time our country was in this type of market environment was and to see how far the dollar rose from that point on. It is necessary to say that the US dollar generally does not show these steep increases in value unless there is a hard cut in the Money supply. However, what we see is that the last time we were in stagflation was around the early 1980s when the dollar value rose to around 107( the levels we're at right now) and did not stop until It hit its peak at 150!!!! This isn't all that exciting really because if the FED follows a similar path as It did back in the '80s then we are going to see a whole lot more money supply being cut, an increase in interest rates, and a declining GDP Growth rate.
ATTENTION: This indicator does not tell you to buy any financial instrument that follows the DXY(US Dollar index), with that being said please feel free to comment and tell me your opinion. whether it's how bad my coding is(I'm a beginner sorry!!) or whether my ideas on our market environment right now are bogus or just do not make sense.
Pi Cycle Bottom IndicatorBack in June 2021, I was able to find two moving averages that crossed when Bitcoin reached it's cycle bottom, similar to Philip Swift's Pi-Cycle Top indicator.
The moving average pair used here was the x0.475 multiple of the 471 MA and the 150 EMA ( EMA to take into account of short term volatility ).
I have a more in-depth analysis and explanation of my findings on my medium page .
Trader Dončić.

Moving Average Macro Trend FilterA simple indicator that adds a background fill to your chart based on a fast and slow moving average.
When the fast moving average is above the slow moving average, the background is green.
When the slow moving average is above the fast moving average, the background is red.
If the fast and slow moving average don't agree on direction, the background is yellow.
Pick between EMA, SMA, RMA, WMA
Select different timeframes for chart, slow MA, and fast MA

Macro EMA Correlation
This script is useful to see correlation between macroeconomic assets, displayed in different ema line shown in percentage to compare these assets on the same basis. Percentage will depend on the time frame selection. In the higher timeframe you will see higher variation and in small timeframe smaller variation.
You can select the timeframe who suit your trading style. The 1h and 4h fit well for longer trend swing trade and the lower time frame 15m, 5m, 1m are good for scalping or daily trading.
The following asset are available:
Bitcoin
Ethereum
Gold
Crypto total market cap excluding bitcoin (total2)
United state 10-year government bond (US10Y)
Usdt dominance show the concentration of usdt hold. For example, when trader are fearful they sell their crypto position to keep more usdt in their portfolio (USDT.D)
The USD/JPY pair the dollar usd versus the Japanese Yen one of the most forex traded pair.
You can clic on parameter to select the asset you want to analyse.
The main correlation observed are:
bitcoin negatively correlated with the usdt dominance.
bitcoin negatively correlated with the usd/jpy pair
bitcoin is positively correlated to eth, total2 (altcoin)
bitcoin positively correlated with gold
bitcoin is mostly negatively correlated to us10y
The basis of correlation is that positively correlated asset goes in the same direction and that the negatively correlated goes in opposite direction.
So, the idea is to use these information to see trend reversing.
Example 1: when bitcoin and usdt dominance are extended in opposite direction we look for a possible retracement toward 1% wich is the middle base.
Example 2 : when bitcoin make a move we look for ethereum and total 2 to follow

MicroStrategy MetricsA script showing all the key MSTR metrics. I will update the script every time degen Saylor sells some more office furniture to buy BTC.
All based around valuing MSTR, aside from its BTC holdings. I.e. the true market cap = enterprise value - BTC holdings. Hence, you're left with the value of the software business + any premium/discount decided by investors.
From this we can derive:
- BTC Holdings % of enterprise value
- Correlation to BTC (in this case we use CME futures...may change this)
- Equivalent Share Price (true market cap divided by shares outstanding)
- P/E Ratio (equivalent share price divided by quarterly EPS estimates x 4)
- Price to FCF Ratio (true market cap divided by FCF (ttm))
- Price to Revenue (^ but with total revenue (ttm))

Velocity To Inverse Correlation to VIX/Bonds Strategy (2020)This strategy measures and creates a signal when an asset is moving out of a correlation with high yield bonds or the CBOE VIX into an inverse correlation, as well as when an asset is losing correlation with a top corporate bonds ETF. When this signal is triggered, the simulation has the portfolio asset go long.
Additionally, exits are based on a 2% stop loss and a 2% take profit for simplicity sake to indicate whether the direct next move in the asset is up or down.
This was originally tested as a descent indicator for Ethereum's 2020 moves as institutional investors moved into the market.

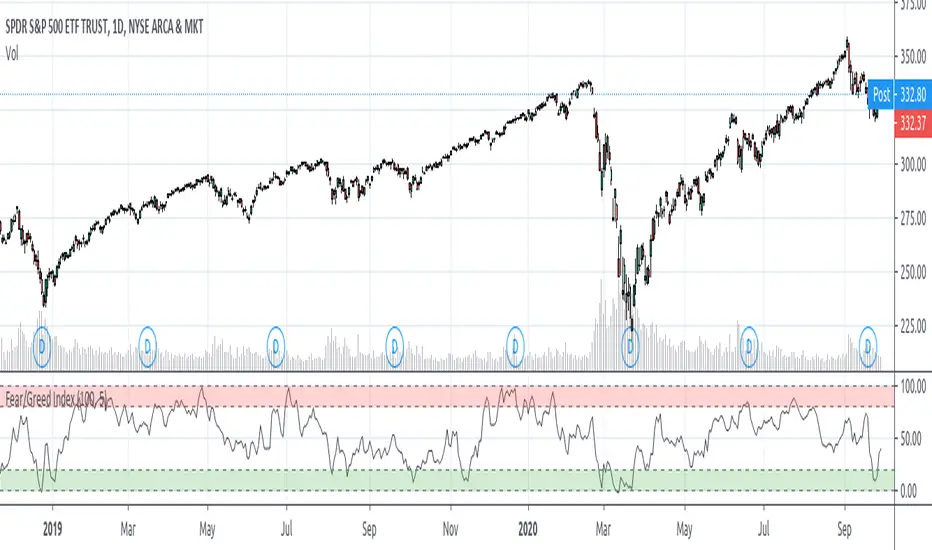
Fear/Greed IndexMy goal was to create something akin to the Fear & Greed Index ( money.cnn.com ) that CNN and others do.
A Fear/Greed Index can be used by any trader or investor but I believe it's best viewed with a contrarian's eye--
When the market appears to be signalling Extreme Fear, that is a good place to start buying from emotional players who want to sell no matter the price
When signalling Extreme Greed, that may be a good place to start taking profits off or getting hedged, as there may be too much exuberance in the air
Important to note and remember, however, is that there can often times be fear in the air for good reasons! I like to see this as if we dip into extreme fear and return shortly after, the fear may warrant constraint from buying, or returning back to extreme greed may be a very strong market extension
The script draws from several other tickers which I have read and personally observed to be decent macro correlations for the stock market (specifically the SP500). For the state of each of these metrics I gave a rating, good or bad, then added them together and put it into your standard Stochastic.
These macro correlations include--
The % of stocks in the SP500 above multiple Simple Moving Average lengths
VIX and its term-structure (contango, backwardation)
Treasury Bonds
Gold
Junk/High Yield Bonds
The Put/Call Ratio
The SP500 Options Skew
Advancing and Declining Issues
On some of these I opted to use a function for the Relative Momentum Index instead of RSI, as the RMI oscillates better (in my opinion). I also used a Band-Pass Filter/Double EMA for smoothing the results of the stochastic.
A LOT of these numbers were made to my own observation and discretion and can get out-dated over time. With that said, PLEASE feel free to revise, fine tune, modify this as you wish to optimize yours. And please let me know if I have made any mistakes here or something should be added.
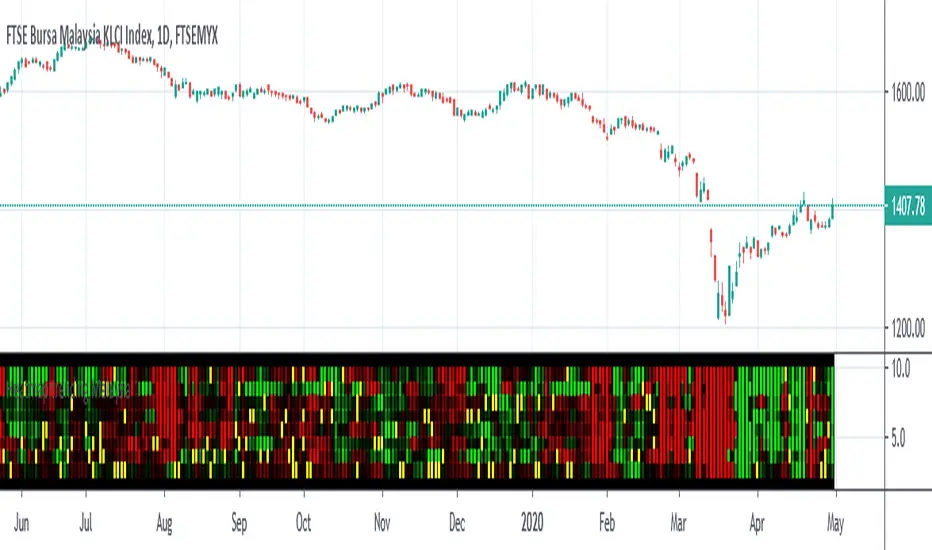
Heatmap trending MalaysiaThis heatmap chart is created base on Heikin Ashi trend for Malaysia Major Index
CONSTRUCTN ,TECHNOLOGY,FINANCE,CONSUMER,PROPERTIES,IND-PROD,PLANTATION,REIT.
This allow compare to malaysia stock for macro trending.
Lastly ,thank to LonesomeTheBlue which inspire me for this coding .
Macroeconomic Artificial Neural Networks
This script was created by training 20 selected macroeconomic data to construct artificial neural networks on the S&P 500 index.
No technical analysis data were used.
The average error rate is 0.01.
In this respect, there is a strong relationship between the index and macroeconomic data.
Although it affects the whole world,I personally recommend using it under the following conditions: S&P 500 and related ETFs in 1W time-frame (TF = 1W SPX500USD, SP1!, SPY, SPX etc. )
Macroeconomic Parameters
Effective Federal Funds Rate (FEDFUNDS)
Initial Claims (ICSA)
Civilian Unemployment Rate (UNRATE)
10 Year Treasury Constant Maturity Rate (DGS10)
Gross Domestic Product , 1 Decimal (GDP)
Trade Weighted US Dollar Index : Major Currencies (DTWEXM)
Consumer Price Index For All Urban Consumers (CPIAUCSL)
M1 Money Stock (M1)
M2 Money Stock (M2)
2 - Year Treasury Constant Maturity Rate (DGS2)
30 Year Treasury Constant Maturity Rate (DGS30)
Industrial Production Index (INDPRO)
5-Year Treasury Constant Maturity Rate (FRED : DGS5)
Light Weight Vehicle Sales: Autos and Light Trucks (ALTSALES)
Civilian Employment Population Ratio (EMRATIO)
Capacity Utilization (TOTAL INDUSTRY) (TCU)
Average (Mean) Duration Of Unemployment (UEMPMEAN)
Manufacturing Employment Index (MAN_EMPL)
Manufacturers' New Orders (NEWORDER)
ISM Manufacturing Index (MAN : PMI)
Artificial Neural Network (ANN) Training Details :
Learning cycles: 16231
AutoSave cycles: 100
Grid
Input columns: 19
Output columns: 1
Excluded columns: 0
Training example rows: 998
Validating example rows: 0
Querying example rows: 0
Excluded example rows: 0
Duplicated example rows: 0
Network
Input nodes connected: 19
Hidden layer 1 nodes: 2
Hidden layer 2 nodes: 0
Hidden layer 3 nodes: 0
Output nodes: 1
Controls
Learning rate: 0.1000
Momentum: 0.8000 (Optimized)
Target error: 0.0100
Training error: 0.010000
NOTE : Alerts added . The red histogram represents the bear market and the green histogram represents the bull market.
Bars subject to region changes are shown as background colors. (Teal = Bull , Maroon = Bear Market )
I hope it will be useful in your studies and analysis, regards.
