Intraday Uncertainty [PhenLabs]📊 Intraday Uncertainty
Version: PineScript™ v6
📌 Description
The Intraday Uncertainty indicator offers traders a visual representation of market certainty/uncertainty during trading sessions. By comparing each price bar’s range to the Average True Range (ATR), it provides an intuitive way to gauge market conviction through a color gradient system.
This tool helps traders identify periods of high certainty (potentially trending markets) versus high uncertainty (potentially choppy or volatile markets) without complex calculations or multiple indicators. The color-coded bars create an immediate visual cue to support decision-making in varying market conditions.
🚀 Points of Innovation
Automated range-to-ATR ratio calculation that adapts to changing market volatility
Dynamic color gradient system that visually distinguishes between certain and uncertain price action
Customizable gradient clamping to fine-tune sensitivity to market conditions
Integrated dashboard that provides clear interpretation guidance
Position-flexible legend that accommodates different chart layouts
Highly optimized for performance with minimal calculation overhead
🔧 Core Components
ATR Calculation: Measures market volatility using a configurable lookback period
Range-to-ATR Ratio: Compares current bar’s high-low range against average volatility
Gradient Mapping System: Converts numerical uncertainty values into an intuitive color scale
Dashboard Legend: Provides clear interpretation guidance with customizable positioning
🔥 Key Features
Bar Coloring: Instantly identifies market certainty levels through intuitive color gradients
Customizable ATR Period: Adjust sensitivity to historical volatility based on trading style
Gradient Clamping: Fine-tune the color sensitivity using the Range/ATR multiplier
Color Customization: Personalize the color scheme to match your chart aesthetics
Informative Dashboard: Quickly interpret color meanings with the optional on-chart legend
Flexible Display Options: Customize dashboard position and text size for your chart layout
🎨 Visualization
Color Gradient: Bars colored on a spectrum from green (high certainty) to red (high uncertainty)
Dashboard Legend: Optional on-chart guide explaining the color interpretation
Color Intensity: Stronger colors indicate more extreme certainty/uncertainty levels
At-a-glance Interpretation: Quickly identify market conviction without analyzing numbers
📖 Usage Guidelines
Calculation Settings
ATR Period
Default: 14
Range: 1+
Description: Controls the lookback period for ATR calculation. Lower values increase sensitivity to recent volatility, while higher values provide more stability.
Gradient Clamp (Range/ATR Multiplier)
Default: 2.0
Range: 0.1+
Description: Sets the maximum Range/ATR ratio for gradient scaling. Ranges above this value display the end color (high uncertainty).
Color Settings
Gradient Start Color (High Certainty)
Default: Green
Description: Color representing high market certainty (low Range/ATR ratio)
Gradient End Color (Low Certainty)
Default: Red
Description: Color representing low market certainty (high Range/ATR ratio)
Dashboard Settings
Show Dashboard Legend
Default: True
Description: Toggles the visibility of the on-chart interpretation guide
Dashboard Position
Options: top_right, top_left, bottom_right, bottom_left, middle_right, middle_left
Default: bottom_right
Description: Controls the placement of the dashboard on your chart
Dashboard Text Size
Options: tiny, small, normal, large, huge
Default: normal
Description: Adjusts the text size of the dashboard for readability
✅ Best Use Cases
Identifying potential trend shifts when certainty levels change dramatically
Confirming trend strength through consistent certainty levels
Detecting choppy/sideways markets with persistent high uncertainty
Filtering trading signals from other indicators based on certainty levels
Gauging market conviction behind price breakouts or pullbacks
Optimizing entry/exit timing based on certainty/uncertainty transitions
⚠️ Limitations
Does not predict future price direction, only measures current bar certainty
May provide false signals during news events or unexpected volatility spikes
Requires context within the broader market environment for optimal interpretation
Color interpretation is relative rather than absolute across different securities
ATR-based calculation means sensitivity varies across different timeframes
💡 What Makes This Unique
Simplicity: Single visual indicator that doesn’t require multiple technical tools
Adaptability: Automatically adjusts to changing market volatility conditions
Contextual Analysis: Provides market conviction context beyond just price movement
Intuitive Design: Color-based system that requires minimal learning curve
Efficiency: Lightweight calculation that doesn’t impact chart performance
🔬 How It Works
1. ATR Calculation:
Calculates the Average True Range using the specified period
Establishes a baseline for normal market volatility
2. Range Analysis:
Measures each bar’s high-low range
Compares this range to the current ATR value to create a ratio
3. Gradient Mapping:
Converts the Range/ATR ratio to a normalized value between 0 and 1
Maps this value onto a color gradient between the start and end colors
Applies the resulting color to the price bar
4. Dashboard Creation:
Constructs an information panel on the last visible bar
Populates it with color samples and interpretation guidance
💡 Note:
This indicator works best when used in conjunction with other technical analysis tools rather than in isolation. The certainty/uncertainty measure provides context for your trading decisions but should not be the sole basis for entries and exits. Consider using higher certainty periods for trend-following strategies and exercise caution during periods of high uncertainty.
Marketconditions

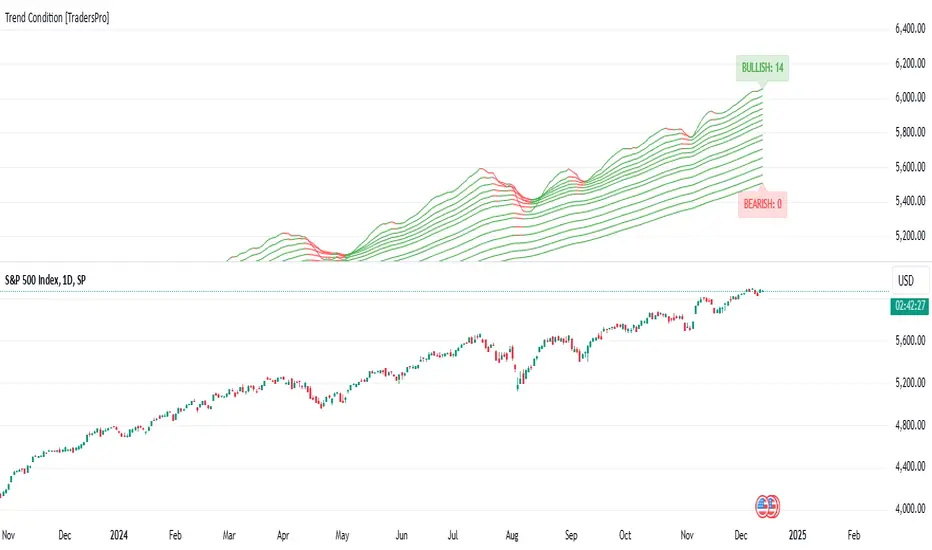
Trend Condition [TradersPro]
OVERVIEW
The Trend Condition Indicator measures the strength of the bullish or bearish trend by using a ribbon pattern of exponential moving averages and scoring system. Trend cycles naturally expand and contract as a normal part of the cycle. It is the rhythm of the market. Perpetual expansion and contraction of trend.
As trend cycles develop the indicator shows a compression of the averages. These compression zones are key locations as trends typically expand from there. The expansion of trend can be up or down.
As the trend advances the ribbon effect of the indicator can be seen as each average expands with the price action. Once they have “fanned” the probability of the current trend slowing is high.
This can be used to recognize a powerful trend may be concluding. Traders can tighten stops, exit positions or utilize other prudent strategies.
CONCEPTS
Each line will display green if it is higher than the prior period and red if it is lower than the prior period. If the average is green it is considered bullish and will score one point in the bullish display. Red lines are considered bearish and will score one point in the bearish display.
The indicator can then be used at a quick glance to see the number of averages that are bullish and the number that are bearish.
A trader may use these on any tradable instrument. They can be helpful in stock portfolio management when used with an index like the S&P 500 to determine the strength of the current market trend. This may affect trade decisions like possession size, stop location and other risk factors.
Larry Williams Valuation Index [tradeviZion]Larry Williams Valuation Index
Welcome to the Larry Williams Valuation Index by tradeviZion! This script is an interpretation of Larry Williams' famous WillVal (Valuation) Index, originally developed in 1990 to help traders determine whether a market or asset is overvalued or undervalued. We've extended it to support multiple securities and offer alerts for different valuation levels, helping you make more informed trading decisions.
What is the Valuation Index?
The Valuation Index measures how a security's current price compares to its historical price action. It helps identify whether the security is overvalued (priced too high), undervalued (priced too low), or in a normal range.
This version supports multiple securities and uses valuation parameters to help you assess the relative valuation of three securities simultaneously. It can help you determine the best times to enter (buy) or exit (sell) the market.
Key Features
Multi-Security Analysis: Analyze up to three securities simultaneously to get a broader view of market conditions.
Valuation Levels: Automatically calculate overvaluation and undervaluation levels or set manual levels for consistent analysis.
Custom Alerts: Create custom alerts when securities move between overvalued, undervalued, or normal ranges.
Customizable Table Display: Display a table with valuation values and their status on the chart.
Getting Started
Step 1: Adding the Script to Your Chart
First, add the Larry Williams Valuation Index script to your chart on TradingView. The script is designed to work with any timeframe, but for best results, use weekly or daily timeframes for a longer-term perspective.
Step 2: Configuring Securities
The script allows you to analyze up to three different securities :
Security 1 (Default: DXY)
Security 2 (Default: GC1!)
Security 3 (Default: ZB1!)
You can enable or disable each security individually.
Custom Timeframe Option: You have the option to select a custom timeframe for analysis. This allows you to see whether the security is overvalued or undervalued in lower or higher timeframes. Note that this feature is experimental and has not been extensively tested. Larry Williams originally used the weekly timeframe to determine if a stock was overvalued or undervalued. By default, the indicator compares the current price with the security based on the selected timeframe, except if you choose to use a custom timeframe.
Pro Tip : New users can start with the default securities to understand the concept before using other assets.
Step 3: Valuation Index Settings
Short EMA Length : This is the short-term average used for calculations. A lower value makes it more responsive to recent price changes.
Long EMA Length : This is the long-term average, used to smooth the valuation over time.
Valuation Length (Default: 156) : Represents approximately three years of daily bars (as recommended by Larry Williams).
How is the Valuation Index Calculated?
The valuation calculation is done using a method called WVI (WillVal Index), which compares the current price of a security to the price of another correlated security. Here’s a step-by-step explanation:
1. Data Collection: The script takes the closing price of the security you are analyzing and the closing price of the correlated security.
2. Ratio Calculation : The ratio of the two prices is calculated:
Price Ratio = (Price of your security) / (Price of correlated security) * 100.
This ratio helps determine how expensive or cheap your security is compared to the correlated one.
3. Exponential Moving Averages (EMAs) : The price ratio is used to calculate short-term and long-term EMAs (Exponential Moving Averages). EMAs are used to create smooth lines that represent the average price of a security over a specific period of time, with more weight given to recent data. By calculating both short-term and long-term EMAs, we can identify the trend direction and how the security is performing compared to its historical averages.
4. Valuation Index Calculation:
The Valuation Index is calculated as the difference between the short-term EMA and the long-term EMA. This difference helps to determine if the security is currently overvalued or undervalued:
A positive value indicates that the price is above its longer-term trend, suggesting potential overvaluation.
A negative value indicates that the price is below its longer-term trend, suggesting potential undervaluation.
5. Normalization:
To make the valuation easier to interpret, the calculated valuation index is then normalized using the highest and lowest values over the selected valuation length (e.g., 156 bars).
This normalization process converts the index into a percentage between 0 and 100, where higher values indicate overvaluation and lower values indicate undervaluation.
Step 4: Understanding Valuation Levels
The valuation levels indicate whether a security is currently undervalued, overvalued, or in a normal range.
Manual Levels : You can manually set the overvaluation and undervaluation thresholds (default is 85 for overvalued and 15 for undervalued).
Auto Levels : The script can automatically calculate these levels based on recent price action, allowing you to adapt to changing market conditions.
Auto Levels Calculation Explained:
The Auto Levels are calculated by taking the average of the valuation indices for all three securities (e.g., index1, index2, and index3).
The script then looks at the highest and lowest values of this average over a selected number of recent bars (e.g., 50 bars).
The overvaluation level is determined by taking the highest value and multiplying it by a multiplier (e.g., 5). Similarly, the undervaluation level is calculated using the lowest value and the multiplier.
These dynamic levels adjust according to recent price action, providing an adaptive approach to identifying overvalued and undervalued conditions.
Step 5: How to Use the Script to Make Trading Decisions
For new users, here's a step-by-step trading strategy you can use with the Valuation Index:
1. Identify Undervalued Opportunities
When two or more securities are in the undervalued range (below 15 for manual or below automatically calculated undervalue levels), wait for at least two of these securities to turn from undervalued to normal .
This transition indicates a potential buy opportunity .
2. Buying Signal
When at least two securities transition from undervalued to normal, you can consider buying the asset.
This indicates that the market may be recovering from undervalued conditions and could be moving into a growth phase.
3. Selling Signal
Exit when the price high closes below the EMA 21 (21-day exponential moving average).
Alternatively, if the valuation index reaches overvalued levels (above 85 manually or auto-calculated), wait for it to drop back to normal . This can be another point to exit the trade .
You can also use any other sell condition based on your r isk management strategy .
Alerts for Valuation Levels
The script includes alerts to notify you of changing market conditions:
To activate these alerts, follow these steps, referring to the provided screenshot with detailed steps:
1. Enable Alerts : Click on the settings gear icon on the script title in your chart. In the settings menu, scroll to the section labeled Alerts Settings .
Enable Alerts by checking the Enable Alerts box.
Set the Required Securities for Alert (default is 2 securities).
Choose the Alert Frequency : Selecting Once Per Bar Close will trigger alerts only at the close of each bar, ensuring you receive confirmed signals rather than potentially noisy intermediate signals.
2. Select Alert Type : Choose the type of alert you want to activate, such as Alert on Overvalued, Alert on Undervalued, Alert on Over to Normal , or Alert on Under to Normal .
3. Save Settings : Click OK to save your alert settings.
4. Add Alert on Indicator : Click the "..." (More button) next to the indicator name on the chart and select " Add alert on tradeviZion - WillVal ".
5. Create Alert : In the Create Alert window:
Set Condition to tradeviZion - WillVal .
Ensure Any alert() function call is selected.
Set the Alert Name and select your Expiration preferences.
6. Set Notification Preferences : Go to the Notifications tab and select how you want to receive notifications, such as via app notification, toast notification, email , or sound alert . Adjust these preferences to best suit your needs.
7. Click Create : Finally, click Create to activate the alert.
These alerts will help you stay informed about key market conditions and take action accordingly, ensuring you do not miss critical trading opportunities.
Understanding the Table Display
The script includes an interactive table on the chart to show the valuation status of each security:
Security : The name of the security being analyzed.
Value : The current valuation index value.
Status : Indicates whether the security is overvalued, undervalued , or in a normal range.
Color: Displays a color code for easy identification of status:
Red for overvalued.
Green for undervalued.
Other colors represent normal valuation levels.
Empowering Messages : Motivational messages are displayed to encourage disciplined trading. These messages will change periodically, helping keep a positive trading mindset.
Acknowledgment
This tool builds upon the foundational work of Larry Williams, who developed the WillVal (Valuation) Index concept. It also incorporates enhancements to extend multi-security analysis, valuation normalization, and advanced alerting features, providing a more versatile and powerful indicator. The Larry Williams Valuation Index [ tradeviZion ] helps traders make informed decisions by assessing overvalued and undervalued conditions for multiple securities simultaneously.
Note : Always practice proper risk management and thoroughly test the indicator to ensure it aligns with your trading strategy. Past performance is not indicative of future results.
Trade smarter with TradeVizion—unlock your trading potential today!
