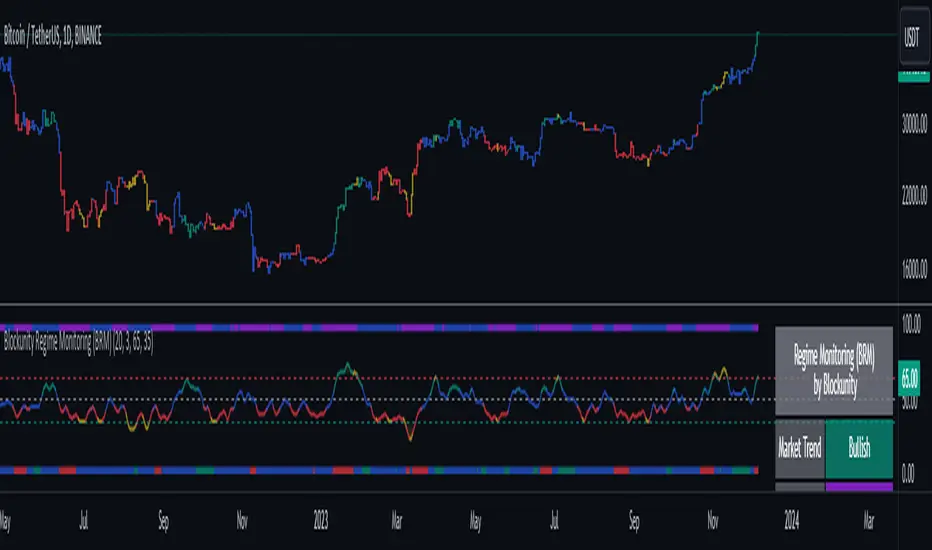
Dual-Phase Trend Regime Oscillator (Zeiierman)█ Overview
Trend Regime: Dual-Phase Oscillator (Zeiierman) is a volatility-sensitive trend classification tool that dynamically switches between two oscillators, one optimized for low volatility, the other for high volatility.
By analyzing standard deviation-based volatility states and applying correlation-derived oscillators, this indicator reveals not only whether the market is trending but also what kind of trend regime it is in —Bullish or Bearish —and how that regime reacts to market volatility.
█ Its Uniqueness
Most trend indicators assume a static market environment; they don't adjust their logic when the underlying volatility shifts. That often leads to false signals in choppy conditions or late entries in trending phases.
Trend Regime: Dual-Phase Oscillator solves this by introducing volatility-aware adaptability. It switches between a slow, stable oscillator in calm markets and a fast, reactive oscillator in volatile ones, ensuring the right sensitivity at the right time.
█ How It Works
⚪ Volatility State Engine
Calculates returns-based volatility using standard deviation of price change
Smooths the current volatility with a moving average
Builds a volatility history window and performs median clustering to determine typical "Low" and "High" volatility zones
Dynamically assigns the chart to one of two internal volatility regimes: Low or High
⚪ Dual Oscillators
In Low Volatility, it uses a Slow Trend Oscillator (longer lookback, smoother)
In High Volatility, it switches to a Fast Trend Oscillator (shorter lookback, responsive)
Both oscillators use price-time correlation as a measure of directional strength
The output is normalized between 0 and 1, allowing for consistent interpretation
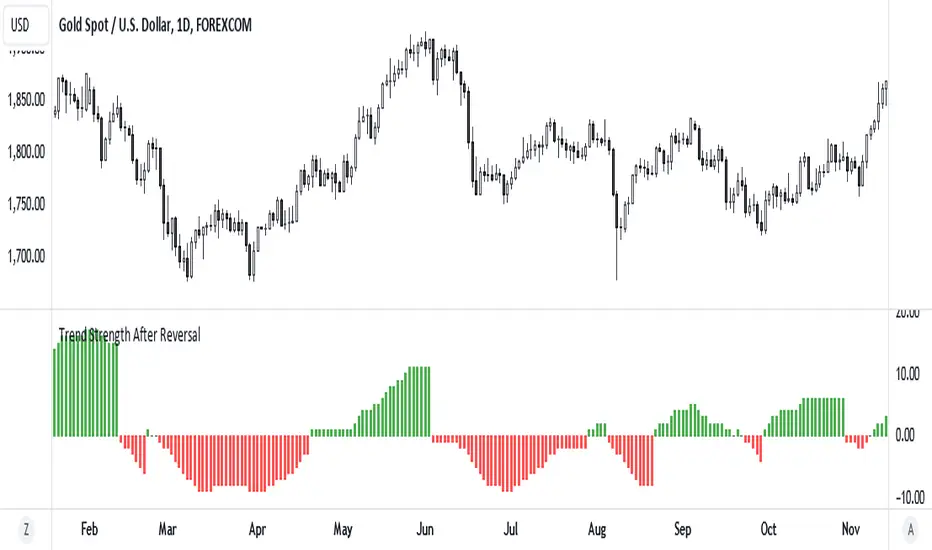
⚪ Trend Regime Classification
The active oscillator is compared to a neutral threshold (0.5)
If above: Bullish Regime, if below: Bearish Regime, else: Neutral
The background and markers update to reflect regime changes visually
Triangle markers highlight bullish/bearish regime shifts
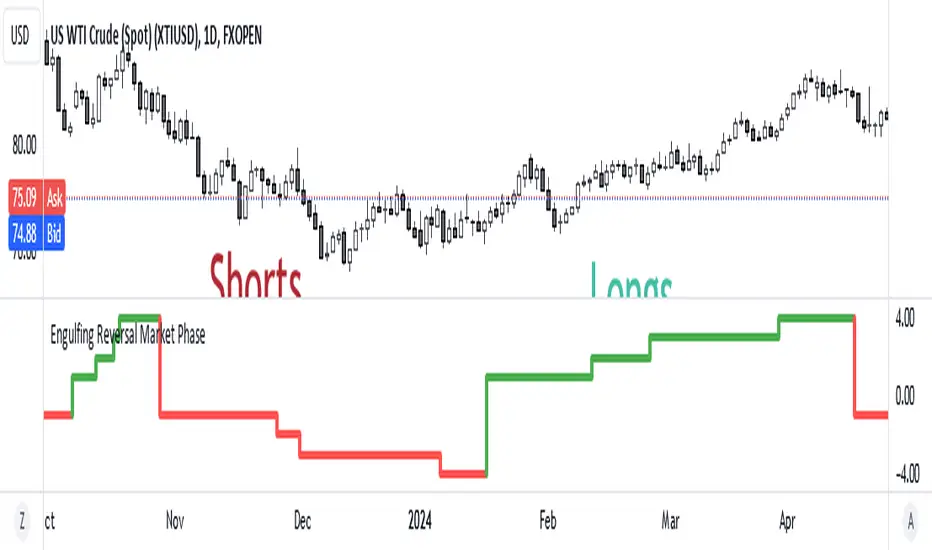
█ How to Use
⚪ Identify Current Trend Regime
Use the background color and chart table to immediately recognize whether the market is trending up or down.
⚪ Trade Regime Shifts
Use triangle markers (▲ / ▼) to spot fresh regime entries, which are ideal for confirming breakouts within trends.
⚪ Pullback Trading
Look for pullbacks when the trend is in a stable condition and the slow oscillator remains consistently near the upper or lower threshold. Watch for moments when the fast oscillator retraces back toward the midline, or slightly above/below it — this often signals a potential pullback entry in the direction of the prevailing trend.
█ Settings Explained
Length (Slow Trend Oscillator) – Used in calm conditions. Longer = smoother signals
Length (Fast Trend Oscillator) – Used in volatile conditions. Shorter = more responsive
Volatility Refit Interval – Controls how often the system recalculates Low/High volatility levels
Current Volatility Period – Lookback used for immediate volatility measurement
Volatility Smoothing Length – Applies an SMA to the raw volatility to reduce noise
-----------------
Disclaimer
The content provided in my scripts, indicators, ideas, algorithms, and systems is for educational and informational purposes only. It does not constitute financial advice, investment recommendations, or a solicitation to buy or sell any financial instruments. I will not accept liability for any loss or damage, including without limitation any loss of profit, which may arise directly or indirectly from the use of or reliance on such information.
All investments involve risk, and the past performance of a security, industry, sector, market, financial product, trading strategy, backtest, or individual's trading does not guarantee future results or returns. Investors are fully responsible for any investment decisions they make. Such decisions should be based solely on an evaluation of their financial circumstances, investment objectives, risk tolerance, and liquidity needs.
Indicatore Pine Script®